Generation and communication of dynamic maps using light
projection
Steffen Busch,
aAlexander Schlichting,
aClaus Brenner
aa Institute of Cartography and Geoinformatics, Leibniz University Hannover, Germany; [email protected], [email protected], [email protected]
Abstract: Many accidents are caused by miscommunication between traffic participants. Much research is being conducted in the area of car to car and car to infrastructure communication in order to eliminate this cause of accidents. How-ever, less attention is paid to the question how the behavior of a car can be communicated to pedestrians. Especially considering automated traffic, there is a lack of communication between cars and pedestrians.
In this paper, we address the question how an autonomously driving car can inform pedestrians about its intentions. Especially in case of highly automated driving, making eye contact with a driver will give no clue about his or her intensions. We developed a prototype which continuously informs pedestrians about the intentions of the vehicle by projecting visual patterns onto the ground. Furthermore, the system communicates its interpretation of the observed situation to the pedestrians to warn them or to encourage them to perform a certain action. In order to communicate adaptively, the vehicle needs to develop an understanding of the dynamics of a city to know what to expect in certain situations and what speed is appropriate. To support this, we created a dynamic map, which estimates the number of pedestrians and cyclists in a certain area, which is then used to determine how ‘hazardous’ the area is. This dynamic map is obtained from measurement data from many time instances, in contrast to the static car navigation maps, which are prevalent today. Apart from being used for communication purposes, the dynamic map can also influence the speed of a car, be it manually or autonomously driven. Adapting the speed in hazardous areas will avoid accidents where a car drives too fast, so that neither a human nor a computer-operated system would be able to stop in time.
Keywords: Maps, Visualization, Communication
1.
Introduction
According to the global status report on road safety by the World Health Organization (WHO 2013), road traffic injuries are the eighth leading cause of death. 1.24 million people die annually as a result of a road injury. 27% of the road deaths are pedestrians and cyclists. In low- and middle-income countries this number even goes up to a third of all fatalities. In contrast to the global road safety statistics, there is the vision that automated, self-driving cars will help to reach the goal of zero traffic accidents. However, one of the most challenging tasks is to determine the intentions of pedestrians and bicyclists in urban environments.
In contrast to the tracking of cars, which are constrained in their movement and allow for a quite precise modeling of their vehicle dynamics, pedestrians (and to a lesser extent, bicyclists) may instantly change their heading and speed. Even though assistance systems have shorter reaction times as a human and show no fatigue, they still need a minimum time to analyze the threat, eliminate false alarms, and bring the car to a safe stop. Thus, in order to implement the vision of zero accidents in urban settings, the cars would have to drive extremely slow, making this solution highly unattractive.
The observation of human behavior in these kinds of situations contributes to the solution of this problem.
Hu-environment, especially if they know it from their daily commute and have observed possibly hazardous situations at certain locations in the past. Hence, it is not only the static ‘background’ information, which helps them to master the current situation but also the knowledge of areas which are more risky than others due to regular local events, such as accidents or dangerous situations. Even though this knowledge is just a prior, it helps to reduce the risk in critical situations. With regard to vehicles it means that they have to analyze their environment continuously. Sensors like laser scanners or cameras can map dynamic objects that occur in traffic scenes. The on-board computer interprets the data and stores the crucial information in a joint map of all vehicles in a certain region.
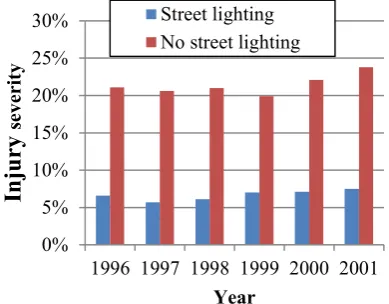
person’s behavior and signal its own intentions, like its willingness to stop or letting a pedestrian cross the road. At night the number of fatalities per kilometer driven becomes significantly higher than during daytime. Especially the number of fatal pedestrian accidents is up to seven times higher in the dark (Plainis et al. 2006). Fig. 1 illustrates the impact of street lighting in Greece between 1995 and 2001 by the injury severity rate. In this case severity is defined as the ratio of the number of fatal collisions per 100 collisions. The absence of street lighting has a serious impact on the injury severity rate, which increases by a factor of about three to more than 20%. These figures are approximately constant over the years. If a sufficient street lighting infrastructure is lacking, the vehicles will be responsible to solve this problem. This can be done by lighting hazardous areas through an addition to the vehicle’s headlights by utilizing a map where such areas are recorded and marked.
Fig. 1. Greece injury severity rates under different street lighting conditions (source: General Secretariat of National Statistical Service of Greece, 1996-2002).
The two key components, a background map of dynamic behavior and the communication with the environment, are two main problems of driver assistance systems, which have not been addressed to a sufficient extent so far. In this work we want to show that this problem can be tackled using contemporary mapping approaches and in-car systems with only moderate complexity. Further, the lighting of hazardous areas by the vehicles can help reduce the number of fatal accidents.
This paper is organized as follows: After presenting related work in chapter 2, we describe how we obtain and use our map in chapter 3. Our prototype communication and lighting system is presented in section 4, with an evaluation in section 5. Section 6 gives a summary and outlook.
2.
Related work
This section discusses the weaknesses of today’s advanced driving assistance systems and motivates the use of maps to improve them.
First and foremost, there are the emergency braking systems (EBS) which facilitate the simultaneous use of traf-fic areas for different road users. For our approach
we concentrate on the benefits of these systems for the close collaboration between automobiles and pedestrians. The majority of car manufacturers provide some kind of EBS under different names, although the systems don’t differ much. They recognize a potential crash in advance through different distance sensors, warn the driver, preload the brakes, tighten the seatbelt and/or perform an emergency braking.
Currently, camera systems perform best in avoiding crashes with pedestrians in urban scenarios. A NCAP (2016) laboratory test shows that the EBS performs only at a speed between 0-60km/h, regardless of the manufacturer and sensor that is being used or with less accuracy if the other road user is moving. The disenchanting result of only 10% accident avoidance shows how far away we are from a close collaboration of road users in traffic areas. In the last year the idea of closer collaboration was getting famous. Instead of using head up displays to simply inform the driver (Thonnes et al. 2005) (Phan et al. 2016), displays could be used to inform pedestrians. In contrast to use secondary devices, such as smart phones, for the communication (Sugimoto et al. 2008), displays represent a more generally intelligible communication system (Urmson et al. 2015). Displays couldn’t be read from a far distance in case of a fast approaching vehicle, though. Thus, speed adaptation is a step further towards collaboration.
We have seen that the performance of EBS as well as display communication systems depends on the speed of the vehicle or that of the accident opponent. Intelligent speed adaption (ISA) can help to maintain a reasonable ve-hicle speed while driving. These systems are supposed to select the required speed according to the current traffic situation and help drivers to stick to the required speed limits. The ISA deals with the problem of traffic sign recogni-tion, which can be assisted by digital maps. In case there are comprehensive adequate speed limits, only a few vehi-cles are equipped with an ISA and are therefore able to adapt their speed automatically. Hence, there are ap-proaches to point the driver to the important and necessary information, such as speed limits so he can adapt the vehicle’s speed accordingly.
Night view assist (NVA) systems are intended to support the driver in twilight or darkness. There are different functionalities associated with NVA. They may control the high beam, and/or actively illuminate areas in the sur-rounding. This section does not consider the adaptive high beam following the street and preventing glare (Audi 2013, Daimler 2015), but rather focuses on the illumination of pedestrians, animals and traffic signs (BMW 2014).
Tsz-Ho Yu et al. (2009) developed a system which illuminates traffic signs and helps the driver to notice them. They mounted a spot light onto the roof of a car. The system recognizes traffic signs by their shape through infrared cameras and gives the driver the opportunity to mark them for illumination. Then, the spot light aims at the target sign automatically and follows it as long as it is in the field of view. Thus, Tsz-Ho Yu et al. 0%
5% 10% 15% 20% 25% 30%
1996 1997 1998 1999 2000 2001
Inj
ur
y
sev
eri
ty
Year
(2009) showed a possible way to reduce the overlooking of essential information. The commercial NVA from different car manufacturers (BMW 2014) are using infrared cameras to recognize humans or animals in close proximity to the road and illuminate these potential accident opponents with the car’s headlights, depending on their distance. Audi introduced a purely reactive communication approach via projection (Audi 2015). This approach is suffering from deficiencies of conventional driving assistant systems, namely being based on static maps.
Ali Ufuk et al. (2014) present an improvement of traffic sign awareness with the help of digital maps. Starting with major cities and arteries, the maps became more and more detailed over the years. By the addition of traffic lights and turning lanes, modern digital navigation maps now provide much more static information. In the last few years the major innovation in digital maps was the switch from static to dynamic maps. At the moment, maps include only real time traffic data derived from the velocity profiles of smartphones or in-car GPS units. These data is currently used for finding the fastest route only, but it’s quite easy to imagine their use for detecting speed limits as well. Though helpful, the real time data have merely been used as reactions to occurring traffic situations and have only been exploited conservatively for prediction of future traffic scenarios. For smarter traffic on the way to close collaboration, the prediction of traffic scenarios is desirable.
Our approach differs from the purely reactive approach because it anticipates the situation and necessary reaction based on a dynamic self-updating map.
Prior to the detection, the system estimates the situation parameters for stopping the vehicle and projection de-pending on its position on the map. At some locations it is more likely for a pedestrian to cross the street even if he or she is still far away from the curb. Thus, not only the parameters of driving assistant systems, but also the recommended speed can be adjusted due to the integration of map-based information. Although we concentrate on the dynamic map approach, we do not neglect the reactive solution at all. Our solution utilizes a dynamic map for the illumination of hazard spots and a fall-back to reaction-based communication. The system will anticipate the required communication and will perform the action only when it is needed. For example, the projection of a cross-walk is only helpful if a pedestrian is detected.
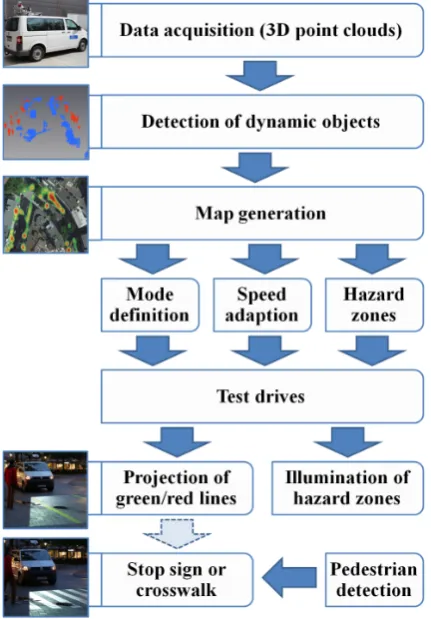
A global pipeline of the process is shown in fig. 2. Further information on the maps and their generation can be found in the next section along with the solutions to the problems that come with such a dynamic map.
3.
Dynamic Map Communication via light
projection
When future cars drive through cities, their sensors will permanently record the environment. By using multi-temporal analysis they can use this data to determine dynamic characteristics of the city, like:
• Where are areas with lots of changes?
• Where do bicyclists or pedestrians cross frequently?
• Where do unusual vehicle dynamics occur? All these characteristics suggest an increased risk of getting involved in an accident where an automated car should slow down on its own. We call this representation of an environment’s dynamics the dynamic map.
All the following steps are realized based on the dynamic map. First, we use it to improve the communication of a car with its environment, realized by visual signals. For example, the skin of the entire car could be a large display or especially at night, the car could project information onto surrounding surfaces, e.g. stop signs or bicycle path crossings in order to inform the driver and pedestrians about the system's thoughts and intentions. If the car marks an area visually, which is known for frequent pedestrian crossings, this has several implications. Firstly, the driver knows this is a possibly hazardous area. Secondly, the driver (and other traffic participants) understands why the vehicle is slowing down. Finally, the type of visual mark will tell the pedestrians the car’s intention, whether it is willing to slow down or not.
Fig. 2: Pipeline of the process. The single steps are described in chaper 3.
it would also help pedestriacns and cyclists to feel safer and in general to prevent accidents.
The dynamic map is also used to adjust the speed limits to the number of expected pedestrians and cyclists. In case of crowded area with many pedestrians in the city center, the maximum speed has to decreased. In areas where almost no pedestrians and cyclists are expected, the speed limit can be increased.
In the following we will show how we created the dynamic map and how we used it, to improve the communication with the pedestrians and to illuminate hazard areas, that are identified using this map.
3.1 Generation of the dynamic map
We want to create a map that describes the dynamic characteristics of a city. In our case, it is represented by a grid with a cell length of one meter for both axes. Every cell stores a value indicating the likelihood for the appearance of dynamic objects, namely pedestrians and cyclists, in this area.
In this work, we build an initial dynamic map in a preprocessing step using data acquired by a Riegl VMX-250 Mobile Mapping System. The detection of dynamic objects is described in detail in Schlichting and Brenner (2016). It consists of two steps. At first, we segment any free-standing objects from the point cloud, like pedestrians, cars, trees and also buildings using a region growing algorithm, presented in Adams and Bischof (1994). Secondly, the segmented objects are classified. As we are only interested in pedestrians and cyclists, we can restrict the classification to two classes: pedestrians or cyclists and other objects. The classification step of the remaining objects is done by a random forests implementation of the OpenCV (2016) library. We achieved a recall of 78.6 % and a precision of 95.0 %. After the classification step the map’s cells get updated for every detected pedestrian or cyclist. Fig. 3 shows a crop of the resulting map in the city center of Hannover.
Fig. 3. Dynamic map, colored by cell values from green to red [Google, 2015].
The described map creation is done in a preprocessing step. To ensure a high reliability and accuracy of the map, the dynamics need to be updated. As we expect future
cars to be equipped with laser scanners and/ or stereo cameras, they are hence capable of detecting pedestrians and cyclists. In case of (automotive) laser scanners a modified or even the same algorithm as in the map initialization step can be used. If a stereo camera system is installed in the vehicle, it can be used to detect pedestrians online and determine their position. In the next step the map can be updated by the currently detected dynamic objects, weighted by the localization accuracy of the vehicle. Although the accuracy of the online detected objects may be comparatively small, a large fleet of vehicels will lead to many detected objects and a therefore an increased accuracy and reliability.
3.2 Communication using light projection
We have shown how to build and update a map of dynamic objects in cities. In a further step, this map is used to improve the car-to-pedestrian communication to adapt the driving speed of the vehicle and warn the driver and pedestrian if necessary. This improvement of the cooperation between cars and other road users is essential for future driving situations, were the driving lanes and the pedestrian zones grow closer together or even overlap.
To guarantee that the visual signals and the illumination of hazard zones are aligned correctly, a real-time vehicle localization is indispensable. In case of self-driving cars, the vehicle’s position and orientation is already known with a high accuracy at every point in time, typically provided by a GNSS/INS solution combined with laser scanners, cameras and/or radar sensors. For communication and illumination purposes, we do not need an accuracy of a few centimeters. In this case, decimeter localization accuracy is sufficient, which can be provided by a GNSS sensor with Real Time Kinematic (RTK) satellite navigation and an inertial sensor.
In addition to the dynamic map, vehicles have to detect moving objects online to initiate a communication event and/or to avoid accidents. For the live detection of pedestrians we used a stereo camera and the object detection algorithm of OpenCV (2016) library facilitated by a GPU, using CUDA for fast bounding box calculation. An exemplary image with a detected pedestrian can be seen in fig. 4.
de-termine the position of the detected objects, it is necessary to rectify the camera raw data. We use the distance and size of the detection to filter incorrect detection. The rectification step and the prior camera calibration are done us-ing again the OpenCV (2016) library. Once we find dynamic objects in the image, we calculate the 3D position of the objects. The system can then decide whether it wants to stop and let the pedestrian or cyclist pass or to advise the other traffic participant to stop by projecting an appropriate visual signal.
We propose to perform the vehicle-to-pedestrian communication by projecting information onto the road to avoid the display-speed problematic mentioned before. Before the communication via light signals can take place, the map is used to classify the current situation and to prepare for an adequate projection. At this point it is also possible to extract the map update information. Finally, the system will project an adequate pattern and/or illuminate an area using the spotlight.
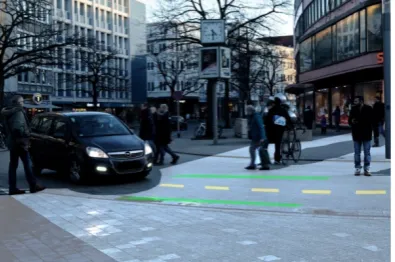
The road projection is outlined in fig. 5. The dotted yellow line shows the predicted trajectory of the vehicle. We want to categorize the vehicle’s driving behavior into two modes: A road-sharing mode, which means that in this scenario all traffic participants, like cars, pedestrians and cyclists, share the same road and in contrast a vehicle-only mode. The suitable mode can be derived from the dynamic map. In an area with frequently crossing pedestrians and cyclists, the road can be marked as a shared road. If the road-sharing mode is activated, the vehicle has to behave extra cautious and considerate with a correspondingly adapted driving speed. The green lines in fig. 5 tell the pedestrians that the car is willing to stop if they want to cross the road. In addition, if a pedestrian is detected by the camera, a crosswalk will be projected onto the road by the video projector. The second possibility is a vehicle-only mode. Here, cars are privileged compared to pedestrians. The green lines turn red to inform the pedestrians that they have to wait until the car has passed. If the camera detects any pedestrians or cyclists the system will project a stop sign in addition. Of course, if the pedestrian/cyclist is still willing to cross, the vehicle will stop to prevent an accident.
Fig. 5. The information of the planned vehicle’s behav-iour is projected on the road to improve the vehicle-to-pedestrian communication.
In addition to the direct car-to-pedestrian communication via visual signals, hazardous areas are illuminated. If the car illuminates an area, which is known for frequent
pedestrian crossings, this has several implications. Firstly, the driver knows this is a possibly hazardous area. Secondly, the driver (and other traffic participants) understands why the vehicle is slowing down. Thirdly, it will help the pedestrians and cyclists to recognize the vehicle. The car re-ceives the local coordinates in the sensor coordinate frame in the following way: The dynamic map is transformed to the sensor coordinate frame, using the position and heading from the current vehicle state. In a fixed range in front of the car, the algorithm searches for the most hazardous grid cell in the map. If a hazardous area is found, it will be illuminated by the spotlight. Of course, it has to be guaranteed that other vehicles will not get illuminated by the system. This problem is already solved by car detection methods already existent in several driver assistance systems like intelligent light systems.
The prototype of the localization, communication and illumination of hazardous areas is presented in the next section.
Fig. 6. Prototype platform with a GNSS, a IMU/GPS, stereo camera, LED/Laser projector and pan/ tilt spot-light.
3.3 Lighting and communication prototype
We equipped our platform with a video projector, a spot light, a stereo camera, an inertial measurement unit, and a low cost and a high end GPS (fig. 6). For the exact determination of the position and orientation of each sensor and its projections, we calibrated the system using a Leica Laser Tracker System AT960 and a Leica T-Probe. Combined with a T-Probe, the laser tracker is able to measure 3D points with an accuracy of 0.11mm at a distance of 10m (Leica AT960 2015).
As vision sensor, we used a VRMagic VRMD3MFC stereo camera system with two cameras mounted onto an aluminum brace in a fixed distance of 83cm.
The camera calibration parameters have been determined by the use of images of a chessboard calibration pat-tern in each corner of the field of view. This vision system is used for reacting, updating and an improvement of the localization.
integrated, low cost GPS reaches an accuracy of a few meters and is used in the internal XSens Kalman Filter to correct the IMU velocity data. In addition a more accurate Leica RX 1250+ GNSS system was used. The receiver yields an accuracy of less than 10cm in real time by using both L1 and L2 carrier-phases and correction data which in this case is provided by the Satellite Positioning Service AXIO-NET.
The main communication between the vehicle system and pedestrians and/or cyclists is realized via a Casio XJ-H 1700 LED/Laser Projector. The use of a LED/Laser technology based projector reduces the vulnerability to vibrations coming from the car and at the same time ensures a good light performance. It provides a luminous flux of 4000ANSI lumen with a power consumption of 330W.
The night view assist and hazard spot illumination function is realized by a STAIRVILLE MH-X20 Micro LED Spot moving head. The LED-Spot has two flexible axes and can be tilted about 270° and rotated about 540°. The spot weighs 4.2 kg, has a radial angle of 13° and a power consumption of 40W and provides 9.800 Lux at a distance of one meter. It can be controlled via a DMX channel.
Fig. 7. Illumination of a hazardous area by the LED spotlight.
4.
Evaluation
For the evaluation of our dynamic map and our prototype, we used a test area in the inner city of Hannover (fig. 3) to find out if pedestrians react adequately to the projection. This street is located next to a pedestrian zone and shows several hazardous areas where a lot of dynamic objects, pedestrians and cyclists, occur. We drove during dawn because of more clearly light projections and because the driver is not visible inside the dark vehicle. Insiders, who know the projection’s meaning, as well as unaware pedestrians, showed the expected behavior towards our projections. The projection comes along with typical stops and passes. Nevertheless, this result shows that the projection of common traffic signs is not confusing the pedestrians. During our tests, we drove along our mapped area at dusk and at night.
Considering the spotlight functionality, hazardous areas were illuminated (fig. 7). The prototype is mounted onto the roof of a van for practical reasons. However, the disadvantage of a high mounting position is the possibility that other traffic participants get blinded by
the spot light. For future systems we recommend a lower installation height.
Apart from the illumination of hazardous areas, the dynamic map can be used to define areas where pedestrians, cyclists and vehicles share the same road and our proposed lighting system behaves in a different way than in a vehicle-only mode. In our test drive we applied both modes. An example scene of the road-sharing mode is shown in fig. 8.
Fig. 8. Road-sharing mode with green lines telling the pedestrians that they may cross the road.
If a pedestrian is detected by the camera system (fig. 4), the video projector shows a crosswalk, as seen in fig. 9.
Fig. 9. A crosswalk is projected if pedestrians or cylcists are detected by the camera system.
Fig. 10. Red lines in the vehicle-only mode tell the pedestrians and cyclists that the car is not willing to stop.
be to use the an-gular rate of the inertial sensor or the steering wheel position angle and rate of turn.
The vehicle-only mode is shown in fig. 10. During the test drive, pedestrians and cyclists hesitated if they saw the red lines and carefully continued to cross at green lines as expected. The stop sign oriented towards the detected pedestrians and cyclist ensured that they stopped, see fig. 11.
Fig. 11. A projected stop sign tells the pedestrians or cylcists explicitly to stop
In further developments, a second stop sign could be added if pedestrians or cyclists were to cross the road from both sides.
A further communication element in our prototype is the bars in the middle of the projection, visible on the right side of fig. 10. The movement speed of the bar depends on the vehicle velocity. The motivation here is to help the pedestrians to estimate whether the vehicle slows down, keeps a constant velocity, or accelerates.
5.
Summary and Outlook
We have developed a system which is able to communicate with pedestrians and cyclists and illuminates danger spots derived from a hazard map. Furthermore, we made an implementation which shows how such a hazard map can be generated automatically from sensor data.
The map generation is so far based on point clouds which are currently captured with an expensive and highly accurate mobile mapping system. For the future, we envision that this data is collected using a crowd based approach, e.g. using mono/stereo cameras which anyhow will be built into most vehicles.
Furthermore, in future research it has to be analyzed, how the driving modes (vehicle-only and road-sharing mode) can be derived by the dynamic map fully automatically. Regions where many pedestrians occur have to be clustered in sectors with a suitable minimal length, so that the driving mode does not change in a high frequency. Al-so the automatic adjustment of the vehicle speed using the map has to be analyzed more precisely.
We handled the accuracy problem of the localization by using an expensive precise GNSS receiver coupled with an inertial measurement unit and visual odometry. However, precise localization in built-up areas (under GNSS outages) is an important problem, and this certainly requires additional work. For example, a highly
precise relative localization, e.g. using landmarks, should be considered.
We demonstrated the benefit of the combination of a hazard map and a communication system to influence other traffic participants’ behavior. During our test drives in the city of Hannover, there were several occasions where random pedestrians took notice of the system and made very enthusiastic comments, some requesting us to stop in order to “test walk” the projected zebra crossing. In production vehicles the projection system has to be integrated into the vehicle, presumably into the headlights. Projecting onto the ground will not be visible under bright daylight conditions. We made some investigations into using laser beams deflected by mirrors; however, the laser power required for daytime visibility would be so high that such a system would not be eye safe. Since many accidents occur in the dark, the system would still be of value. Furthermore, other communication possibilities could be considered, such as using the car’s surface as a screen to present information, where most of our approach, including the dynamic map, is still applicable. Overall, system costs have to be reduced considerably, however, with a closer integration into the car’s infrastructure, the sensor da-ta streams already available in the car can be used, which will reduce costs substantially. Finally, apart from the “in-car” problem, the server side implementation is a completely different problem. We think that, due to the nature of the data, “big data” parallel processing schemes such as MapReduce will be suitable to compute updates of the dynamic map at regular intervals. Similar approaches are currently under way with regard to the real-time mapping of empty parking spaces, and it can be expected that such an infrastructure can be used, with only little adaption, for our dynamic hazard map. Furthermore, the behavior of other traffic participants like pedestrians should be mapped in more detail, as shown in our previous work (Busch et al. 2016) to allow for closer collaboration. Thus, communication via light projection shows the benefits of the research in dynamic maps based on frequently updates gained through cooperation from several data sources.
6.
Acknowledgements
We thank our students Jonas Hahlbohm, Jens Hübner, Philipp Knake, Torben Peters, Mareike Ploog, Tobias Schaub and Benjamin Tennstedt for their commitment during our student project “dynamic hazard alert”.
7.
References
Adams, R. and Bischof, L. (1994). Seeded Region Growing. IEEE Transaction on pattern analysis and machine intelligence. Vol. 16, No.6; June 1994.
Audi AG (2013). Audi A8 in a new radiant light. Online: http://www.audi.com.hk/hk/brand/en/vorsprung_durch_ technik/content/2013/10/audi-a8-in-a-new-radiant-light.html; accessed 25.10.2016.
Audi AG (2015). Audi- Speed of Light. online: https://www.youtube.com/watch?v=FcCSN859xR8; 28.07.2015, accessed 25.10.2016
BMW AG (2014). EVERYTHING IN VIEW. Intelligent Vision. Online:
http://www.bmw.com/com/en/insights/technology/connec teddrive/2013/driver_assistance/intelligent_vision.html; accessed 25.10.2016.
Busch, S., Schindler, T., Klinger, T., Brenner, C. (2016). Analysis of spatio-temporal traffic patterns based on pedestrian trajecto-ries. 23rd International Archives of the Photogrammetry, Remote Sensing and Spatial Information Sciences Congress. ISPRS 2016. 12–19 July 2016, Prague, Czech Republic.
Daimler AG (2015). Adaptive Highbeam Assist – the
Intelligent Headlamp. Online:
http://techcenter.mercedes-benz.com/en/adaptive_high_beam_assist/detail.html; accessed 25.10.2016.
Hexagon Metrology Inc. (2015). Leica Absolute Tracker AT960 Product Brochure. July 2015.
NCAP (2016). Autonomous Emergency Braking. Online:
http://www.euroncap.com/en/vehicle-safety/the-rewards-explained/autonomous- emergency-braking; accessed 25.10.2016.
Bradski, G. (2000). Dr. Dobb’s Journal of Software Tools. OpenCV Library. online: http://opencv.org/; accessed 25.10.2016.
Phan, T. P., Thouvening, I., Frémont, V. (2016). Enhancing the driver awareness of pedestrian using augmented reality cues. IEEE 19th International Conference on Intelligent Transportation Systems (ITSC). Rio de Janeiro.
Plainis, S., Murrary , I. J. , Pallikaris, I. G. (2006). Road traffic casualties: understanding the night-time death toll. Injury Preven-tion. 12:125–128. doi: 10.1136/ip.2005.01105.
Schlichting, A. and Brenner, C. (2016). Generating a hazard map of dynamic objects using LiDAR Mobile Mapping. Accepted: Photogrammetric Engineering and Remote Sensing, Special Issue on Mobile Mapping. December 2016.
Sugimoto, C., Nakamura Y., Hashimoto, T. (2008). Pedestrian-to-vehicle communication system for improving road safety using cellular phones. Networked Sensing Systems. INSS 2008.
Tonnis M., Sandor C., Klinker G., Lange C., Bubb H. (2005). Experimental evaluation of an augmented reality visualization for di-recting a car driver's attention. Fourth IEEE and ACM International Symposium on Mixed and Augmented Reality (ISMAR'05).
Yu, T. H., Moon, Y. S., Chen, J., Fung, H. K., Ko, H. F., & Wang, R. (2009, May). An Intelligent Night Vision System for Auto-mobiles. 2009 IARP Conference on Machine Vision Application. May 20-22, 2009, Yokohama, Japan
Urmson, C. P., Mahon, I. J., Dolgov, D. A., & Zhu, J. (2015). U.S. Patent No. 8,954,252. Washington, DC: U.S. Patent and Trademark Office.
![Fig. 3. Dynamic map, colored by cell values from green to red [Google, 2015].](https://thumb-us.123doks.com/thumbv2/123dok_us/9934743.1980971/4.595.307.505.582.709/fig-dynamic-map-colored-cell-values-green-google.webp)