Vol.9 (2019) No. 1
ISSN: 2088-5334
Visual Analytics: Design Study for Exploratory Analytics on Peer
Profiles, Activity and Learning Performance for MOOC Forum
Activity Assessment
Mohammad Fadhli Asli
#, Muzaffar Hamzah
#, Ag Asri Ag Ibrahim
#, Alter Jimat Embug
# #Faculty of Computing and Informatics, Universiti Malaysia Sabah, Labuan International Campus, Labuan, 87000, Malaysia E-mail: [email protected]
Abstract— The massively open online course (MOOC) has become an increasingly popular alternative platform for education due to
its open concept and free features. Due to its features that allow enrolment on a massive scale and participation across the globe, it presented new analytic challenges. The vast amount and variety of data generated pose challenges for the learning analytics community to analyse especially concerning peer presence and peer learning. Forum activity data offers the opportunity to assess the relationship between forum activities and user backgrounds with the learner’s progression and retention rate. Furthermore, there are several challenges in implementing data visualization in real-world scenarios such as different task characterisation compared to the existing analytics, along with varied factors on the usability of visualization among the domain analysts. Despite many research on learning analytics, most of the approaches were data-driven and there were only a handful of studies that were focused on interactive visualization design to facilitate MOOC forum user activity assessment using real-world scenarios and educational theories-driven. Our design study aims to investigate and formulate a visual analytic design to facilitate enriched visual analysis towards assessing forum activity in Malaysian MOOC, particularly in pattern and relationship exploration on the user diverse background and activities with the learning performance. This paper presents our review on visual learning analytics and current MOOC practice in Malaysia, our design study methodology and proposed conceptual visual analytics design on visualizing forum activity data.
Keywords— visual analytics; information visualization; design study; learning analytics; MOOC.
I. INTRODUCTION
Massively open online course (MOOC) has become a trending education platform, emphasized the open concept and near free learning environment. MOOC particularly has a massive amount of enrolment involving participation from global users, and it offers flexibility on learning schedules. Despite the advantages, educational theory deemed that the lack of peer presences affected the cognitive learning in the MOOC virtual environment. Being compared to the classroom settings, now the MOOC learning environment has turned virtual and open towards users with diverse backgrounds. Each learns within personal pace, then required completing the quiz, practical exercise and peer-reviewed project. In general, learning activities in MOOC can be classified into two categories: receiving information (e.g., video lectures), and peers or instructors interaction (e.g., forum discussion) [1].
In contrast with E-Learning, the peers in MOOCs is rarely acquainted, and the learning is voluntarily based and self-regulated[2]-[4]. Peer roles in cognitive learning are mostly visible through forum discussion and peer reviews.
Up to date, only a handful of research within the forum activity learning analytics that include user profiles and backgrounds within the analytical process [5]. Analyzing the educational data can be a daunting task due to its large volumes and variety. The automated model analysis may provide statistical calculation, but what if the statistical outcomes, especially for MOOC tend to be overwhelming to assess even by the domain analyst? Using visual analytic approach, interactive visualization can enhance the analytical process by facilitating visual representation for better cognitive process and interaction. However, there were few studies on a stable and dedicated interactive visualization design for MOOC educational data that particularly to highlight the pattern and relationship on the effect of peers activity and diverse profiles towards encouraging learning in MOOC environment.
comprehensive data exploration and offers enriched insights on the pattern and relationship analysis towards the forum activity data.
II. MATERIAL AND METHOD
In this section, we provide an overview of related work and our methodology. In order to characterize the entire issues and factors, it is necessary to know the fundamentals and existing techniques for presenting forum activity data and the current state of MOOC implementation in an area.
A. Research Background
Big data is defined as the existence or emergence of datasets of such magnitude that was beyond usage for conventional databases. The characteristics that qualify the data as big data were volume, variety, velocity, variability, and veracity [5]. Massive scales of data alone have presented challenges from aspect such as computational power and comprehensive human analysis to be properly utilized. These challenges also exist within the field of education. With the implementation of technology, E-Learning has provided a convenient course platform for educational content delivery and assessment. Afterward, MOOCs then introduced with the pedagogical open and free concept, allowing massive participation and access to educational content. There are differences between E-Learning and MOOCs as shown in Table 1. However, the introduction of MOOCs then presented new challenges especially concerning peer presence and peer learning.
TABLEI
DIFFERENCES BETWEEN MOOC AND E-LEARNING COURSE
MOOC Factors E-Learning Course
A technological design that facilitates the dissemination of the activity of participants through one or more platforms
Purpose
Use an e-learning platform (LMS) with a set number of functions and structure designed for interaction with lecturers
Open environment Learning
environment Close environment
Free access Accessibility Access on payment of the registration fee
Massive participation Participatory The limited or targeted group
Support of the community
and the instructors Support
Majority support of the teaching staff Emphasis on the learning
process rather than evaluation and accreditation
Orientation Evaluation and accreditation oriented
Depends on the platform, periodical sessions are open automatically
Enrolment
Offered at very specific moments of the academic year
In contrast with E-Learning, the learner peers in MOOCs were not closely acquainted, and the learning is voluntarily based. Forum discussion is one of the main features and activities within MOOC structure apart from content delivery, assessment and evaluation. The forum discussion activities described as viewing, voting and commenting [1]. Johnson [6] has explained in a general perspective on the challenges of the virtual learning environment, which is relatable to the MOOC current environment as listed below.
• Diminished Attention Spans
Many users tend to multitask when using a computer. Less attentive focus towards the content may lead to skimming articles or letting the video run in the background.
• Content Progression Disarray
Within the virtual learning environment, learner progress within personal pace and might feel lost when the instructor could not be referred to in real time.
• Discomfort with Technology
Although the use of technology can be considered norms in general nowadays, there are still some users that are still unfamiliar with the virtual learning environment.
• Limitations
A virtual learning environment might unable to teach learner on developing or using a complicated piece of machinery. Lack of peer presence also may limit the space for team-building and role-playing activities, brainstorming, or discussion other than forum discussion and brief peer review.
In the context of MOOC, data frequently collected from the community usage and interaction, accumulating enormous volume and variety of complex data that can be tapped using visual analytics methods to explore new knowledge and gaining insights[7], [8]. Forum activity data offers the opportunity to assess the relationship between forum activities and user backgrounds with the learner’s progression and retention, a feature that is highly sought by MOOC analyst as suggested by a study [9]. However, each level of users poses unique challenges of analysis for the domain analyst as shown in Table 2.
TABLEII
ANALYSIS QUERY FROM THE PERSPECTIVE OF DOMAIN ANALYST IN MOOC
Who Instructor Peer Learner
What Identifying clouded understanding from content delivery Identifying activity behavior and background Content support
When Content delivery Social participation Peer Learning Where Forum discussion
Why To improve content delivery To encourage specific forum activities To provide alternative crowdsource references
Assessments of content delivery are crucial for the instructors to ensure the level of learner’s progression and reducing retention. Clouded understanding—inaccuracy of student’s understanding of delivered content as highlighted by a study [10], poses risk contribution towards learner’s retention. Few questions that may be asked by domain analyst during the data analysis may highlight this issue such as:
“Why there are high numbers of forum comments that classified as ‘clarification’ within the threads on this subject?”
Lack of peer presence and group environment [6] present challenges for peer learning and social interaction. A recent study [11] have highlighted on leveraging crowdsource capabilities of MOOCs to support content reference and assisting problem-solving in projects or assessment. Domain analyst may be interested in questions such as:
“What are the most frequent forum activities for this course?”
“What are the percentages of active forum participant and their relationship with the average learning performance for this course?”
“What type of post that most participant frequently posted and how long does it take to be considered a solution?”
These questions sought out information on processed data, but how to comprehend a large scale of the data model to start making sense of it? A visual analytic approach can augment the cognitive processing on these data model using visual representation. Visual analytics can be described as “the science of analytical reasoning facilitated by interactive visual interfaces” [12]. It consists of processes from data preparation, automated data analysis and visual data exploration as shown in Fig. 1 below.
Fig. 1 Visual analytics process [13]
In visual analytics context, design—interpreted as both (1) an assessment and development of methods or approach and (2) technological construct or model outcome; by integrating the components of data management, automated model analysis, interactive visualization design, and human analytical reasoning.
During the early foundation of visual analytics, [14] argued on the value of visualization. He stated, “visualization is not ‘good’ by definition,” that it is crucial for the researchers to make clear why the information sought cannot be extracted automatically when developing the new method. Visual analytics is more than the only visualization. It can rather be seen as an integrated approach combining visualization, human factors, and data analysis [15]. In the interest of visual analytics agenda [16], there are still many opportunities for using visual analytics in various domains and context. The facets of visual analytics consist of essential features; interactive visualization; automated data analysis; and human factors [17].
Although currently there was an abundance of visualization tools and system applied in various domains,
analytical accessibility features were mostly sought out for enriched insight’s gain capacity. Many examples of visual analytics tools are available such as Leadline (interactive VA of text data) [18], Progressive (steerable progressive VA) [19], and Peekquence (VA for event sequence data) [20] that were designed to support visual data exploration. However, there are several challenges in implementing visualization on real-world scenarios.
Due to the volume of the data, machine learning (ML) technique (e.g., mapping, multidimensional scaling, clustering) [21] along with topical modeling techniques (e.g., latent semantic analysis, latent Dirichlet analysis) has been utilized. A recent review [22] has briefly summarised the categories of ML based on analytical tasks defined as (1) dimension reduction; (2) clustering; (3) classification and; (4) regression/correlation. Despite the abundance of data-driven approaches, feasibility and usability for real-world scenarios should be taken into consideration, thus the problem-driven approach. Visual analytics may have been used widely in other domain and area, but in our case, there are the challenges of making it feasible to be used in Malaysia. The first MOOC in Malaysia was launched on 2013 [23] and has developed from that point. However, the recent development is described as exploratory and focused on learning the technology to complement current higher education level delivery systems [24]. The task characterization on analytical activity may differ from conventional or established analytics, along with varied factors on the usability of visualization among the domain analysts.
A study [25] has categorized the types of posting and comments in forum discussion generally defined as a clarification, assurance, problem-solving, identification and others. This study argues that these categorizations be referred to develop the evaluation metrics for forum discussion activities and relate it to user profiles and learning performance.
A study example incorporates topical modeling and machine learning along with implementing topic labeling to produce new topics from MOOC data [7]. Another example also has presented post classification method in web discussion forum using the supervised and unsupervised approach that was based on sequence model (specifically, hidden Markov Models) [26]. However, it is not clear explanatory, or correlative models were the desired outcome, thus the need for “model visualization” rather than “data visualization” as stated by Johnston [27]. Visualization techniques such as line graph, bar chart, tree-mapping, bubble-plot [28], [29] are essential for both mapped data representation and model representation after the automated data analysis. Although with the automated data analysis, the models presented were processed separately. As stated by Bertin [30], “In decision-making the useful information is drawn from the overall relationships of the entire set.” The visual analytic approach is intended to empower domain analyst by augmenting cognitive capabilities when handling the analytic process towards the overall processed dataset to produce informed and reasonable decisions.
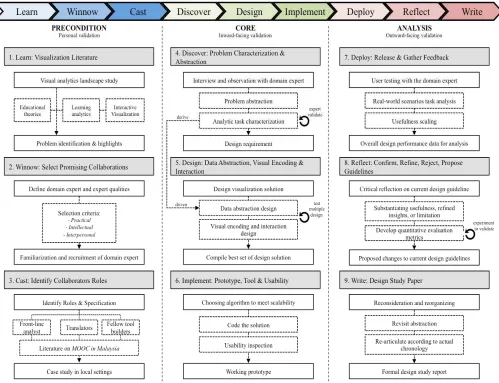
Fig. 2: Strategy for our design study
B. Research methodology
The research used the design study methodology to adequately characterize a problem domain and task analysis of the target user [31]. This study utilizes both qualitative and quantitative method. Our strategy for the design study is as elaborated below and shown in Fig. 2.
A. Phase 1: Precondition
For the first phase, the activities within were focused on preparing the research for the related work, recruiting and filtering synergistic collaborations with domain experts.
1) Activity 1. Learn: Visualization Literature: During the
earlier phase, the general overview of visual analytics landscape was studied that includes the fundamentals of visual analytics, review of learning analytics and educational theories, then complimented with the review of interactive visualization techniques utilized in related visual analytics tools.
2) Activity 2. Winnow: Select Promising Collaborations:
In this phase, proper definition and characterization of domain expert will be defined for selecting promising
collaborators. This design study took consideration of the scenario of MOOC in Malaysia, where the domain experts will be selected from public and private universities alongside education research institutes. The selected expert candidates then will be recruited and given familiarisation activities towards visual learning analytics for MOOC.
3) Activity 3.Cast: Identify Collaborators Roles: In this
stage, an interview session will be conducted with the experts. From the interview results, roles and specification of interested domain experts will be identified. In the case of Malaysia, this study is rather among the earliest attempt to date on properly identifying collaborators role for visual analytics design study. The role of front-line analyst, translator, and fellow-tool builder will be distinguished based on the domain expert level of interests and domain background [31].
B. Phase 2: Core
1) Activity 4. Discover Problem Characterisation and Abstraction: In this stage, target domain practices, problems,
and requirement will be explored for problem characterization and abstraction. Based on the interview results, the preliminary design rationale of our visual analytics design will be refined. The current task analysis and design goals are:
To facilitate temporal and multidimensional visualization of forum activity, user profiles, and learning performance.
To formulate the evaluation metrics for quantitative analysis for pattern and relationship exploration within the forum activity data.
To provide dedicated interactive visualization effective for exploring patterns and relationship within the forum activity data.
The analytic task characterization will be validated by the domain experts and derive the data abstraction design in the next stage.
2) Activity 5. Design: Data Abstraction, Visual
Encoding, and Interaction: In this phase, the visualization
solution will be designed that includes components of task-driven data abstraction, visual encoding, and interaction design. The philosophy of the visual information-seeking mantra “Analyse first, show the important, zoom, filter and analyze further, details-on-demand” [12] were adopted for the visual analytics tool design. Each component design will be tested with the domain expert based on design requirement and rationale, then the best set of design solution will be selected for tool development.
3) Activity 6. Implement Prototype, Tool, and
Usability: The prototype will be developed using soft
systems methodology [32]. There will be seven (7) stages within the development phase and partially parallel with the design study methodology:
• Enter situation considered problematical
The entire precondition phase as mentioned above will cover this.
• Express the problem situation
Visualization literature and interview results will outline the problem situation and requirement analysis.
• Formulate root definitions of relevant systems of purposeful activity:
This will be formulated during the process of problem characterization and abstraction.
• Build conceptual models of the systems named in the root definitions
The preliminary theoretical model will guide the development design.
• Compare models with real-world situations
The prototype then will be tested using real-world analysis scenarios for the domain expert.
• Define possible changes which are both possible and feasible
Testing results will be reflected upon the current proposed visual analytics design.
• Take action to improve the problem situation
Propose changes or novel features onto current guidelines.
C. Phase 3: Analysis
For the final phase, the domain experts will test the overall design by using the tool to accomplish real-world scenario analysis task. The results from the previous stage will be used to conduct a critical reflection on the current design guideline.
1) Activity 7. Deploy: Release and Gather Feedback In
this stage, a case study will be conducted where domain expert user will test the prototype to accomplish real-world scenario analysis task. The performance of the designed prototype will be observed, and a comprehensive usability survey will be conducted with the domain expert. Our proposed visual analytics design will be evaluated in accordance with the philosophy of visual analytics: the design capabilities to facilitate or enable the domain analyst to perform exploratory analytics for MOOC forum activity data.
2) Activity 8. Reflect: Confirm, Refine, Reject, Propose Guideline: The results from the previous stage will be
analyzed and reflected upon the proposed design. A set of evaluation metrics for the visual quantitative analysis will also be formulated and included in the proposed final design. The final design will be reflected in the current design guidelines by substantiating usefulness, insights, and limitation of the proposed visual analytics design.
3) Activity 9. Write Design Study Paper: In the final
stage, the study will reconsider and reorganizing the whole design by revisiting the abstraction and re-articulate according to the chronology of conducting the design study. Findings, limitation and future work will be presented in a formal design study report for the visualization community.
III.RESULTS AND DISCUSSION
Fig. 3: Preliminary visual analytics design for visualizing MOOC forum activity data
Based on Fig. 3, the visual analytics tool flow will be enforced with the proposed visual analytics design. MOOC forum activity data such as posting, query, vote, or view will be the raw data. The raw data will undergo data abstraction [28] that involves machine learning and statistical calculation. However, this study intends to utilize a problem-driven approach to reinforce this process by adequately characterize the problem and task analysis with validation from domain experts. Proper task characterization will derive suitable data abstraction design for the domain experts to analyze.
The data model produced from the abstraction process then will undergo a visualization process. This study proposes for visualization encoding and interaction design derived from validated domain experts set of a design solution to display the information and allows interaction for the outputs for the analyst to manipulate and explore.
The insights and knowledge gained from performing the forum activity assessment based on exploring the data related to user profiles, forum activities and learning performance would then be taken into consideration to define the evaluation metrics for quantitative visual analysis properly.
IV.CONCLUSIONS
Based on our review, previous researchers have highlighted the visual learning analytics tools for assessing forum activity data. MOOC has provided both opportunity and challenges for the education community. Despite many research on learning analytics, the approaches were observed to be mostly data-driven, and few studies that aligned with educational theories. This study attempts to conduct a problem-driven approach, providing a detailed domain problem characterization and abstraction of assessing forum activity data specifically exploring patterns and relationship among the user profiles, forum activities and overall learning performance in accordance to the educational theory of the importance of peer learning presence. These components then fitted into our proposed conceptual visual analytics design.
Our proposed visual analytics design is expected to facilitate or enable the exploratory analytics based on the current MOOC analytical practice and assessment standard in Malaysia. There are potential benefits of this study. Proper characterization and abstraction then expected to produce a novel interactive visualization design to support the pattern and relationship exploration, and novel set of evaluation metrics to enrich the quantitative visual analysis of forum activity assessment.
This paper covers the early phase of our design study; the visualization literature and preliminary visual analytics design. We will next conduct detailed problem characterization and abstraction for our visualization encoding and interaction design. This study also can include forum discussion data such as topic and word relationship into the forum activity assessment.
ACKNOWLEDGMENT
We would like to thank Universiti Malaysia Sabah for their full support in laboratory facilities and technical support.
REFERENCES
[1] K. F. T. Chiu and K. F. T. Hew, “Factors influencing peer learning and performance in MOOC asynchronous online discussion forum,” Australas. J. Educ. Technol., 2017.
[2] K. M. Alraimi, H. Zo, and A. P. Ciganek, “Understanding the MOOCs continuance: The role of openness and reputation,” Comput. Educ., vol. 80, pp. 28–38, 2015.
[3] R. Kop and H. Fournier, “New dimensions to self-directed learning in an open networked learning environment,” Int. J. Self-Dir. Learn., vol. 7, no. 2, pp. 1–18, 2011.
[4] D. Yang, M. Wen, I. Howley, R. Kraut, and C. Rose, “Exploring the effect of confusion in discussion forums of massive open online courses,” in Proceedings of the Second (2015) ACM Conference on Learning@ Scale, 2015, pp. 121–130.
[5] C. Vieira, P. Parsons, and V. Byrd, “Visual learning analytics of educational data: A systematic literature review and research agenda,” Comput. Educ., 2018.
[6] S. Johnson, “Knowledge Anywhere :: The Advantages and Disadvantages of a Virtual Learning Environment,” Knowledge Anywhere, 26-Sep-2017. [Online]. Available: https://www.knowledgeanywhere.com
[7] /resources/article-detail/the-advantages-and-disadvantages-of-a-virtual-learning-environment. [Accessed: 13-Apr-2018].
[8] T. Atapattu, K. Falkner, and H. Tarmazdi, “Topic-wise Classification of MOOC Discussions: A Visual Analytics Approach.,” in EDM, 2016, pp. 276–281.
[9] C. Romero and S. Ventura, “Educational data mining: a review of state of the art,” IEEE Trans. Syst. Man Cybern. Part C Appl. Rev., vol. 40, no. 6, pp. 601–618, 2010.
[10] D. Baneres, S. Caballé, and R. Clarisó, “Towards a learning analytics support for intelligent tutoring systems on MOOC platforms,” in Complex, Intelligent, and Software Intensive Systems (CISIS), 2016 10th International Conference on, 2016, pp. 103–110.
[11] K. L. Vavra, V. Janjic-Watrich, K. Loerke, L. M. Phillips, S. P. Norris, and J. Macnab, “Visualization in science education,” Alta. Sci. Educ. J., vol. 41, no. 1, pp. 22–30, 2011.
[12] J. Prpic, J. Melton, A. Taeihagh, and T. Anderson, “MOOCs and crowdsourcing: Massive courses and massive resources,” ArXiv Prepr. ArXiv170205002, 2017.
[13] K. A. Cook and J. J. Thomas, “Illuminating the path: The research and development agenda for visual analytics,” 2005.
[14] G. Ellis and F. Mansmann, “Mastering the information age solving problems with visual analytics,” in Eurographics, 2010, vol. 2, p. 5. [15] J. J. Van Wijk, “The value of visualization,” in Visualization, 2005.
VIS 05. IEEE, 2005, pp. 79–86.
[17] J. J. Thomas and K. A. Cook, “A visual analytics agenda,” IEEE Comput. Graph. Appl., vol. 26, no. 1, pp. 10–13, 2006.
[18] D. Keim, G. Andrienko, J.-D. Fekete, C. Görg, J. Kohlhammer, and G. Melançon, “Visual Analytics: Definition, process, and challenges,” in Information Visualization, Springer, 2008, pp. 154– 175.
[19] W. Dou, X. Wang, D. Skau, W. Ribarsky, and M. X. Zhou, “Leadline: Interactive visual analysis of text data through event identification and exploration,” in Visual Analytics Science and Technology (VAST), 2012 IEEE Conference on, 2012, pp. 93–102.
[20] J.-D. Fekete, “Progressives: a toolkit for steerable progressive analytics and visualization,” in 1st Workshop on Data Systems for Interactive Analysis, 2015, p. 5.
[21] B. C. Kwon, J. Verma, and A. Perer, “Peekquence: Visual analytics for event sequence data,” in ACM SIGKDD 2016 Workshop on Interactive Data Exploration and Analytics, 2016.
[22] I. H. Witten, E. Frank, M. A. Hall, and C. J. Pal, Data Mining: Practical machine learning tools and techniques. Morgan Kaufmann, 2016.
[23] A. Endert et al., “The state of the art in integrating machine learning into visual analytics,” in Computer Graphics Forum, 2017.
[24] M. Al-Atabi, “Entrepreneurship: The First MOOC in Malaysia,” in Sixth Conference of MIT’s Learning International Networks Consortium, Boston, 2013.
[25] M. Fadzil, L. A. Latif, and T. A. M. T. M. Azzman, “MOOCs in Malaysia: A preliminary case study,” MOOCs Malays. Prelim. Case Study, 2015.
[26] J.-M. Lee, “Different types of human interaction in an online discussion: An examination of using an online discussion forum,” Proc. Assoc. Inf. Sci. Technol., vol. 43, no. 1, pp. 1–11, 2006. [27] K. Perumal and G. Hirst, “Semi-supervised and unsupervised
categorization of posts in Web discussion forums using part-of-speech information and minimal features,” in Proceedings of the 7th Workshop on Computational Approaches to Subjectivity, Sentiment, and Social Media Analysis, 2016, pp. 100–108.
[28] W. Johnston, “Model visualization,” Inf. Vis. Data Min. Knowl. Discov., pp. 223–228, 2001.
[29] B. Shneiderman, “The eyes have it: A task by data type taxonomy for information visualizations,” in Visual Languages, 1996. Proceedings., IEEE Symposium on, 1996, pp. 336–343.
[30] M. Tory and T. Moller, “Rethinking visualization: A high-level taxonomy,” in Information Visualization, 2004. INFOVIS 2004. IEEE Symposium on, 2004, pp. 151–158.
[31] J. Bertin, Graphics and graphic information processing. Walter de Gruyter, 1981.
[32] M. Sedlmair, M. Meyer, and T. Munzner, “Design study methodology: Reflections from the trenches and the stacks,” IEEE Trans. Vis. Comput. Graph., vol. 18, no. 12, pp. 2431–2440, 2012. [33] P. Checkland and J. Scholes, Soft systems methodology: a 30-year
retrospective. John Wiley Chichester, 1999.
![Fig. 1 Visual analytics process [13]](https://thumb-us.123doks.com/thumbv2/123dok_us/9982513.1986567/3.595.46.288.347.506/fig-visual-analytics-process.webp)