Reliability Modeling and Estimating of Pulsed
Flashlamps Based on Failure Physics
Lang Zhang, Jinlun Zhou, and Jun Fan
Information System and Management School, National University of Defense Technology, Changsha, China Email: {zldyxdz, fanjun891009}@163.com, [email protected]
Abstract—Pulsed flashlamps are one of the most important
components in Inertial Confinement Fusion Laser Driver, which showed notable physical relevance in reliability tests. Researching the reliability of the object in the position of physical relevance is a way that different to the traditional methods and has not been applied to the research of pulsed flashlamps practically. Based on the physical characteristics of pulsed flashlamps’ failures, a failure probability model was put forward in the article, which can realize the reliability modeling and estimating of pulsed flashlamps with reliability data of peak-currents from power conditioning module.
Index Terms—pulsed flashlamps, failure physics, failure
probability model, reliability modeling, reliability estimating
I. INTRODUCTION
Pulsed flashlamps (Fig. 1 [1]) is a kind of accurate optics, often arranged in Inertial Confinement Fusion Laser Driver with thousands of branches in combination. During the operation of the device, the main task of pulsed flashlamps is to transform electricity into light, which has crucial influence on the reliability of the entire apparatus. For the research of pulsed flashlamps, there have many reliability tests been carried out, such as 10000-times-shot tests on 200 pulsed flashlamps conducted by LLNL [1] and so on. On the reliability research of pulsed flashlamps, Chen Guangyu studied the failure behaviors of pulsed flashlamps and provided a summary of the failure phenomenas with the test results of pulsed flashlamps [2]; Ryand J. F. Tucker, Nicholas Cochran and Gregg L. Morelli researched how the failure mode, environment variables affect the life estimating methods of pulsed flashlamps by tests [3]; and so on. These studies have accumulated a large number of theoretical and practical experiences.
Figure 1. The basic structure of pulsed flashlamps
Manuscript received December 20, 2014; revised April 24, 2015.
In the field of reliability, a reliability estimating technique based on failure mechanisms、failure modes and failure stress has been applied to explore, namely physical-failure-analysis method, which proved to be a reliable alternative to traditional analysis methods. Exploring the reliability of pulsed flashlamps by physical-failure-analysis method can solve the problems which can’t be solved by traditional analysis methods, and has practical significance. After a long period of reliability testing and observation, it is obvious that there is notable physical relevance in the failure of Pulsed flashlamps, which provide prerequisite for physical-failure-analysis. Realizing the reliability modeling and estimating target of pulsed flashlamps on the basis of physical-failure-analysis is a research approach worth exploring.
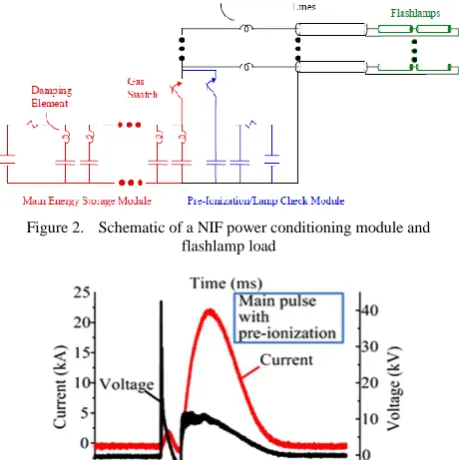
II. FAILURE MECHANISM OF PULSED FLASHLAMPS In Inertial Confinement Fusion Laser Driver, the electricity pulsed flashlamps obtained are provided by power conditioning modules. A simplified schematic of a single power conditioning module is shown in Fig. 2 [4].
Figure 2. Schematic of a NIF power conditioning module and flashlamp load
In operation, the stress pulsed flashlamps beared in each shoting is diagnosed through the peak-currents by a control system (As shown in Fig. 3 [5]). Due to the instability of power conditioning modules, the peak-currents on pulsed flashlamps in the process of shoting are different. With reliability test been launched for a long time, it was discovered that higher peak-currents is an important cause of damage to pulsed flashlamps [6], and the accumulated damage can ultimately lead to the failure of pulsed flashlamps.
Specifically, the energy produced by higher peak-currents was too high and could not be completely converted into light to pass out in moment, the wall of quartz glass evaporated and gasificated under persistent high-temperature-plasma’s effect, deposited on the surface of the inner wall after cooling, formed a loose particulate silica powder (As shown in Fig. 4 [5]).
Figure 4. Pulsed flashlamps with particulate silica powder The ingredient of the whitish substance on the wall is SiO2, its existence makes it difficult for pulsed flashlamps to output enough light to achieve shoting requirements, thereby losing a given functionality.
III. DISTRIBUTION OF PEAK-CURRENTS AND THE PULSED-FLASHLAMP-HURTED PEAK-CURRENTS
I
D
f (I) g(D)
I
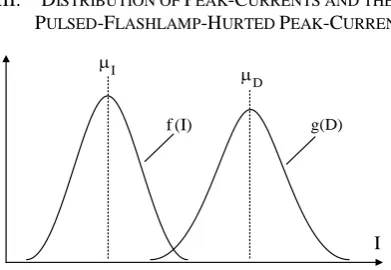
Figure 5. Distribution of peak-currents and the pulsed-flashlamp-hurted peak-currents.
Set variable I as the peak-currents of power conditioning module, due to the difference in manufacturing process of the power conditioning module and the drifting of electronic components’ inconsistencies, the value of I can be very different between each shoting, each circuit and each module, often with random characteristics. Generally, I was a random variable of normal distribution f (I), shown as the left graph in Fig. 5, its probability density function is
2 I 2 I I
(I )
1
f (I) exp
2 2
where 2
I, I
represent the mean and variance of the distribution of peak-currents respectively.
On the other hand, set D as the pulsed-flashlamp-hurted peak-currents which caused damage to pulsed flashlamps. Due to the inconsistencies caused by the difference of stochastic processes and materials, D is a random variable. Thus, D has a random distribution density g (D). Also we can assume g (D) to be normal, shown as the right graph in Fig. 2. The probability density function of D is
2 D 2 D D
(D )
1
g(D) exp
2 2
where 2
D, D
represent the mean and variance of the distribution of the pulsed-flashlamp-hurted peak-currents respectively.
IV. FAILURE PROBABILITY MODEL OF PULSED FLASHLAMPS
Based on the contact between distribution of peak-currents and the pulsed-flashlamp-hurted peak-peak-currents, a failure probability model of pulsed flashlamps can be established. As can be seen from Fig. 5, the failure probability of pulsed flashlamps is partially determined by the size of the overlap between the two distributions, their joint distribution density function can be described as
2 2
I D
2 2
I D I D
(I ) (D )
1 h(I, D) f (I) g(D) exp
2 2 2
Do conversion to the formula: Z = I-D, then
2 2
I D
2 2
I D I D
(I ) (I z )
1 h(I, D) f (I) g(I z) exp
2 2 2
According to the failure mechanism of pulsed flashlamps, the failure may occur when the peak-currents I exceeds the pulsed-flashlamp-hurted peak-currents D, so the failure probability of pulsed flashlamps is
z 0
2 2
I D
2 2
I Dz 0 I D
2
D I
2 2
2 2
D I
z 0
D I
F P(I D)
P(z 0) f (I)g(I z)dIdz
(I ) (I z )
1
exp dI dz
2 2 2
(z )
1
exp dz
2( )
2 ( )
For the above formula, set
2 2 2
z I D, z I D,
2 D I 2
2 2
I D
(z )
x
2
z z
x 2 1
F P(I D) e dx
2
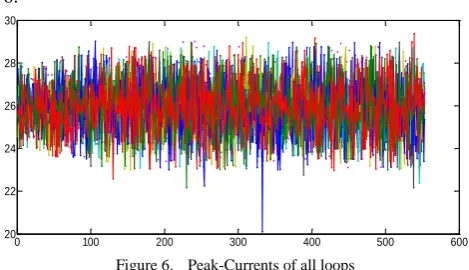
(1) V. RELIABILITY TEST OF PULSED FLASHLAMPS Select 20 pulsed flashlamps from a group of pulsed flashlamps randomly for constant stress accelerated life test, with 10 loops and 2 pulsed flashlamps in each loop to have no-replacing life test under the drive of one power conditioning module. 553 shotings have been placed in total, and the peak-currents data is shown in Fig. 6.0 100 200 300 400 500 600
20 22 24 26 28 30
Figure 6. Peak-Currents of all loops
In the test, all of six pulsed flashlamps in the circuit 3, 5, 8 converted into white, the same change happened to one of the pulsed flashlamps in the 4th circuit. The first time (shotings) the seven pulsed flashlamps converted into white and the corresponding pulsed-flashlamp-hurted peak-currents are shown in Table I.
TABLE I. THE FIRST TIME (SHOTINGS) THE PULSED FLASHLAMPS
CONVERTED INTO WHITE AND THE CORRESPONDING PULSED -FLASHLAMP-HURTED PEAK-CURRENTS
Loop 3 4 5 8
Pulsed flashlamp
number
5 6 7 9 10 15 16 The first time
converted into white
471 490 469 149 178 203 145 Corresponding
peak-currents 26.61 26.35 26.47 26.69 26.58 27.03 26.84 VI. RELIABILITY ESTIMATING OF PULSED FLASHLAMPS A. Normal Distribution Test—Epps-Pulley Test
Epps-Pulley test method is suitable for the situation when the sample size is over 8. This method uses the characteristics of the sample function and the mode of the different characteristic functions of normal distribution to produce a weighted integral, belongs to the integral test.
Do hypothesis that there have n observations from test, namely x ( jj 1, 2, , n), calculate
n
j j 1
1
x
x
n
(2)2 n
2
j j 1
1
s
(x
x)
n
(3)Test statistic is
2 n k 1
j k
EP 2
k 2 j 1
2 n
j 2 j 1
(x x )
n 2
T 1 exp
n 2s
3
(x x)
2 exp
4s
(4)
If the value of TEP is greater than the 1α quantile
determined by the given significant level α and sample size n, reject the null hypothesis, consider the data not to obey the normal distribution; Otherwise, to accept the null hypothesis that the data obey the normal distribution. Epps-Pulley test results of the data from Fig. 6 and Table I are shown in Table II, the conclusion is that two groups of data are subject to normal distribution.
TABLE II. EPPS-PULLEY TEST RESULTS OF TWO GROUPS OF DATA
Name
x
2
s T EP
1
quantile
Obey the normal distribution? Peak-Currents
of all loops 25.9331 2.8205 0.4895 0.590 yes The
pulsed- flashlamp-hurted
peak-currents
26.6529 0.0444 0.0476 0.564 yes
B. Reliability Estimating of Pulsed Flashlamps Based on the Failure Probability Model
Conduct normal fitting to the peak-currents showed in Fig. 6, then get the mean and variance of the peak-currents:
I 25.9331
, 2
I 2.8211
. Meanwhile, do the same work to the corresponding peak-currents in Table I, get the mean and variance:
D 26.6529
, 2
D 0.0518
.
According to z I D, 2 2 2
z I D
, there have
z 0.7198,
z 1.695
Substitute the value of z, z into (1), get the failure
probability of pulsed flashlamp as below
2
x 2 0.4247 1
F P(I D) e dx 0.3355
2
Thus, the reliability of pulsed flashlamps in the test is
1 0.6645
R F
VII. VERIFICATION OF MODEL
A. Exponential Distribution Test of Pulsed Flashlamps’ Life—F Test
If the life of product obeys exponential distribution, the failure rate (t) can be a constant. Therefore, the null
hypothesis H :0 (t) is a constant, the alternative
hypothesis H :1 (t) is not a constant.
randomly. If there have r failures in the test, and the
failure time of them is t(1)t(2) t(r), make
( i ) ( i 1) i
( i ) ( i 1)
(n i 1)(t t ), replace
Y , (i 1, 2, , r)
(t t ) replace no
,
(5)where: t( 0 )=0 . If H : (t)0 is got, then
i.i.d. 2 i
2 Y χ 2 (6)
According to the formula (6) and the additivity of χ2 distribution, we have
1
1
r r
i i 1 2
i 1 i r 1
1 2
1 1
( Y ) /( Y ) F(2r , 2r )
2r 2r
(7)where: r1r2 r. If
1
1
r r
i i
i 1 i r 1
1 2
1 1
Y Y
2r 2r
(8) and1 2
1 2
F
(2r , 2r )
(9)Then reject H0, and (t) is not an increasing function;
otherwise, accept H0. If
1
1
r r
i i
i r 1 i 1
2 1
1 1
Y Y
2r 2r
(10) and2 1
1 2
1/ F (2r , 2r )
(11)
Then reject H0, and (t) is not a reducing function;
otherwise, accept H0. For r1 and r2, let r1=r2, namely
r=2r1=2r2; If r=2r1+1, then let r2=r1+1.
The failure times of pulsed flashlamps got in the reliability test is: 145, 149, 178, 203, 469, 471, 490, next we use F test to make sure if the life of pulsed flashlamps obeys exponential distribution:
According to the test, n=20, r=7, t(1)=145, t(2)=149,
t(3)=178, t(4)=203, t(5)=469, t(6)=471, t(7)=490. Then we
take the data into formula (5), get Y1=2900, Y2=76,
Y3=522, Y4=425, Y5=4256, Y6=30, Y7=266. Let
r2=r1+1=4, then
1
2900+76+522
2 3 0.9371
1
425+4256+30 266
2 4
( )
( )
Because φ<1, so meet the demand of formula (10). For 1/φ=1.0671, if α=0.10, then F0.95(8,6)=4.15>1/φ, accept
H0, consider the life of pulsed flashlamps to obey
exponential distribution.
B. Reliability of Pulsed Flashlamps Based on Statistic Method
For censored life test with no replacement, there have n products been tested, and we stop test when there have r
products got into failure. The failure times of the r
products is: t(1) t( 2 ) t (r( r ) n). According to the
censored sample data, write the likelihood function of the sample
r T / r (1) ( 2 ) ( r )
n !
L( ) f (t , t , , t , ) e
(n r)!
(12)
where:
r
r ( i ) ( r ) i 1
T t (n r)t
is the whole test time.Taking the logarithm and derivation on both sides of the formula (12), then extract the log-likelihood equation, we get
r
r / T
(13)
Because t(1)=145, t(2)=149, t(3)=178, t(4)=203, t(5)=469,
t(6)=471, t(7)=490, so the whole test time T7=8741, the
failure rate of pulsed flashlamps is
7 / 8741 8.0082e-004
Thus, the reliability of the batch of pulsed flashlamps testing for 553 shotings is
R 553 exp( 8.0082e-004 553) 0.6422
C. Verification Conclusion
According to the results obtained, the reliability of the pulsed flashlamps got by the physical-failure-analysis method and the traditional analysis method is very similar. The former is slightly larger than the latter because the latter also considered some minor stress factors on pulsed flashlamps, such as xenon pressure, pipes and so on [7]. Before getting into wear expiry, the main factor lead to the failure of pulsed flashlamps is higher peak currents, so the reliability estimating result based on the data of peak currents can be very approached to the real reliability of pulsed flashlamps. All in all, the failure probability model of pulsed flashlamps established in the article has practical value.
VIII. CONCLUSIONS
By the way of physical-failure-analysis, the research found an effective method which can finish the work of the reliability modeling and estimating of pulsed flashlamps, and also provided a new way for reliability research of pulsed flashlamps. Reliability modeling and estimating method based on the physical failures is not only applicable to the reliability research of pulsed flashlamps, the same applies to the components and systems with similar characteristics.
physical-failure-analysis method to research the reliability characteristics of pulsed flashlamps in the specific operating environment.
ACKNOWLEDGMENT
The authors wish to thank associate professor Guang Jin and lecturer Zheng Qiang Pan for their good help. The research work was supported by one of the national 863 projects.
REFERENCES
[1] A. C. Erlandson, et al., “The effect of amplifier component maintenance on laser system availability and reliability for the US national ignition facility,” in Proc. 2nd Annual International Conference on Solid-State Lasers for Application to Inertial
Confinement Fusion, Paris, France, Dec. 1996.
[2] G. Chen, D. Yang, and X. Zhang, “Reliability analysis of Xe-flashlamps of disk amplifier subsystems for laser facility,” High Power Laser and Particle Beams, vol. 19, no. 7, pp. 1125-1128, 2007.
[3] R. J. F. Tucker, N. Cochran, and G. L. Morelli, “Flashlamp failure modes and lifetime estimation techniques,” Solid State Lasers XXII: Technology and Devices, vol. 8599, no. 3, pp. 265-278, 2013.
[4] P. A. Arnold, et al., “An update on NIF pulsed power,” in Proc.
IEEE Pulsed Power Conference, Jun. 2009, pp. 352-356.
[5] S. Jia, R. Li, J. Liu, X. Li, X. Song, and H. Li, “The plasma channel evolution characteristics of pulsed flashlamps working in an array,” Plasma Science and Technology, vol. 15, no. 7, Jul. 2013.
[6] W. Gagnon, G. Albrecht, J. Trenholme, and M. Newton, Pulsed
Power for Solid-State Lasers, Lawrence Livermore National
Laboratory, Jan. 2008.
[7] Y. Ma, S. Peng, and X. Long, “Factors affecting the high-power pulsed flashlamps’ life,” High Power Laser and Particle Beams, vol. 22, no. 10, pp. 2483-2486, 2010.
Lang Zhang is a master student of College of
Information System and Management in National University of Defense Technology, China. Born in Sichuan in March 12, 1992, currently he is mainly interesting in the research of complex system reliability.
Jinglun Zhou is a Ph.D and a professor of
Information System and Management in National University of Defense Technology, China. His research interests are system reliability, risk assessment and evaluation, information management and decision, falure diagnostics and health management.
Jun Fan is a Ph.D student of College of