ISSN 0975-928X
Research Article
Combining ability and gene action studies for seed yield, its components and
quality traits in bread wheat (
Triticum aestivum
L. em Thell.)
Ankita Singh, Anil Kumar*, Ekhlaque Ahmad, Swati and J.P. Jaiswal
Department of Genetics and Plant Breeding, College of Agriculture, G. B. Pant University of Agriculture & Technology, Pantnagar-263 14, Uttarakhand, India
* E mail:[email protected]
(Received: 07 Mar 2012; Accepted: 02 Apr 2012)
Abstract
Combining ability for yield, its contributing traits and quality parameters was studied in 15 parental genotypes (12 lines, 3 testers) in a line x tester scheme. The purpose of the study was to identify and select superior parents and best hybrid combinations on the basis of estimates of general and specific combining abilities. The differences among genotypes were highly significant for all the characters studied. Estimates of variance due to general combining ability (gca) and specific combining ability (sca) and their ratio revealed that both additive and non-additive gene effects were important for different characters studied. The estimates of gca effects as a whole suggested that if most of the traits are to be improved through hybridization and selection, then priority should be given to parents K 9107 from among the testers and UP 2338*2 /4/SNZ/TRAP#/3/KAUZ*2/TRAP//KAUZ from among the lines. (ATTILA*2/STAR)/PBW550 was the best specific cross for grain yield.
Key words
Bread wheat, combining ability, gene effects, yield, quality traits
Introduction
Wheat is the most important and strategic cereal crop for the majority of world’s population. India is one of the major producers of wheat and occupies second position after China. The total area under cultivation of wheat in India in 2010-11 was 29.2 million hectares with the production of 85.9 million tons and an average yield of 2.94 tons/ha (Anon., 2011).Much of the emphasis on wheat breeding has been placed on increasing productivity of the crop. This has been in response to the pressure for an adequate food supply caused by constantly increasing population in India and the world as a whole. Therefore, development of new improved wheat cultivars with high genetic potential for yield, its components and quality traits has become a permanent goal in the breeding programmes. In order to achieve this target one should be aware of genetic make up and nature of gene action involved in controlling plant responses to different environments. For the breeding programme aiming at hybridization, information about better combiner possessing desirable traits is a pre-requisite. Knowledge of the combining ability is important in selecting suitable parents for hybridization, understanding of inheritance of quantitative traits and also in identifying the promising cross combinations for further use in breeding programmes. The present investigation was undertaken to study the combining ability of varieties/lines for yield, its contributing traits and quality parameters.
Material and Methods
The present investigation was undertaken at the Norman E. Borlaug Crop Research Centre of G. B. Pant University of Agriculture and Technology, Pantnagar, India. Twelve lines of wheat, ATTILA*2 / STAR, MILAN / 3 / PAT24ALD / DOVE/ BUC, SERI.LB// KAUZ/ HEVO/ 3 / AMAD, VL 858, UP 2672, QLD 33, QLD 39, UP 2706, PBW 574, UP 2647,
CAL/NH//H567.71/3/SERI/4/CAL/NH/H567.7/5 and UP2338*2 / 4 / SNZ/TRAP#/ 3/ KAUZ*2/ TRAP// KAUZ and three testers viz., PBW 550, UP 2584 and K 9107 were crossed in line x tester mating scheme to produce 36 crosses during 2009-10. These crosses were then evaluated along with the parents and two checks, UP2338 and PBW343 during 2010-11. The experiment was laid out in a Randomized Block Design (RBD) with three replications. Each plot consisted of two rows of one meter long with a row to row distance of 23 cm. The plant to plant distance was maintained at 10 cm by dibbling the seeds manually.
ISSN 0975-928X
given by Kempthorne (1957) and modified by Arunachalam (1974). This design is related to North Carolina Design II of Comstock and Robinson (1952).
Results and Discussion
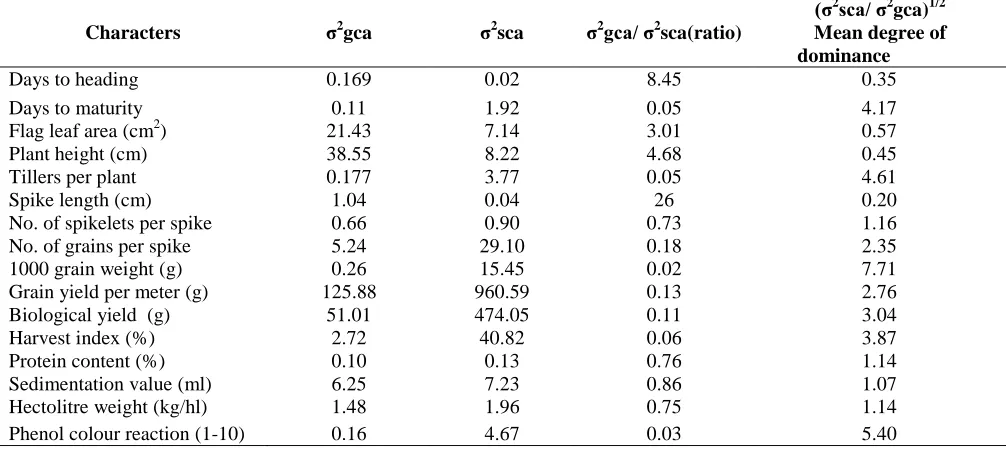
The analysis of variance revealed highly significant differences among the genotypes for all the characters studied, which suggest the presence of adequate diversity among the genotypes (Table 1). The estimates of general combining ability (gca) and specific combining ability (sca) variances presented in Table 2 revealed that both additive and non-additive gene effects were important for different characters. It was observed that the ratio of variance of gca and sca was much more than unity for the characters days to heading, flag leaf area, plant height and spike length which indicated the predominant role of additive gene action in the inheritance of these traits. In all the other characters non-additive gene action was observed. These findings are in general agreement with those of Hamada et al. (2002), Muhammad (2009), Singh et al. (2002), Desai and Singh (2005) and Esmail (2007).
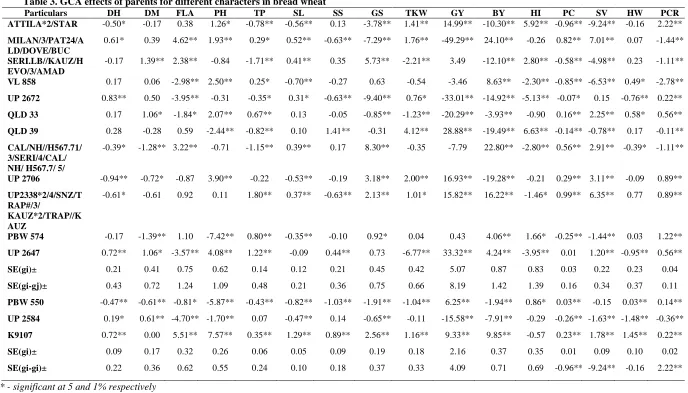
The magnitude and direction of combining ability effects provide the guidelines for the utilization of parents in hybridization programme. Significant gca effects have been recorded for all the characters studied (Table 3). It was observed that none of the parents was a good general combiner simultaneously for all the characters. Among the lines, UP 2338*2/ 4/ SNZ/ TRAP#/3/ KAUZ*2/TRAP//KAUZ combined well for the highest number of characters including quality traits namely, number of effective tillers per plant, spike length, number of grains per spike, 1000 grain weight, grain yield, biological yield, protein content, sedimentation value, hectolitre weight and phenol colour reaction. The genotype ATTILA*2/STAR was identified as a good general combiner for the characters flag leaf area, plant height, 1000 grain weight, grain yield, harvest index and phenol colour reaction. The genotype MILAN/3/PAT24/ALD/DOVE/BUC appeared as a good general combiner for days to 75% heading, flag leaf area, plant height, tillers per plant, spike length, 1000 grain weight, biological yield and sedimentation value. Similarly the genotype SERI.LB//KAUZ/HEVO/3/AMAD was adjusted as a good general combiner for days to maturity, flag leaf area, spike length, number of grains per spike and harvest index.
The genotype CAL/ NH// H567.71/ 3/ SERI/ 4/ CAL/ NH/H567.7/5/ appeared as a good general combiner for six characters namely, flag leaf area, spike length, number of grains per spike, biological yield, protein content and sedimentation value. QLD 33 appeared as a good general combiner for days to maturity, plant height, tillers per plant,
sedimentation value, hectolitre weight and phenol colour reaction. QLD 39 was identified as a good general combiner for plant height, number of spikelets per spike, 1000 grain weight, grain yield and harvest index.
UP 2706 emerged as a good general combiner for plant height, number of grains per spike, 1000 grain weight, protein content, sedimentation value, phenol colour reaction and grain yield. PBW 574 was observed to be a good general combiner for number of effective tillers per plant, number of grains per spike, biological yield, harvest index and phenol colour reaction. UP 2647 was identified as good general combiner for days to 75% heading, plant height, number of effective tillers per plant, spikelets per spike, grain yield, biological yield, sedimentation value and phenol colour reaction. The genotypes, VL 858 and UP 2672 were good general combiners for least number of characters. Such variations are expected due to differences in the genotypic constitution of the parents for different characters.
Among the testers, PBW 550 emerged as a good general combiner for flag leaf area, harvest index, grain yield, protein content, hectolitre weight and phenol colour reaction. UP 2584 appeared as a good general combiner for days to 75% heading, number of spikelets per spike, 1000 grain weight, grain yield, protein content, sedimentation value, hectolitre weight and phenol colour reaction. The tester, K 9107 was observed to be the best general combiner as it has shown gca for the maximum 14 traits namely, days to 75% heading, days to maturity, flag leaf area, plant height, number of effective tillers per plant, spike length, number of spikelets per spike, number of grains per spike, 1000 grain weight, grain yield, protein content, sedimentation value, hectolitre weight and phenol colour reaction and thus it was ranked as the best general combiner.
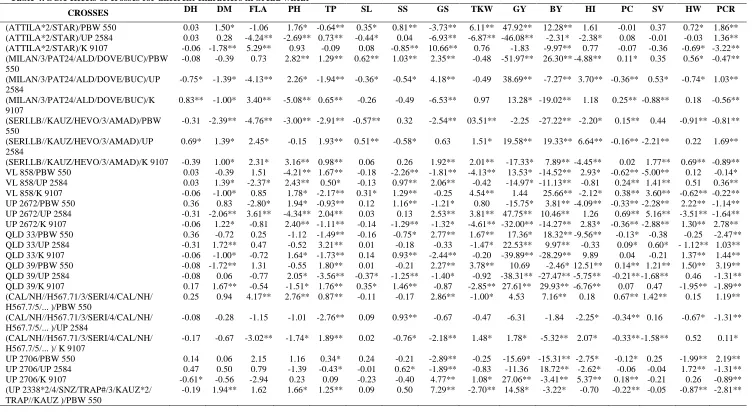
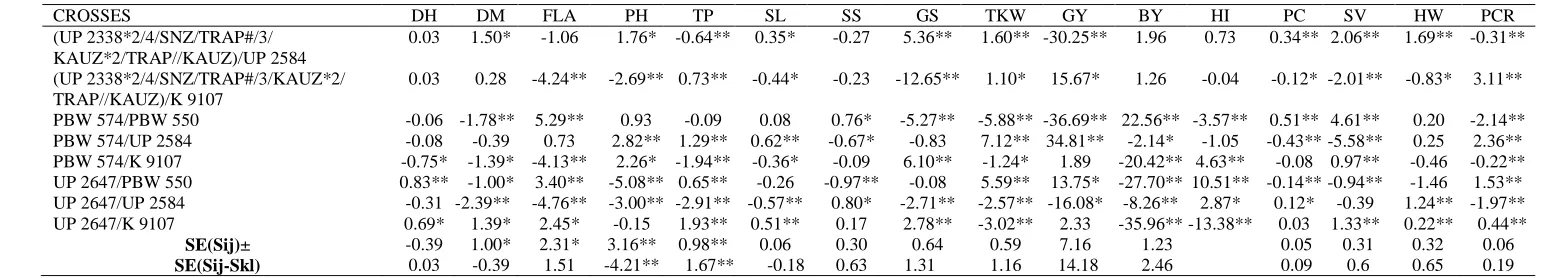
The estimates of sca presented in Table 4 revealed that the cross QLD 39/K 9107 had the highest specific combining ability for number of spikelets per spike and the parents involved were the best general combiners for this character. Similarly, for harvest index, the cross QLD 39/PBW 550 had high sca effect and both the parents involved were also good general combiners for the same character. There are chances of recovering transgressive segregants from these combinations in later generations.
ISSN 0975-928X
spikelets per spike, harvest index and grain yield, respectively. However, for all the other characters studied, the crosses with high sca effects were not having high mean values. Similar findings were reported by Palve et al. (1986), Thakre et al. (1996) and Ghimiray et al. (2000).
The differences among genotypes were highly significant for all the characters studied. The degree of dominance based on the ratio of sca and gca variances indicated that both additive and non-additive gene effects were predominant for different characters studied. The good general combiners for grain yield were ATTILA*2/STAR, QLD 39, UP
2647, UP 2706, UP
2338*2/4/SNZ/TRAP#/3/KAUZ*2/TRAP//KAUZ, PBW 550 and K 9107. The estimates of gca effect as a whole suggested that if most of the traits are to be improved through hybridization and selection, then priority should be given to the parent K 9107 from among the testers and UP 2338*2 /4/SNZ/TRAP#/3/KAUZ*2/TRAP//KAUZ from among the lines. (ATTILA*2/STAR)/ PBW550 was the best specific cross for grain yield. This cross may prove to be useful in future breeding programmes.
Acknowledgement
Authors acknowledge with thanks the Director, Experiment Station, GBPUAT, Pantnagar for providing necessary facilities to carry out the present investigation.
References
Anonymous. 2011. Progress Report of All India Coordinated Wheat and Barley Improvement Project 2010-11, Project Director’s Report. Ed: Indu Sharma. Directorate of Wheat Research, Karnal, India. p 74.
Arunachalam, V. 1974. The falacy behind the use of modified line x tester design. Indian J. Genet.,
34: 280-287.
Comstock, R. E. and Robinson, H. F. 1952. The components of genetic variance in populations of biparental progenies and their use in estimating the average degree of dominance.
Biometrics4: 254–266.
Desai, S. and Singh, I. 2005. Combining ability analysis in wheat plant characters and harvest index, biological and grain yield. Int. J. Trop. Agric. Sci.,65: 75–78.
Esmail, R. M. 2007. Detection of genetic components through triple test cross and line x tester analysis in bread wheat. World J. Agrl. Sci., 3
(2): 184 - 190.
Fisher, R. A. 1918. The correlation among relatives on the supposition of Mendelian inheritance. Trans Royal Society of Edinburgh, 52: 399-433. Ghimiray, T. S. and Sarkar, K. K. 2000. Combining ability
of wheat (Triticum aestivum L) genotypes for quality parameters in terai soil. J. Interacademicia4 (3): 366-369.
Hamada, A. A,, Seidy, E .H. and Hendawy, H. I. 2002. Breeding measurements for heading date, yield and yield components in wheat using line x tester analysis. Annals of Agrl. Sci.,47(2): 587-609.
Kempthorne, O. 1957. An Introduction to Genetic Statistics, John Wiley & Sons, New York. Muhammad, O. 2009. Combining ability in wheat for
seedling traits by line x tester analysis under saline conditions. Italian J. Agron., 4 (2):13-18.
Palve, S. M, Thete, R.Y., Dumbre, A. D. and Hapase, R.S. 1986. Heterosis in wheat (Triticum aestivum L.) from line x tester analysis. Curr. Res. Reporter, Mahatma Phule Agrl. Univ., 2
(2): 179-183.
Rajara, M.P. and Maheshwari, R.V. 1996. Combining ability in wheat using line x tester analysis.
Madras Agrl. J., 83 (3): 107-110.
Singh, R., Bhawsar, R.C., Holkar, A. S., Verma, G. P., Patidar, G. .L and Prasad, S.V.S. 2002.Combining ability for grain yield and its components in wheat. Agrl. Sci. Digest,22 (4): 273-275.
Thakre, J. M., Vitkare, D.G., Godbole, A.K. and Atale, S.B. 1996. Line x tester analysis in wheat for yield and its traits. Annals of Plant Physiol.,10
ISSN 0975-928X
Table 1. Analysis of variance for different characters in bread wheat
Characters MS due to Replication (df=2)
MS due to Treatment (df=50)
MS due to Error (df=100)
Days to heading 5.81 2.53** 0.85
Days to maturity 2.13 7.62** 2.35
Flag leaf area (cm2) 17.28 117.72** 6.94
Plant height (cm) 9.68 162.34** 5.39
Tillers per plant 2.05 17.38** 1.05
Spike length (cm) 0.62 3.80** 0.19
No. of spikelets per spike 1.12 4.05** 0.59
No. of grains per spike 1.76 124.51** 2.58
1000 grain weight (g) 1.47 81.46** 2.03
Grain yield per meter (g) 3.88 3967.45** 2087.16
Biological yield (g) 741.96 3199.79** 748.18
Harvest index (%) 4.66 100.51** 8.81
Protein content (%) 0.03 1.85** 0.01
Sedimentation value (ml) 0.92 105.95** 0.54
Hectolitre weight (kg/hl) 0.17 10.01** 0.65
Phenol colour reaction (1-10) 0.07 16.18** 0.05
*, **significant at 5% and 1% probability level, respectively
Table 2. General and specific combining ability variances in bread wheat
Characters σ2gca σ2sca σ2gca/ σ2sca(ratio)
(σ2sca/ σ2
gca)1/2 Mean degree of dominance
Days to heading 0.169 0.02 8.45 0.35
Days to maturity 0.11 1.92 0.05 4.17
Flag leaf area (cm2) 21.43 7.14 3.01 0.57
Plant height (cm) 38.55 8.22 4.68 0.45
Tillers per plant 0.177 3.77 0.05 4.61
Spike length (cm) 1.04 0.04 26 0.20
No. of spikelets per spike 0.66 0.90 0.73 1.16
No. of grains per spike 5.24 29.10 0.18 2.35
1000 grain weight (g) 0.26 15.45 0.02 7.71
Grain yield per meter (g) 125.88 960.59 0.13 2.76
Biological yield (g) 51.01 474.05 0.11 3.04
Harvest index (%) 2.72 40.82 0.06 3.87
Protein content (%) 0.10 0.13 0.76 1.14
Sedimentation value (ml) 6.25 7.23 0.86 1.07
Hectolitre weight (kg/hl) 1.48 1.96 0.75 1.14
ISSN 0975-928X
Table 3. GCA effects of parents for different characters in bread wheat
Particulars DH DM FLA PH TP SL SS GS TKW GY BY HI PC SV HW PCR
ATTILA*2/STAR -0.50* -0.17 0.38 1.26* -0.78** -0.56** 0.13 -3.78** 1.41** 14.99** -10.30** 5.92** -0.96** -9.24** -0.16 2.22**
MILAN/3/PAT24/A LD/DOVE/BUC
0.61* 0.39 4.62** 1.93** 0.29* 0.52** -0.63** -7.29** 1.76** -49.29** 24.10** -0.26 0.82** 7.01** 0.07 -1.44**
SERI.LB//KAUZ/H EVO/3/AMAD
-0.17 1.39** 2.38** -0.84 -1.71** 0.41** 0.35 5.73** -2.21** 3.49 -12.10** 2.80** -0.58** -4.98** 0.23 -1.11**
VL 858 0.17 0.06 -2.98** 2.50** 0.25* -0.70** -0.27 0.63 -0.54 -3.46 8.63** -2.30** -0.85** -6.53** 0.49* -2.78**
UP 2672 0.83** 0.50 -3.95** -0.31 -0.35* 0.31* -0.63** -9.40** 0.76* -33.01** -14.92** -5.13** -0.07* 0.15 -0.76** 0.22**
QLD 33 0.17 1.06* -1.84* 2.07** 0.67** 0.13 -0.05 -0.85** -1.23** -20.29** -3.93** -0.90 0.16** 2.25** 0.58* 0.56**
QLD 39 0.28 -0.28 0.59 -2.44** -0.82** 0.10 1.41** -0.31 4.12** 28.88** -19.49** 6.63** -0.14** -0.78** 0.17 -0.11**
CAL/NH//H567.71/ 3/SERI/4/CAL/ NH/ H567.7/ 5/
-0.39* -1.28** 3.22** -0.71 -1.15** 0.39** 0.17 8.30** -0.35 -7.79 22.80** -2.80** 0.56** 2.91** -0.39* -1.11**
UP 2706 -0.94** -0.72* -0.87 3.90** -0.22 -0.53** -0.19 3.18** 2.00** 16.93** -19.28** -0.21 0.29** 3.11** -0.09 0.89**
UP2338*2/4/SNZ/T RAP#/3/
KAUZ*2/TRAP//K AUZ
-0.61* -0.61 0.92 0.11 1.80** 0.37** -0.63** 2.13** 1.01* 15.82** 16.22** -1.46* 0.99** 6.35** 0.77 0.89**
PBW 574 -0.17 -1.39** 1.10 -7.42** 0.80** -0.35** -0.10 0.92* 0.04 0.43 4.06** 1.66* -0.25** -1.44** 0.03 1.22**
UP 2647 0.72** 1.06* -3.57** 4.08** 1.22** -0.09 0.44** 0.73 -6.77** 33.32** 4.24** -3.95** 0.01 1.20** -0.95** 0.56**
SE(gi)± 0.21 0.41 0.75 0.62 0.14 0.12 0.21 0.45 0.42 5.07 0.87 0.83 0.03 0.22 0.23 0.04
SE(gi-gj)± 0.43 0.72 1.24 1.09 0.48 0.21 0.36 0.75 0.66 8.19 1.42 1.39 0.16 0.34 0.37 0.11
PBW 550 -0.47** -0.61** -0.81* -5.87** -0.43** -0.82** -1.03** -1.91** -1.04** 6.25** -1.94** 0.86* 0.03** -0.15 0.03** 0.14**
UP 2584 0.19* 0.61** -4.70** -1.70** 0.07 -0.47** 0.14 -0.65** -0.11 -15.58** -7.91** -0.29 -0.26** -1.63** -1.48** -0.36**
K9107 0.72** 0.00 5.51** 7.57** 0.35** 1.29** 0.89** 2.56** 1.16** 9.33** 9.85** -0.57 0.23** 1.78** 1.45** 0.22**
SE(gi)± 0.09 0.17 0.32 0.26 0.06 0.05 0.09 0.19 0.18 2.16 0.37 0.35 0.01 0.09 0.10 0.02
SE(gi-gi)± 0.22 0.36 0.62 0.55 0.24 0.10 0.18 0.37 0.33 4.09 0.71 0.69 -0.96** -9.24** -0.16 2.22**
*,** - significant at 5 and 1% respectively
ISSN 0975-928X
Table 4. SCA effects of crosses for different characters in bread wheat
CROSSES DH DM FLA PH TP SL SS GS TKW GY BY HI PC SV HW PCR
(ATTILA*2/STAR)/PBW 550 0.03 1.50* -1.06 1.76* -0.64** 0.35* 0.81** -3.73** 6.11** 47.92** 12.28** 1.61 -0.01 0.37 0.72* 1.86** (ATTILA*2/STAR)/UP 2584 0.03 0.28 -4.24** -2.69** 0.73** -0.44* 0.04 -6.93** -6.87** -46.08** -2.31* -2.38* 0.08 -0.01 -0.03 1.36** (ATTILA*2/STAR)/K 9107 -0.06 -1.78** 5.29** 0.93 -0.09 0.08 -0.85** 10.66** 0.76 -1.83 -9.97** 0.77 -0.07 -0.36 -0.69* -3.22** (MILAN/3/PAT24/ALD/DOVE/BUC)/PBW
550
-0.08 -0.39 0.73 2.82** 1.29** 0.62** 1.03** 2.35** -0.48 -51.97** 26.30** -4.88** 0.11* 0.35 0.56* -0.47**
(MILAN/3/PAT24/ALD/DOVE/BUC)/UP 2584
-0.75* -1.39* -4.13** 2.26* -1.94** -0.36* -0.54* 4.18** -0.49 38.69** -7.27** 3.70** -0.36** 0.53* -0.74* 1.03**
(MILAN/3/PAT24/ALD/DOVE/BUC)/K 9107
0.83** -1.00* 3.40** -5.08** 0.65** -0.26 -0.49 -6.53** 0.97 13.28* -19.02** 1.18 0.25** -0.88** 0.18 -0.56**
(SERI.LB//KAUZ/HEVO/3/AMAD)/PBW 550
-0.31 -2.39** -4.76** -3.00** -2.91** -0.57** 0.32 -2.54** 03.51** -2.25 -27.22** -2.20* 0.15** 0.44 -0.91** -0.81**
(SERI.LB//KAUZ/HEVO/3/AMAD)/UP 2584
0.69* 1.39* 2.45* -0.15 1.93** 0.51** -0.58* 0.63 1.51* 19.58** 19.33** 6.64** -0.16** -2.21** 0.22 1.69**
(SERI.LB//KAUZ/HEVO/3/AMAD)/K 9107 -0.39 1.00* 2.31* 3.16** 0.98** 0.06 0.26 1.92** 2.01** -17.33* 7.89** -4.45** 0.02 1.77** 0.69** -0.89** VL 858/PBW 550 0.03 -0.39 1.51 -4.21** 1.67** -0.18 -2.26** -1.81** -4.13** 13.53* -14.52** 2.93* -0.62** -5.00** 0.12 -0.14* VL 858/UP 2584 0.03 1.39* -2.37* 2.43** 0.50* -0.13 0.97** 2.06** -0.42 -14.97* -11.13** -0.81 0.24** 1.41** 0.51 0.36** VL 858/K 9107 -0.06 -1.00* 0.85 1.78* -2.17** 0.31* 1.29** -0.25 4.54** 1.44 25.66** -2.12* 0.38** 3.60** -0.62** -0.22** UP 2672/PBW 550 0.36 0.83 -2.80* 1.94* -0.93** 0.12 1.16** -1.21* 0.80 -15.75* 3.81** -4.09** -0.33** -2.28** 2.22** -1.14** UP 2672/UP 2584 -0.31 -2.06** 3.61** -4.34** 2.04** 0.03 0.13 2.53** 3.81** 47.75** 10.46** 1.26 0.69** 5.16** -3.51** -1.64** UP 2672/K 9107 -0.06 1.22* -0.81 2.40** -1.11** -0.14 -1.29** -1.32* -4.61** -32.00** -14.27** 2.83* -0.36** -2.88** 1.30** 2.78** QLD 33/PBW 550 0.36 -0.72 0.25 -1.12 -1.49** -0.16 -0.75* 2.77** 1.67** 17.36* 18.32** -9.56** -0.13* -0.38 -0.25 -2.47** QLD 33/UP 2584 -0.31 1.72** 0.47 -0.52 3.21** 0.01 -0.18 -0.33 -1.47* 22.53** 9.97** -0.33 0.09* 0.60* - 1.12** 1.03** QLD 33/K 9107 -0.06 -1.00* -0.72 1.64* -1.73** 0.14 0.93** -2.44** -0.20 -39.89** -28.29** 9.89 0.04 -0.21 1.37** 1.44** QLD 39/PBW 550 -0.08 -1.72** 1.31 -0.55 1.80** 0.01 -0.21 2.27** 3.78** 10.69 -2.46* 12.51** 0.14** 1.21** 1.50** 3.19** QLD 39/UP 2584 -0.08 0.06 -0.77 2.05* -3.56** -0.37* -1.25** -1.40* -0.92 -38.31** -27.47** -5.75** -0.21** -1.68** 0.46 -1.31** QLD 39/K 9107 0.17 1.67** -0.54 -1.51* 1.76** 0.35* 1.46** -0.87 -2.85** 27.61** 29.93** -6.76** 0.07 0.47 -1.95** -1.89** (CAL/NH//H567.71/3/SERI/4/CAL/NH/
H567.7/5/... )/PBW 550
0.25 0.94 4.17** 2.76** 0.87** -0.11 -0.17 2.86** -1.00* 4.53 7.16** 0.18 0.67** 1.42** 0.15 1.19**
(CAL/NH//H567.71/3/SERI/4/CAL/NH/ H567.7/5/... )/UP 2584
-0.08 -0.28 -1.15 -1.01 -2.76** 0.09 0.93** -0.67 -0.47 -6.31 -1.84 -2.25* -0.34** 0.16 -0.67* -1.31**
(CAL/NH//H567.71/3/SERI/4/CAL/NH/ H567.7/5/... )/ K 9107
-0.17 -0.67 -3.02** -1.74* 1.89** 0.02 -0.76* -2.18** 1.48* 1.78* -5.32** 2.07* -0.33** -1.58** 0.52 0.11*
UP 2706/PBW 550 0.14 0.06 2.15 1.16 0.34* 0.24 -0.21 -2.89** -0.25 -15.69* -15.31** -2.75* -0.12* 0.25 -1.99** 2.19** UP 2706/UP 2584 0.47 0.50 0.79 -1.39 -0.43* -0.01 0.62* -1.89** -0.83 -11.36 18.72** -2.62* -0.06 -0.04 1.72** -1.31** UP 2706/K 9107 -0.61* -0.56 -2.94 0.23 0.09 -0.23 -0.40 4.77** 1.08* 27.06** -3.41** 5.37** 0.18** -0.21 0.26 -0.89** (UP 2338*2/4/SNZ/TRAP#/3/KAUZ*2/
TRAP//KAUZ )/PBW 550
ISSN 0975-928X
Table 4. contd.
CROSSES DH DM FLA PH TP SL SS GS TKW GY BY HI PC SV HW PCR
(UP 2338*2/4/SNZ/TRAP#/3/ KAUZ*2/TRAP//KAUZ)/UP 2584
0.03 1.50* -1.06 1.76* -0.64** 0.35* -0.27 5.36** 1.60** -30.25** 1.96 0.73 0.34** 2.06** 1.69** -0.31**
(UP 2338*2/4/SNZ/TRAP#/3/KAUZ*2/ TRAP//KAUZ)/K 9107
0.03 0.28 -4.24** -2.69** 0.73** -0.44* -0.23 -12.65** 1.10* 15.67* 1.26 -0.04 -0.12* -2.01** -0.83* 3.11**
PBW 574/PBW 550 -0.06 -1.78** 5.29** 0.93 -0.09 0.08 0.76* -5.27** -5.88** -36.69** 22.56** -3.57** 0.51** 4.61** 0.20 -2.14** PBW 574/UP 2584 -0.08 -0.39 0.73 2.82** 1.29** 0.62** -0.67* -0.83 7.12** 34.81** -2.14* -1.05 -0.43** -5.58** 0.25 2.36** PBW 574/K 9107 -0.75* -1.39* -4.13** 2.26* -1.94** -0.36* -0.09 6.10** -1.24* 1.89 -20.42** 4.63** -0.08 0.97** -0.46 -0.22** UP 2647/PBW 550 0.83** -1.00* 3.40** -5.08** 0.65** -0.26 -0.97** -0.08 5.59** 13.75* -27.70** 10.51** -0.14** -0.94** -1.46 1.53** UP 2647/UP 2584 -0.31 -2.39** -4.76** -3.00** -2.91** -0.57** 0.80* -2.71** -2.57** -16.08* -8.26** 2.87* 0.12* -0.39 1.24** -1.97** UP 2647/K 9107 0.69* 1.39* 2.45* -0.15 1.93** 0.51** 0.17 2.78** -3.02** 2.33 -35.96** -13.38** 0.03 1.33** 0.22** 0.44**
SE(Sij)± -0.39 1.00* 2.31* 3.16** 0.98** 0.06 0.30 0.64 0.59 7.16 1.23 0.05 0.31 0.32 0.06
SE(Sij-Skl) 0.03 -0.39 1.51 -4.21** 1.67** -0.18 0.63 1.31 1.16 14.18 2.46 0.09 0.6 0.65 0.19
*,** - significant at 5 and 1% respectively
ISSN 0975-928X
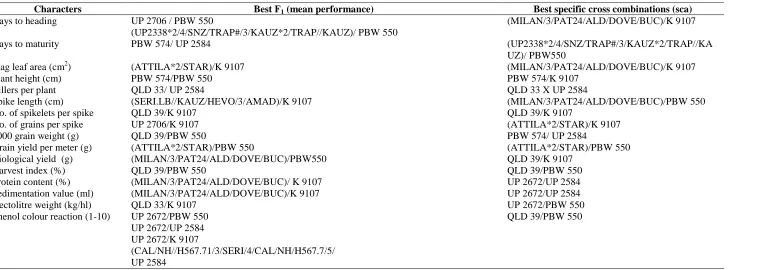
Table 5. Crosses with highest mean and sca effects in bread wheat
Characters Best F1 (mean performance) Best specific cross combinations (sca)
Days to heading UP 2706 / PBW 550
(UP2338*2/4/SNZ/TRAP#/3/KAUZ*2/TRAP//KAUZ)/ PBW 550
(MILAN/3/PAT24/ALD/DOVE/BUC)/K 9107
Days to maturity PBW 574/ UP 2584 (UP2338*2/4/SNZ/TRAP#/3/KAUZ*2/TRAP//KA
UZ)/ PBW550
Flag leaf area (cm2) (ATTILA*2/STAR)/K 9107 (MILAN/3/PAT24/ALD/DOVE/BUC)/K 9107
Plant height (cm) PBW 574/PBW 550 PBW 574/K 9107
Tillers per plant QLD 33/ UP 2584 QLD 33 X UP 2584
Spike length (cm) (SERI.LB//KAUZ/HEVO/3/AMAD)/K 9107 (MILAN/3/PAT24/ALD/DOVE/BUC)/PBW 550
No. of spikelets per spike QLD 39/K 9107 QLD 39/K 9107
No. of grains per spike UP 2706/K 9107 (ATTILA*2/STAR)/K 9107
1000 grain weight (g) QLD 39/PBW 550 PBW 574/ UP 2584
Grain yield per meter (g) (ATTILA*2/STAR)/PBW 550 (ATTILA*2/STAR)/PBW 550
Biological yield (g) (MILAN/3/PAT24/ALD/DOVE/BUC)/PBW550 QLD 39/K 9107
Harvest index (%) QLD 39/PBW 550 QLD 39/PBW 550
Protein content (%) (MILAN/3/PAT24/ALD/DOVE/BUC)/ K 9107 UP 2672/UP 2584
Sedimentation value (ml) (MILAN/3/PAT24/ALD/DOVE/BUC)/K 9107 UP 2672/UP 2584
Hectolitre weight (kg/hl) QLD 33/K 9107 UP 2672/PBW 550
Phenol colour reaction (1-10) UP 2672/PBW 550 UP 2672/UP 2584 UP 2672/K 9107
(CAL/NH//H567.71/3/SERI/4/CAL/NH/H567.7/5/ UP 2584