Int. J. Hum. Capital Urban Manage., 4(1): 69-76, Winter 2019
*Corresponding Author: Email: [email protected] Phone: +98 21 88779474-5 Fax: +98 21 88779476
International Journal of Human Capital in Urban Management (IJHCUM)
Homepage: http://www.ijhcum.net/
CASE STUDY
Modeling the behavior of disordered taxi drivers of Tehran for choosing
passenger and destination
A. Edrisi1,* N. Javanbakht2, H. Ganjipour1
1 Department of Civil Engineering, K.N. Toosi University of Technology, Tehran, Iran
2 Department of Civil Engineering, Imam Khomeini International University, Qazvin, Iran
In this study, the manner of private taxis drivers has been investigated for choosing passenger and destination from a fixed point. Therefore, two models called Multinomial and Nested Logit Models have been utilized. The information gained by scrolling in 2016 is the input data, which are in the format of revealed preference, acquired by the verbal interview in Vanak Square in Tehran (Iran). Based on data resulted by 120 questionnaires the selection modeling of passenger and destination was done. The results of the descriptive analysis show that 96.7% of respondents are men and only 3.3% are women. In addition, 15% of them are illiterate, 16.7% have under Diploma degree, 52.5% have Diploma degree and 15.8% have Bachelor degree or higher. On average, the verification was 44%, and the results achieved by this research show that the parameters consisting of searching time, the working time of drivers and the traveling time were the most important factors resulted from the calibration of the Logit models. Nested Logit model has a better performance compared with the Multinomial Logit model. The Nested Logit Model has ρ2=0.45 while this value is 0.35 for the Multinomial Logit Model. Finally, the suitable decision has been made in the various path based on gained results.
©2019 IJHCUM. All rights reserved.
ARTICLE INFO Article History:
Received 11 September 2018 Revised 08 November 2018 Accepted 25 December 2018
Keywords:
Disordered taxis Multinomial Logit Nested Logit Public transport
Statistical Package for the Social Sciences (SPSS)
ABSTRACT
INTRODUCTION
Taxi is one of the rental and public transportation means which is mainly used for short trips within the cities that can carry a few passengers. They can be divided into three main categories based on their operation called line, private and disordered taxis. The first type is the line taxis that have the fixed beginning and the end. The second type named Azhans handled by private companies work in big cities and in a certain region. By means of this
method, the passengers placed in every position can call the companies and request the taxi. The third type is disordered taxis, and in this method, the commuters who would be in every place can rent the taxis if there is a coordination between the taxi driver and the passenger. In the other word, the destination is chosen based on the condition of the driver and the
passenger (Salanova and Estrada, 2015). In Tehran city, it is common to use the private car for moving the passengers. Up to now, an all-out research has not been done in this matter, but many researches have been done as to the taxi and the characteristics
70
of the vehicle of the taxi expressed at the following
paragraphs (Yang et al., 2002). Yang and Wong (1998)
developed a model for the taxi networks, which is the main basic research for the other investigations done at the science and Technology University of Hong Kong. The processes of choosing and capacity of the vehicle interact with the frequency and the privacy. In addition, some parameters such as the average waiting time of the taxi, headway, traveling time, the percentage of using the navigation, can be achieved in this model by applying different size for the navigation. In addition, the effect of some other parameters such as recognition that can affect the other variables could be investigated. In another paper, they gained the previous model for elastic demand and the condition of heavy traffic (Wong et al., 2001). Fu (2003) presented a model, if this model is applied, which size of navigation, capacity and the quality of the service for demand and the certain condition can be acquired. Based on the surface of the region the number of navigation will be achieved in this model. The service taxi status is being investigated in some countries such
as England and the USA and Schaller (2006), Ireland
(Commission for Taxi Regulation, 2005), Wales (Pricing and Tribunal, 1999), Canada (The Toronto Task Force to Review the Taxi Industry, 1998), Hong Kong (Hung
et al., 2006), England (Public Carriage Office, 2003)
and Australia (D.T.A., 1999) every year or once in some years. US Department of Energy explored the status of CNG Taxis in Kensington, Maryland State. In this report, a comparison between CNG and gasoline Taxis was performed in the aspect of maintenance costs, operational costs, purchase cost and various
pollutants (Whalen et al., 1999). Yang et al. (2002) assessed the nature of demand’s balance and supply in a regular market for the taxi service in a research done in Hong Kong city. They applied a network model in order to describe the balance of service and supply which was different from the other common analyzing methods. This model can determine the values of the operation in balance. For instance, the rate of using taxis or its surface of service can be placed in this category. Yang et al. (2010) suggested a model for
nonlinear pricing of taxi services. Gholami et al. (2014) evaluated the lines of the taxi in District 1 in Tehran province. The meaning of the lines is some paths that have two stations consist of the beginning and destination. At this work, they categorized these lines, because they wanted to replace this overdesign lines
with the other methods of transportation. Bacache-Beauvallet and Janin (2012) concluded that the license value is decreased with the increasing of its number.
Cai et al., (2016) assessed the taxi trip patterns for 3
weeks in Beijing, China with analyzing data resulted from routing of 11880 taxis. The result showed that patterns of taxi trips have the same specifications with the patterns of passengers, but some differences were observed. Amat et al. (2014) explored the efficiency and profitability of taxi sector in Barcelona. Yazici et al. (2016) modeled the way of decision making of the drivers in order to enhance the access to the airport. They simulated the decision of taxi drivers, which was based on some data from routing, wanting to take the passengers of the airport by using the Logit model. Results showed that some items such as heat of the weather, environment and work shift are the most important factors for decision making of the drivers. Prentice et al. (2010) explored the effects of disordered taxis in cities in the world. The results showed that if taxis have license for pick-up passengers outside of the stations, the satisfaction of passengers may be increased. In the following sections, data collection, modeling and results are discussed. The current study has been carried out Tehran, Iran in 2016 for modeling the disordered taxi driver’s behavior. In the following sections, data collection, Methodology, Multinomial and Nested Logit Models and results are discussed, respectively.
MATERIALS AND METHODS
Used data for the model are obtained from the
71
Int. J. Hum. Capital Urban Manage., 4(1): 69-76, Winter 2019
Diploma degree, 52.5% (63 individuals) have Diploma degree and 15.8% (19 individuals) have Bachelor degree or higher. Multinomial and Nested Logit were used for modeling. In Logit Models, n person (decider) can choose between j options. Obtained utility for each person, at j option, consists of two parts. First part, shown by νnj, can be observed by researcher and will affect behavior of the decision maker. Second part is unknown and invisible part which can be shown by εnj and be assume as random. If choice takes place from numerous options, with using this model probability of selected object can be calculated (Eq. 1). Utility function is as follows:
PA = ( )
( )
A j j exp Uexp U
∑
(1)In which PA is possibility of selecting an option and
UA is utility function of selecting A, Uj is utility function of selecting j. It should be noted that the ratio of two options depends only on the utility function and utility of these two options is independent of other options. In addition, the overall structure of the Logit with two options is named Binary Logit and with multiple options is named Multinomial Logit
(Louviere et al., 2000). To evaluating Logit models, usually, following tests are done: 1) T-statistic: like other process-oriented models; is using to determine the importance of each of the model explanatory variables in trust levels of 1%, 5%, and 10%. 2) ρ2 index:
shows goodness of fit and has properties similar to R2
in linear process-oriented models. ρ02 and ρ
c2 indices can be obtained (Eqs. 2 and 3) as follows:
ρ02 = 1- ( ) ( )0 LL LL
β
(2)
ρc2 = 1- ( ) ( ) LL LL c
β
(3)
LL (0): When all the coefficients in the model are zero and portion of all thing be the same.
LL (C): If the utility function of each traveling vehicle is the same with its portion or utility function of each option be constant. When the coefficients in the utility functions estimated based on the estimated inclination (Eqs. 4 and 5). Generally:
LL(0) ≤ LL(c) ≤ LL(β) ≤ 0 (4)
0 ≤ ρ02, ρ
c2≤ 1 (5)
The ρ02 coefficient measures improve of the model
and see the effect of all coefficient (Hensher et al., 2005).
RESULTS AND DISCUSSION
According to the theory of Multinomial models
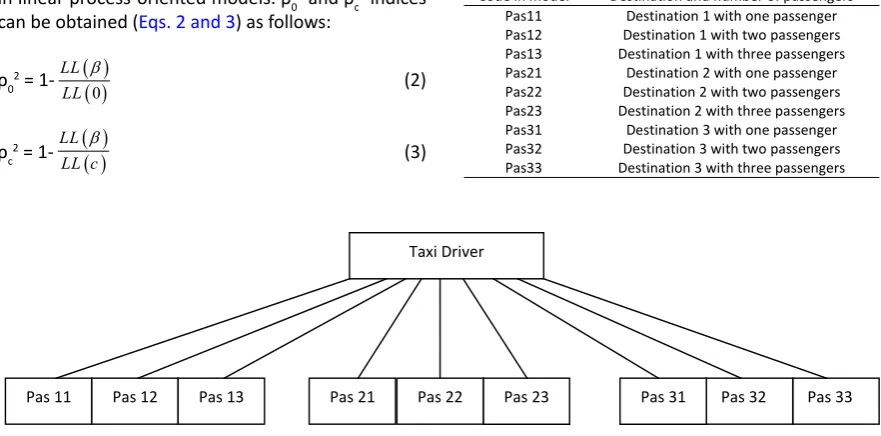
(Hensher et al., 2005) for calibration of best Multinomial Logit model (Fig. 1) for selecting destination and passenger, simultaneously, following structure is used.
Fig. 1, shows the structure of the Multinomial Logit model and in this model, choice has been made between 9 options of destination and passenger.
Table 1 shows how to code these options.
According to the theory of Nested Logit (Hensher
1
Fig. 1: Structure of multinomial logit model
Taxi Driver
Pas 11 Pas 12 Pas 13 Pas 21 Pas 22 Pas 23 Pas 31 Pas 32 Pas 33
Fig. 1. Structure of multinomial logit model
Table 1.Coding method for 9 option
Destination and number of passengers
Code in model
Destination 1 with one passenger
Pas11
Destination 1 with two passengers
Pas12
Destination 1 with three passengers
Pas13
Destination 2 with one passenger
Pas21
Destination 2 with two passengers
Pas22
Destination 2 with three passengers
Pas23
Destination 3 with one passenger
Pas31
Destination 3 with two passengers
Pas32
Destination 3 with three passengers
Pas33
72
et al., 2005) model for calibration of best Nested Logit
model to choose between destination and passenger simultaneously, the following structure is used, which is shown in Fig. 2. According to Fig. 2, in the first layer, each taxi driver can choose one of three destinations and in level two can choose between three options, traveling with 1, 2 or 3 passengers.
After examining the correlation between variables by Spss 23 software (IBM Corp, 2015) and elimination of high correlation variables, used variables in modeling showed acceptable correlation. In calibrated
model, best correlation happened between distance and time travel with value 0.33. The structure of the proposed models is shown in Fig. 1 and 2. Used
variables in the models are listed in Table 2.
After calibration of more than 100 model by Nlogit4 software (Greene, 2007) and examination the causal relationship between the variables and controlling correlations and significant between variables, the result of Multinomial Logit model are listed in Table
3 and result of Nested Logit model are presented in
Table 4.
2
Fig. 2. Structure of nested logit model
Destination Choice
Destination 1 Destination 2 Destination 3
1 passenger
2 passengers 3 passengers
1 passenger
2 passengers 3 passengers 3 passengers
2 passengers 1 passenger
Fig. 2. Structure of nested logit model
Table 2.Used variables in simultaneous model
Nature
Variable name in model
Variable
Order
Dummy
A
constant
1
Ratio Distance
Distance
2
Ratio
TT
Travel time
3
Ratio TP
searching time
4
Ratio
Fare
Fare
5
Dummy FT
Work time
6
Table 2. Used variables in simultaneous model
Table 3.Result of simultaneous multinomial logit model
Variables constant Work time Fare distance searching time Travel time
Passenger
and
Destination
Co
efficie
nt
T
‐
va
lu
e
Co
efficie
nt
T
va
lu
e
co
effi
cient
T
va
lu
e
co
effi
cient
T
va
lu
e
co
effi
cient
T
va
lu
e
co
effi
cient
T
va
lu
e
Pas11 ‐ ‐ 2.063 2.456 ‐ ‐ ‐ ‐ ‐2.220 ‐3.426 ‐1.204 ‐3.426
Pas12 ‐1.919 ‐1.723 0.803 3.088 ‐ ‐ ‐0.802 ‐3.312 ‐1.290 ‐3.415 ‐0.575 ‐1.983
Pas13 ‐0.727 ‐3.039 0.508 2.089 0.643 1.935 ‐ ‐ 2.028 5.992 ‐1.953 ‐2.517
Pas21 3.159 5.734 3.731 3.274 ‐ ‐ ‐ ‐ ‐2.855 ‐2.829 ‐0.099 ‐2.181
Pas22 4.026 4.064 1.050 2.291 ‐ ‐ ‐0.804 ‐2.278 ‐1.806 ‐5.006 ‐ ‐
Pas23 3.470 4.786 3.449 2.071 0.874 1.653 ‐ ‐ 0.965 2.517 ‐ ‐
Pas31 ‐5.429 ‐4.877 ‐ ‐ 0.958 2.216 ‐1.083 ‐4.096 ‐0.693 ‐5.006 ‐4.048 ‐2.014
Pas32 ‐4.111 ‐5.155 1.786 5.353 ‐ ‐ ‐2.104 ‐4.879 ‐0.745 ‐2.163 ‐0.676 ‐1.762
Pas33 ‐1.331 ‐4.789 0.970 2.014 1.018 4.855 ‐0.950 ‐3.501 ‐ ‐ ‐0.738 ‐2.346
73
Int. J. Hum. Capital Urban Manage., 4(1): 69-76, Winter 2019
After calibration of the Multinomial Logit model logarithmic value of probability function with zero coefficients, with constant parameters and with satisfied coefficient are -254.87, -251.55 and -164.89 respectively. According to Eqs. 2 and 3: ρc2=0.34,
ρ2=0.35.
After calibration of the Nested Logit model logarithmic value of probability function with zero coefficients, with constant parameters and with satisfied coefficient are -254.87, -251.55 and -140.62 respectively. According to Eqs. 2 and 3: ρc2=0.44,
ρ2=0.45.
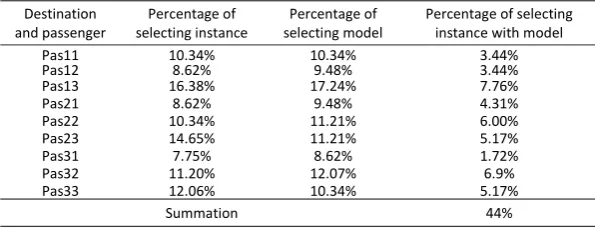
To validate the data from the questionnaire, 10% of questionnaires were isolated and validated. For validation, variables of 12 instances used in the utility function obtained from each model for each option, then by Eq. 1 and using utility function’s result, the possibility of each choice has been calculated. Then the biggest value shows the selected model. Finally, according to Table 5, the percentage of validation is calculated.
In Nested Logit models a variable named “total
logarithm’’ moves from low branches to high. The coefficient of this variable is IV coefficient that calculates and presents by computers. The coefficient limits shown in Eq. 6.
0 < IVPar.< 1 (6)
As it is seen this coefficient should be between zero and one, otherwise it would conflict the maximizing the Global Maximum Utility. To non-zero test of this coefficient, the T-test is used and to non-one test of it
Wald test uses as Eq. 7 (Hensher et al., 2005).
Wald – test = IVPar. 1 Std Error
− (7)
Where Standard Error (SE) is the standard error
factor of IV. In this study, it is assumed that one of the coefficients of IV to be normal to one and other IV coefficients calculated by a T-statistic and the Wald test. In Table 6, the standard error and the amount of IV for Nested Logit model are shown.
Wald test results show that the absolute values
Table 4.Result of simultaneous nested logit model
Variables constant Work time Fare distance searching time Travel time
Passenger
and
Destination Coefficie
nt T ‐ va lu e Co efficie nt T ‐ va lu e Co efficie nt T ‐ va lu e Co efficie nt T ‐ va lu e Co efficie nt T ‐ va lu e Co efficie nt T ‐ va lu e
Pas11 ‐ ‐ 1.901 2.957 ‐ ‐ ‐ ‐ ‐1.850 ‐3.576 ‐0.986 ‐3.143
Pas12 ‐1.652 ‐1.911 0.716 3.312 ‐ ‐ ‐ ‐ ‐0.990 ‐2.398 ‐0.452 ‐3.773
Pas13 ‐0.702 ‐5.462 0.500 3.236 0.580 1.719 ‐ ‐ 1.542 2.464 ‐0.325 ‐6.875
Pas21 2.690 2.116 2.751 1.857 ‐ ‐ ‐ ‐ ‐1.551 ‐5.320 ‐0.065 ‐1.932
Pas22 3.920 4.972 0.958 4.887 ‐ ‐ ‐0.734 ‐5.302 ‐1.496 ‐5.181 ‐ ‐
Pas23 2.341 3.553 2.230 3.454 0.794 1.886 ‐ ‐ ‐0.789 ‐3.761 ‐ ‐
Pas31 ‐1.160 ‐0.0926 ‐ ‐ ‐ ‐ ‐ ‐ ‐0.608 ‐3.446 ‐2.710 ‐3.350
Pas32 ‐4.006 ‐3.782 1.209 3.956 ‐ ‐ ‐1.950 ‐3.876 ‐0.714 ‐2.232 ‐ ‐
Pas33 ‐1.125 ‐2.295 0.927 4.115 ‐ ‐ ‐0.841 ‐3.792 ‐ ‐ ‐0.804 ‐3.493
Table 4. Result of simultaneous nested logit model
Table 5.Validation for simultaneous multinomial logit model’s data
Percentage of selecting
instance with model
Percentage of
selecting model
Percentage of
selecting instance
Destination
and passenger
3.44% 10.34% 10.34% Pas11 3.44% 9.48% 8.62% Pas12 7.76% 17.24% 16.38% Pas13 4.31% 9.48% 8.62% Pas21 6.00% 11.21% 10.34% Pas22 5.17% 11.21% 14.65% Pas23 1.72% 8.62% 7.75% Pas31 6.9% 12.07% 11.20% Pas32 5.17% 10.34% 12.06% Pas33 44% Summation
74 of the test numbers for destination 2 (-4.44) and Destination 3 (-2.79) is greater than 1.96, so they are significant. The Multinomial Logit model has ρc2=0.34 and ρ2=0.35 while the corresponding values
for the Nested Logit model are computed as ρc2=0.44
andρc2=0.45. The result obtained through validation
period indicates that the data applied for simulation has a 44% of agreement with those of the real data in which they have been selected randomly. The
result of Wald test demonstrates that the absolute of
numbers derived from this test for the destinations 2 and 3 (-4.44 and -2.79 respectively) are higher than 1.96 which is significant. The constant value in the model represents the effect of variables which ignored in the modeling. After investigation of the cause relation and also the correlation, the variable of travel time has the least correlation with the work time variable as 0.04 and the most correlation with the fare variable as 0.48 in which the minus value implies the fact that with decreasing in travel time, the taxi driver tendency increases. In a similar way, the searching time variable has the least and the most correlation with those of distance variable about 0.02 and the work time variable about 0.28, respectively. The minus sign demonstrates as the searching time decreases the driver tendency for selecting numbers of 1 and 2 passengers’ increases regardless considering the destination. In other words, this status is valid for all conditions. The distance variable after assessing the cause and caused relation and correlation analysis were found to be the least correlated with the searching time variable about 0.02 and be the most correlated with workfare variable about 0.45. Regarding the minus sign, it can be inferred that with decreasing in the distance, drivers show much tendency for selecting of passenger and destination. The fare variable is correlated with work time variable about 0.02 and with travel time variable about 0.48 in which they represent the lowest and the highest values. The positive sign reveals that with increasing in the fare, drivers are encouraged to choose destination and
passenger. The work time variable has the lowest and the highest correlation with the variables of fare (equal to 0.02) and searching time (equal to 0.28), respectively. The positive sign indicates that the full-time drivers have much willing to do this work.
CONCLUSION
The main purpose of the current study was to find key factors and the most effective parameters in the selection of destination and passenger by irregular taxi drivers. In this research, an attempt was made to investigate the behavior of taxi drivers in the selection of passenger and destination from a constant point. In this regard, two models of Logit including Multinomial and Nested have been taken under consideration. The input data employed for this study consist of a 7-day field data collected through an oral review procedure in Tehran, Iran, in summer 2016. The main findings of this study can be summarized as follows. 1) Generally, it can be concluded that the Nested Logit model has a better performance compared with the Multinomial Logit model that can be related to the nature of these models. The Nested Logit model has ρ2=0.45 higher
than the corresponding value for Multinomial Logit model about ρ2=0.35 which proves the
claim. 2) Regarding the applied models, the three variables of searching time, work time and travel time were selected as the most important and effective parameters in the selection of destination and passenger by drivers. These variables were investigated in the developed models independently or simultaneously where had the great effect on the improvement of the likelihood function in the selection of drivers. The coefficient of these variables for different drivers and selecting of passenger and destination showed different values. 3) The results of main variables in the selection of drivers are as follow: a) it is found that with increasing in fare, drivers are much interested in doing this work. b) With decreasing in searching time the drivers prefer to select one or two passengers. c) Drivers who are taken this career as a full-time job are more interested in doing this work. d) Drivers prefer to drive for shorter distance. e) Drivers have more tendencies when the travel time is decreased (shorter travel time is desirable). According to the results of this study, it can be derived that with decreasing in searching time for passenger selection, drivers are
Table 6.The Standard error and IV of nested logit simultaneously model
SE
IV
‐
1.00000
Destination 1
0.07731 0.65603
Destination 2
0.08771
0.75450
Destination 3
Note: Wald ‐ testdes1= ‐4.44, Wald ‐ testdes1 = ‐2.79
75
Int. J. Hum. Capital Urban Manage., 4(1): 69-76, Winter 2019
much interested in doing this job. Moreover, it was found that taking this job as a full-time work is much desirable for drivers. Therefore, accurate planning is needed for this work to response to these two requirements accordingly. In this regard, the Uber Transport Company can be mentioned which developed a software. Using this software, there is no need to search for the passenger by drivers in which it decreases the searching time of drivers. Furthermore, the driver can declare his availability for the passenger at any time of the day and night gaining this software. Therefore, there will be no limitation on time for drivers. In cases of presence of such companies in the city or if the government could supply such systems to the drivers, the choice of this work for drivers would be promising and encouraging.
ACKNOWLEDGEMENT
he authors would like to thank the anonymous reviewers for their valuable comments and suggestions to improve the quality of the paper. The writers are very appreciated and thankful to the editorial office and the committee members of IJHCUM for their efforts and time during the reassessment procedure.
CONFLICT OF INTEREST
The author declares that there is no conflict of interests regarding the publication of this manuscript. In addition, the ethical issues, including plagiarism, informed consent, misconduct, data fabrication and/ or falsification, double publication and/or submission, and redundancy have been completely observed by the authors.
REFERENCES
Amat, C.; Ortigosa, J.; Estrada, M.; i Bertran, C.A.; Marin, J.O.; Romeu, M.E., (2014). Assessment of the taxi sector efficiency and profitability based on continuous monitoring and methodology to review fares. Transp. Res. Board., Washington, DC.
Bacache-Beauvallet, M.; Janin, L., (2012). Taxicab license value and market regulation. Transp. Policy. 19(1): 57-62 (6 pages). Cai, H.; Zhan, X.; Zhu, J.; Jia, X.; Chiu, A.S.; Xu, M., (2016).
Understanding taxi travel patterns. Physica A: Stat. Mech. P., 457: 590-597 (8 pages).
Commission for Taxi Regulation (Ireland), (2005). National Review of Taxi, Hackney and Limousine Services. Transport Research and Innovation Monitoring and Information System (European
Commission).
D.T.A., (1999). Review of the Western Australian Taxi Industry. Department of Transport, Australia.
Fu, L., (2003). Analytical model for paratransit capacity and quality-of-service analysis. Transportation Research Record: J. Transp. Res. Board, 1841: 81-89 (9 pages).
Gholami, A.; Taghizadeh, Y.; Tian, Z., (2014). Classification of taxi khattee (jitney) lines based on topography and line cost indices. Transportation Research Part A: Policy and Prac., 59: 239-249 (11 pages).
Greene, W.H., (2007). Nlogit 4.0: Reference Guide. Econometric software, Inc., New York.
Hensher, D.A.; Rose, J.M.; Greene, W.H., (2005). Applied choice analysis: a primer. Cambridge University Press.
Hung, W.; Cheung, C.; Lee, C.; Cheung, K., (2006). A Report on Taxi Services (Market Competition) Policy Review. The Hong Kong Polytechnic University, Public Policy Research Institute. IBM Corp, (2015). IBM SPSS Statistics for Windows, Version 23.0.
Armonk, NY: IBM Corp.
Louviere, J.J.; Hensher, D.A.; Swait, J.D., (2000). Stated choice methods: analysis and applications. Cambridge university press.
Prentice, B.E.; Mossman, C.; van Schijndel, A., (2010). Taxi fares and the capitalization of taxi licenses. In Proceedings Issue: 45th Annual Meeting, 769: 783 (15 pages).
Pricing, I.; Tribunal, R., (1999). Review of the Taxi Cab and Hire Car Industries. Independent Pricing and Regulatory Tribunal. Public Carriage Office, (2003). Taxi Assessments: General
Overview.
Salanova Grau, J.M.; Estrada Romeu, M.Á., (2015). Agent based modeling for simulating taxi services [case study in Barcelona]. Procedia Comput. Sci., 52: 902-907 (6 pages).
Schaller, B., (2006). The New York City taxicab fact book (Technical report). Schaller Consulting, 94 Windsor Place, Brooklyn, NYC, NY, US.
The Toronto Task Force to Review the Taxi Industry, (1998). Report to Review the Toronto Taxi Industry.
Whalen, P.; Kelly, K; John, M., (1999). Barwood CNG Cab Fleet Study: Final Results (No. NREL/TP-540-26035). National Renewable Energy Lab., Golden, CO (US).
Wong, K.I.; Wong, S.C.; Yang, H., (2001). Modeling urban taxi services in congested road networks with elastic demand. Transportation Research Part B: Meth., 35(9): 819-842 (24
pages).
Yang, H. and Wong, S.C., 1998. A network model of urban taxi services. Transportation Research Part B: Meth., 32(4): 35-246 (12 pages).
Yang, H.; Wong, S.C.; Wong, K.I., (2002). Demand–supply equilibrium of taxi services in a network under competition and regulation. Transportation Research Part B: Meth., 36(9):
799-819 (21 pages).
Yang, H.; Fung, C.S.; Wong, K.I.; Wong, S.C., (2010). Nonlinear pricing of taxi services. Transportation Research Part A: Policy and Prac., 44(5): 337-348 (12 pages).
76 COPYRIGHTS
Copyright for this article is retained by the author(s), with publication rights granted to the IJHCUM Journal. This is an open-access article distributed under the terms and conditions of the Creative Commons Attribution License (http://creativecommons.org/licenses/by/4.0/).
HOW TO CITE THIS ARTICLE
Edrisi, A., Javanbakht, N., Ganjipour, H., (2019). Modeling the behavior of disordered taxi drivers of Tehran for choosing passenger and destination. Int. J. Hum. Capital Urban Manage., 4(1): 69-76.
DOI:10.22034/IJHCUM.2019.01.08