http://www.sciencepublishinggroup.com/j/ijber doi: 10.11648/j.ijber.20170605.12
ISSN: 2328-7543 (Print); ISSN: 2328-756X (Online)
A Study on the Optimization of Tax Structure from the
Perspective of Economic Growth
Han Wu
1, Ke Gao
1, Ming Chen
21The School of Public Finance and Taxation, Central University of Finance and Economics, Beijing, China 2
Center for China Fiscal Development, Central University of Finance and Economics, Beijing, China
Email address:
[email protected] (Han Wu), [email protected] (Ke Gao), [email protected] (Ming Chen)
To cite this article:
Han Wu, Ke Gao, Ming Chen. A Study on the Optimization of Tax Structure from the Perspective of Economic Growth. International Journal of Business and Economics Research. Vol. 6, No. 5, 2017, pp. 93-99. doi: 10.11648/j.ijber.20170605.12
Received: August 10, 2017; Accepted: September 6, 2017; Published: September 14, 2017
Abstract:
The institution supply is an important dimension of China's supply-side reform, in which the reform and optimization of tax system structure is an important measure to promote economic growth. This paper first reviewed the literatures about how the tax structure influences economic growth. Then, this paper used the reform of Chinese tax system as a starting point for the study, measured nearly 20 years of HP and HHI index to reflect the changes in tax structure, and analyzed the difference between the direct tax and the indirect tax on the economic growth. Finally, on the basis of the empirical conclusion of this paper, it put forward the corresponding policy suggestions.Keywords:
Tax Structure, Economic Growth, Chinese Tax System1. Introduction
In the context of the "new normal" of the economy, the Outline of China’s 13th Five-Year Plan of puts forward that in accordance with the requirements of optimizing the tax structure, stabilizing the macro tax burden and promoting tax administration according to law to make sure that the tax law should be fully implemented, and the establishment of a tax science, structural optimization, legal sound, standardized and fair, collection and management of modern tax system, and gradually increase the proportion of direct tax. China's entry into the "three-stage superposition" of the new period, the tax structure adjustment and optimization, especially the indirect tax and direct tax ratio, the economic stability and sustainable development is of great significance. Jia Kang put forward that the direct tax and indirect tax imbalance is not conducive to economic and social transformation. China has implemented an indirect tax-based tax system for a long time. How to fundamentally adjust the tax structure and promote the economy based on the current status of over taxation in circulation has become a major problem [1].
2. Literature Review
negatively correlated with economic growth [5]. Subramanya Venkataraman and Arabi Urmi (2017) used the time series data of 1977-2015 in India to study the relationship between direct tax, indirect tax and long-term economic growth in India which concluded that in the long term, the direct tax has no significant effect on personal income tax growth; indirect tax and consumption tax has no significant impact on economic growth; tariffs and economic growth has a significant positive correlation [6].
Chinese scholars Xia Jie-chang and Wang Xin-li (2003) analyzed China's indirect tax-based tax structure. They argued that the tax structure has a relatively limited role in stabilizing the economy and has suppressed consumption and investment [7]. Chang Shi-wang, Han Ren-yue (2015) measured the optimal tax structure of 31 provinces in China from 1996 to 2012 with the aim of maximizing economic growth. They calculated the efficiency of the region's existing tax structure. The conclusion is that the structural elasticity of taxation in 25 regions is negative, and the proportion of indirect taxes should be gradually reduced to promote economic growth. Chinese current tax structure has exacerbated regional economic disparities [8]. Ma Hai-tao, Duan Qi (2016) used the VAR model to analyze the economic efficiency of direct and indirect taxes. They found that Chinese direct tax economic efficiency is higher than the indirect tax economic efficiency [9].
From the existing literature, most of the scholars analyzed the impact of the total economic growth from the perspective of the amount of direct tax and indirect tax. However, there are few literatures analyzing the mechanism of direct tax and indirect tax influencing the economic growth. Taxation has a distorted price in the process of levying, and the effects of direct and indirect taxes on the nominal economic growth and actual economic growth are not the same. The direct tax is generally taxed according to the legal person, and the influence on price is relatively small while the indirect tax has a great influence on the economic growth through distorting the price. This paper revises the empirical study on the impact of China's tax structure on economic growth, and the relationship
between structure and economic growth is reexamined.
3. An Analysis of the Structure of
Chinese Tax System
Since the founding of New China, China has experienced five major changes in the proportion of direct tax revenue and indirect tax revenue. In 1950, there were 16 kinds of tax in China. Indirect tax only includes the goods tax, salt tax, customs duties and industrial and commercial tax. The difference between the income of the direct tax and indirect tax revenue was not significant. In 1958, after the tax reform, indirect tax revenue rose rapidly, the initial formation of China's indirect tax became the main body of the tax structure; after the 1973 tax reform, the proportion of China's indirect tax further increased from 78.9% in 1959 to 81.9%; the proportion of direct tax increased to 38.9% in 1985; in 1994, China introduced the tax reform system, and the proportion of indirect tax was increased again due to the weak growth of corporate income tax paid by state-owned enterprises and collective enterprises. From the perspective of welfare economics, combined with the development process of the reform of China's tax system, the tax structure with the simple direct tax as the main body at the beginning of the founding of the People's Republic of China focuses on the fair dimension of welfare economics; the tax structure of the second stage indirect tax, focusing on the efficiency of welfare economics dimensions; the tax structure since the tax-share system, taking into account the efficiency and fairness at the same time, the adjustment of the tax structure to focus on taxpayers more freedom of choice. From fair to efficient, and then to the free tax reform process is the embodiment of economic development. In order to analyze the influence of tax structure on economic growth, this paper needs to classify the direct tax and indirect tax, and refer to Li Hua, Fan Li-ming (2015), the current tax levied in China in accordance with the direct tax and indirect tax are showed in Table 1 [10].
Table 1. Tax classification table.
Classification criteria Taxes included
Indirect tax Value-added tax, consumption tax, business tax, tariff, vehicle purchase tax, tobacco tax, city maintenance and construction tax, resource tax, environmental tax (will be levied)
Direct tax
Personal income tax, corporate income tax, payroll tax (social insurance contribution), property tax, Urban land use tax, travel tax, land value added tax, deed tax, stamp duty, arable land occupation tax, Banquet tax (canceled), agricultural tax (canceled), fixed asset direction adjustment tax (suspended), ship tons tax
According to this classification standard, the proportion of direct tax and indirect tax in China from 1997 to 2016 is shown in Table 2. On the basis of the payroll tax (social insurance contribution), it can be seen from Table 2 that the proportion of indirect tax in China's total tax revenue has been declining in the past 20 years, and the proportion of direct tax has increased steadily.
The tax structure is usually reflected by the annual change in the tax structure and the concentration of the tax system, respectively, from the Hymer Pashigian's Mobility Index and
the HHI (Herfindahl Hirschman Index). In the study of the direct tax and the proportion of indirect tax changes, t represents the year, Rd,t represents the share of the direct tax t
year in the total tax revenue; Ri,t represents the share of
indirect tax t year in total tax revenue.0≤Rd,t, Ri,t≤1,and
Rd,t+ Ri,t=1. HP Mobility Index∆Rt=|Rd,t-Rd,t-1|+|Ri,t-Ri,t-1|,
When the HP index is larger, the greater the change in the tax structure, the smaller the HP index, the smaller the change in the tax structure. On this basis, the HHI index S=R2d,t+ R
2 i,t.
of the tax structure is, the smaller the HP index is, the smaller the tax structure is. According to the above algorithm, the HP
index and the HHI index (see Table 3 and Table 4) of the change of China's tax structure in 1997-2016 are obtained.
Table 2. Chinese direct tax and indirect tax revenue in 1997 - 2016 unit: %.
Year 1997 1998 1999 2000 2001 2002 2003 2004 2005 2006
The proportion of direct tax 35.94 34.98 35.31 36.05 40.43 42.18 39.89 39.47 40.83 42.33
The proportion of indirect tax 67.02 69.06 63.88 60.96 53.95 57.92 59.17 57.65 55.69 54.18
Year 2007 2008 2009 2010 2011 2012 2013 2014 2015 2016
The proportion of direct tax 44.92 45.71 45.69 44.63 45.92 47.11 49.38 55.21 58.44 43.76
The proportion of indirect tax 50.6 50.34 50.39 51.56 49.88 48.41 46.34 44.79 41.56 56.24
Notes: 1. Source: According to the National Bureau of Statistics 1998 - 2017 data, "China Tax Yearbook" 1997 - 2014 annual data calculated.
2. "Taxation of China Tax Yearbook" The tax revenue data sheet "Other taxes" as a result of the tax is not clear, so it is not divided. In order to keep the data caliber consistent, the stamp duty on securities transactions will be classified as stamp duty.
Table 3. 1997 - 2016 Chinese Tax Structure HP Index.
Year 1997 1998 1999 2000 2001 2002 2003 2004 2005 2006
HP Index 0.032 0.019 0.007 0.015 0.088 0.035 0.046 0.008 0.027 0.03
Year 2007 2008 2009 2010 2011 2012 2013 2014 2015 2016
HP Index 0.052 0.016 0 0.021 0.023 0.024 0.045 0.043 0.056 0.038
Source: Measured according to National Bureau of Statistics 1997 - 2016.
Table 4. 1997 - 2016 Chinese Tax Structure HHI Index.
Year 1997 1998 1999 2000 2001 2002 2003 2004 2005 2006
HHI Index 0.54 0.545 0.543 0.539 0.518 0.512 0.52 0.522 0.517 0.512
Year 2007 2008 2009 2010 2011 2012 2013 2014 2015 2016
HHI Index 0.505 0.504 0.504 0.506 0.503 0.502 0.5 0.5 0.504 0.508
Source: Measured according to National Bureau of Statistics 1997 - 2016.
Currently, the focus and difficulties of Chinese tax reform are on the direct tax, and the ratio of direct and indirect taxes is still uncoordinated. If the payroll tax is not considered (social security contributions), 70% of Chinese current tax revenue comes from the indirect tax, one of the characteristics of indirect tax is that it can pass the tax amount through the commodity price channels which have three elements: profits, interests, and tax. China's current commodity production and circulation links, the taxes involved are mostly indirect taxes and the price when the middle of the larger tax, so as the main source of tax revenue in China has a greater role in the distortion of the price, so the analysis of the price factor before and after the tax structure the impact on economic growth is necessary.
4. Empirical Analysis
As a systematic factor, China's current tax structure influences the economic growth mainly by influencing the price. If the price can promote the optimal allocation of resource allocation, it will be able to accurately reflect the market supply and demand situation, but also reflects the allocation of resources. Therefore, considering the price factors, when it comes to the economic growth, firstly, distinguish between nominal growth and real growth are important; in considering the impact of economic growth, the core elements, should also distinguish between nominal and actual amount. In this paper, the nominal variables and the real variables were used to measure the difference between the price factors before and after the tax structure on the
economic growth of the differences. A. Model building
This paper introduces tax variables based on the Cobb-Douglas production function, Y=F (A, L, K)=ALαKβ. Where Y is the economic growth variable, L is the labor variable, K is the capital variable, F is the institutional variable, A is the technological progress variable.
Considering the factors of tax structure, assume that the tax structure is in the form of a constant, and Each production cycle is born out of the Cobb-Douglas production function, then there is equation (1), where e is a natural logarithm, db is the proportion of the direct tax revenue to the total tax revenue, ib is the proportion of the indirect tax revenue to the total tax revenue.
Y=F (A, L, K)=ALαKβe db/ib (1)
Equation (4-1) is linearly developed to give the equation (2).
LNY=LNA + αLNL + βLNK + db/ib (2)
paper based on the tax structure of Chang Shiwang, Han Renyue as a measure of the structure of the tax system [8], which is derived from Table 2 for the year 1996 to 2015. The use of the direct tax ratio / indirect tax ratio (db / ib) as a measure of the tax structure The value of the direct tax proportion / indirect tax is defined as one of the variables that explain economic growth and is converted to equation (3) on the basis of equation (2), where a0 is constant, and a1, a2, a3 is
the elastic coefficient of each variable to economic growth rate, and ε is the residual term.
LNY =a0+ a1LNL + a2LNK + a3(db/ib)+ε (3)
B. Variables and data
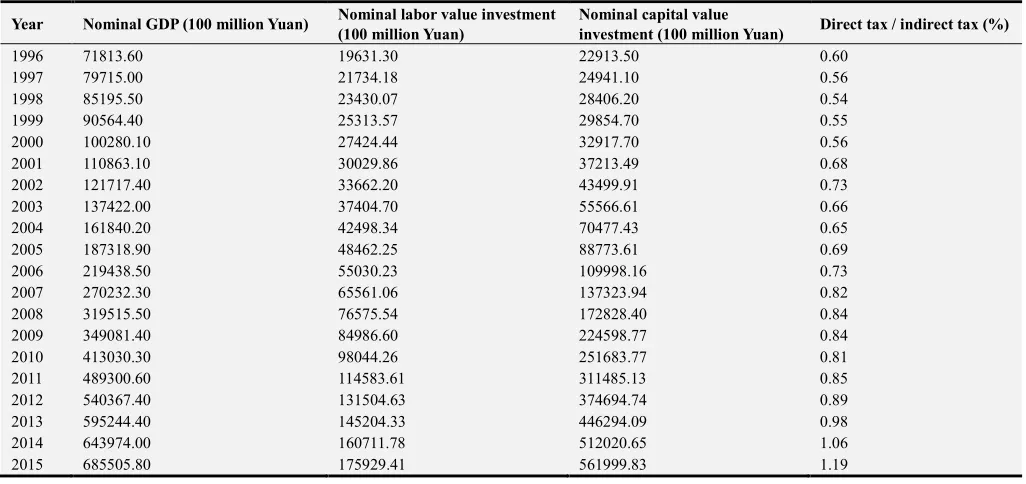
This paper used the annual nominal GDP as the Economic Growth Variables Y, and the labor force variable L is the total number of national employed persons and the nominal per capita disposable income. This variable can reflect the value of labor in economic growth. The capital variable K is the nominal value of the total investment in fixed assets. This variable reflects the value of capital investment in the year.
Table 5. Standard Table of Variables for 1996 – 2015.
Year Nominal GDP (100 million Yuan) Nominal labor value investment (100 million Yuan)
Nominal capital value
investment (100 million Yuan) Direct tax / indirect tax (%)
1996 71813.60 19631.30 22913.50 0.60
1997 79715.00 21734.18 24941.10 0.56
1998 85195.50 23430.07 28406.20 0.54
1999 90564.40 25313.57 29854.70 0.55
2000 100280.10 27424.44 32917.70 0.56
2001 110863.10 30029.86 37213.49 0.68
2002 121717.40 33662.20 43499.91 0.73
2003 137422.00 37404.70 55566.61 0.66
2004 161840.20 42498.34 70477.43 0.65
2005 187318.90 48462.25 88773.61 0.69
2006 219438.50 55030.23 109998.16 0.73
2007 270232.30 65561.06 137323.94 0.82
2008 319515.50 76575.54 172828.40 0.84
2009 349081.40 84986.60 224598.77 0.84
2010 413030.30 98044.26 251683.77 0.81
2011 489300.60 114583.61 311485.13 0.85
2012 540367.40 131504.63 374694.74 0.89
2013 595244.40 145204.33 446294.09 0.98
2014 643974.00 160711.78 512020.65 1.06
2015 685505.80 175929.41 561999.83 1.19
Source: China Statistical Yearbook (2016) and the author projections, the direct tax / indirect tax value of the decimal point after the two.
In the time series regression process, in order to avoid pseudo-regression, we need to test the unit root for each variable. In this paper, the unit mean value of LNY, LNL, LNK and db / ib were tested. The results showed that the original sequence of the four variables rejected the original hypothesis at the 5% significance level, so the sequence was non-stationary. The sequence after the stepwise difference treatment is a stationary sequence at the significance level of 5%, so each variable obeys the second order stationary, so it may have the co integration relation.
Using the above nominal variable, the OLS regression is performed using the econometric equation of equation (3) in the Stata 12 environment. The results of the co-integration
regression equation are shown in equation (4).
LNY =1.660322 + 0.691248LNL + 0.280568LNK - 0.223312 (db/ib) (4)
The specific regression results are shown in Table 6, adjusted R2 value of 0.999001,the linear fit of the equation is very good. LNG, LNK, db / ib t statistics are greater than 5% critical level, indicating that the estimated value of its parameters is significant. An F value of 6336.662, indicating a higher degree of model fits. DW value is close to 2, indicating that the residual sequence of the model has no autocorrelation.
Table 6. Nominal variable regression results.
Variable Regression coefficients Standard deviation T value P value
C 1.660322 0.605572 2.741740 0.0145
LNL 0.691248 0.164542 4.201029 0.0007
LNK 0.280568 0.102106 2.747804 0.0143
db/ib -0.223312 0.095442 -2.339763 0.0326
R2 0.999159 Adjust R2 0.999001
F value 6336.662 DW value 1.234086
P value 0.000000 Number of samples 20
Table 7. Nominal variable regression residual unit root test.
T value P value
ADF test statistic -3.53549 0.0014
Check the critical value
1% -2.69977 -
5% -1.96141 -
10% -1.60661 -
Source: Stata 12 Statistics Finished.
In this paper, the Engle-Granger method is used to
estimate the residual term of the long-term equilibrium equation estimated by OLS regression method. The results are shown in Table 7, and the P value is significant at 1% level. The variables have co integration relationship, and did not produce pseudo-regression results.
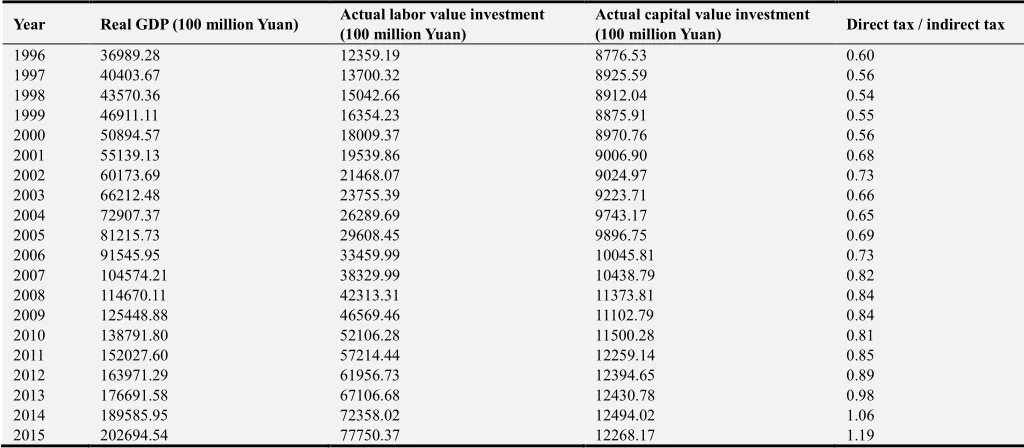
Taking into account inflation and other factors, this paper measures the real GDP, labor value input and capital value investment after 1990, the actual value of the specific variables were shown in Table 8.
Table 8. Table of Actual Values for Variables for 1996 – 2015.
Year Real GDP (100 million Yuan) Actual labor value investment (100 million Yuan)
Actual capital value investment
(100 million Yuan) Direct tax / indirect tax
1996 36989.28 12359.19 8776.53 0.60
1997 40403.67 13700.32 8925.59 0.56
1998 43570.36 15042.66 8912.04 0.54
1999 46911.11 16354.23 8875.91 0.55
2000 50894.57 18009.37 8970.76 0.56
2001 55139.13 19539.86 9006.90 0.68
2002 60173.69 21468.07 9024.97 0.73
2003 66212.48 23755.39 9223.71 0.66
2004 72907.37 26289.69 9743.17 0.65
2005 81215.73 29608.45 9896.75 0.69
2006 91545.95 33459.99 10045.81 0.73
2007 104574.21 38329.99 10438.79 0.82
2008 114670.11 42313.31 11373.81 0.84
2009 125448.88 46569.46 11102.79 0.84
2010 138791.80 52106.28 11500.28 0.81
2011 152027.60 57214.44 12259.14 0.85
2012 163971.29 61956.73 12394.65 0.89
2013 176691.58 67106.68 12430.78 0.98
2014 189585.95 72358.02 12494.02 1.06
2015 202694.54 77750.37 12268.17 1.19
Source: China Statistical Yearbook (2016) and the author projections, the direct tax / indirect tax value of the decimal point after the two.
In this paper, the unit values of LNY, LNL, LNK and db / ib were tested. The results showed that the original sequence of the four variables rejected the original hypothesis at the 5% significance level, and the sequence was non-stationary. The sequence after the stepwise difference treatment is a stationary sequence at the significance level of 5%, so each variable obeys the second order single product, so it may have the co integration relation.
Using the above-mentioned actual value variables, OLS regression was performed using the equation of equation (3) in the Stata 12 environment. The results of the co integration regression equation are shown in equation (5).
LNY = 0.477965 + 0.879294LNL + 0.189421LNK + 0.047981 (db/ib) (5)
Specific regression results shown in Table 9, adjust the R2 value of 0.999943, the linear fit of the equation is high. LNG, LNK, db / ib t statistics are greater than 5% critical level, indicating that the estimated value of its parameters is significant. An F value of 105067.8, indicating a higher degree of model fits. DW value is close to 2, indicating that the residual sequence of the model has no autocorrelation.
Table 9. Real variable regression results.
Variable Regression coefficients S.e. T value P value
C 0.477965 0.232682 2.054159 0.0567
LNL 0.879294 0.008975 97.97523 0.0000
LNK 0.189421 0.033455 5.662002 0.0000
db/ib 0.047981 0.015405 3.114554 0.0067
R2 0.999944 Adjust R2 0.999934
F value 96003.37 DW value 1.460162
P value 0.000000 Number of samples 20
Source: Stata 12 Statistics Finished.
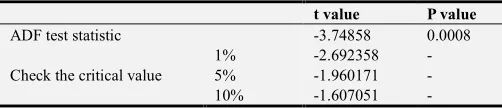
For the test of the real variables, the Engle-Granger method is used to estimate the residual term of the long-term
significant at the 1% level. The variables have a co integration relationship and do not produce pseudo-regression results.
Table 10. Real variable regression residual unit root test.
t value P value
ADF test statistic -3.74858 0.0008
Check the critical value
1% -2.692358 -
5% -1.960171 -
10% -1.607051 -
Source: Stata 12 Statistics Finished.
From the result of the regression of the nominal variable (4), the growth rate of labor value investment increased by 1%, the economic growth rate increased by 0.69%; the capital value input growth rate increased by 1%, the economic growth rate increased by 0.28%; direct tax / indirect tax reflects the change in tax system, when its change 1%, the economic growth rate fell 0.22%. The results show that the increase in the proportion of direct tax does not eliminate the price factor, which may be due to the fact that the enterprise income tax and personal income tax are the main ones in the direct tax, and the enterprise income tax and personal income tax are affected by the price.
From the regression of the real variable (5), labor value growth rate increased by 1%, economic growth rate increased by 0.88%; capital value growth rate increased by 1%, economic growth rate increased 0.19%; direct tax / indirect tax ratio of 1%, the economic growth rate increased by 0.05%. The measurement results show that the increase in the proportion of the direct tax burden on the labor force is reflected in the elimination of the price factor and the elimination of the monetary illusion, which contributes to the increase in the working hours of the labor force to a certain extent. With the decline in the proportion of indirect taxes, the cost of consumption and the use of goods in production and life are decreasing. From the perspective of capital, the increase in the proportion of direct taxes may be due to the expansion of the direct tax base represented by corporate income tax as the representative of the decline in the proportion of indirect taxes to reduce the enterprise in the product circulation link tax burden, enterprises can be in a better economic environment, so the direct tax / indirect tax changes in the economic growth rate has a positive impact.
The difference between the nominal variable and the real variable reflects that the tax structure has a high proportion in the price structure. The tax structure with the indirect tax as the main body promotes the increase of the nominal value of the economic growth. However, from the situation that the actual value reflects, taxation in the process of commodity goods flow, the role of distortions on the price, increasing the cost of commodity goods turnover.
5. Conclusions and Suggestion
In the context of the current "supply side" fiscal reform, the direction of Chinese tax structure optimization is to promote the tax system from the single tax structure with
indirect tax as the main body to the direct tax and indirect tax structure to promote the human capital elements, material capital Elements of the effective allocation, efforts to reduce corporate tax burden. Based on the above empirical results and the current trend of reform, this paper puts forward some policy suggestions from the perspective of direct tax and indirect tax.
A. Optimize the design of indirect taxes, and effectively reduce the survival costs of enterprises and individuals.
At present, the tax structure with indirect tax as the main body still has a certain role in promoting the economy, but it has strong regressive nature, and the indirect tax is more taxable in the production process. The price can hardly promote the effective allocation of resources. Indirect tax optimization should be reflected in the following aspects: First, continue to implement the comprehensive reform of "replacing business tax with value-added tax". The reform and value-added tax deduction chain could avoid repeated taxation effectively. The current VAT levy rate and tax rate level are still large, including 3%, 6%, 11%, 17% four categories. The gap between the tax burden in the industry is large, the value-added tax rate and tax rate level to be reduced, followed by the current tax system on the definition of modern service industry is not clear enough to further the full implementation of the "battalion" process to be improved; second, improve the value-added tax, consumption tax and other indirect tax legislation, rose to a high tax law. In the current tax system in China, the tax laws that belong to the legal form are only the Individual Income Tax Law of the People's Republic of China, the Enterprise Income Tax Law of the People's Republic of China, the Travel Tax Law of the People's Republic of China, the Environmental Protection Tax Law of the People's Republic of China, The People's Republic of China tax collection management law, involving specific taxes legislation only the first four, involving mostly direct tax. Tax system Legislation level can regulate tax collection and management, improve corporate and individual tax compliance, and reduce tax losses; third, the taxation scope of the consumption tax needs to be expanded. In addition to the current consumption tax scope, other high-end consumer goods should be included, such as luxury bags, mobile phones, computers, cameras, so that the associated high-income people in fact to include high consumption tax price.
B. Deepen the personal income tax system.
it should be considered to gradually expand the scope of the personal income tax.
C. Optimize the design of corporate income tax system. The current "supply side reform" put forward "mass entrepreneurship and innovation". From the government point of view, entrepreneurship and business innovation need to provide high-quality soil, just as "the first spring after the harvest", in the early stages of business growth, for non-resident enterprises, qualified small-scale low-profit enterprises, the state needs to focus on supporting high-tech enterprises. There should be a corresponding corporate income tax incentives, focusing on future tax revenue growth, and corporate income tax system can be based on industry differences, differences in profits, factors and other factors to consider, to encourage enterprises to eliminate inferior products or investment goods in the process of accelerated depreciation in the demand for technological breakthroughs, to explore the growth potential of enterprises, for enterprises in the field of R & D undistributed profits in the tax base to a greater degree of credit to promote business research and development.
E. Further implementation of social security "fee to tax". According to the international experience, the British, the United States, Japan, France, social security contributions is an important part of its direct tax, and social security "tax reform", which is both a good organization of fiscal revenue, but also can play a better adjustment of income distribution uneven problem, could regulate Chinese current social security system. Social security "tax reform" can be considered to offset the inflation to bring the actual income of the damage.
F. Introduce the Inheritance tax to adjust the wealth gap among families.
Based on the goal of fair multi-dimensional expansion, China should levy inheritance tax as soon as possible. Fairness includes not only fairness of results, but also fairness of chance and process. Inheritance tax is a direct tax, which is the most cost-effective and equitable process.
Inheritance tax is an important tool for the government to promote the process of marketization.
References
[1] Jia Kang, Cheng Yu. The current tax system and the new issue of a new round of tax reform [J]. Financial Market Research, 2015, 01: 4-11.
[2] Cremer H, Pestieau P, Jean-Charles Rochet. Direct Versus Indirect Taxation: The Design of the Tax Structure Revisited [J]. International Economic Review, 2001, 42(3): 781-799. [3] Branson J, Lovell C A K. A Growth Maximising Tax Structure
for New Zealand [J]. International Tax & Public Finance, 2001, 8(2): 129-146.
[4] Jens Arnold. Do Tax Structures Affect Aggregate Economic Growth?: Empirical Evidence from a Panel of OECD Countries. OECD Economics Department Working Papers, No. 643, 2008.
[5] Edame G E, Okoi W W. The Impact of Taxation on Investment and Economic Development in Nigeria [J]. British Journal of Surgery, 2014, 65(9): 597-600.
[6] Venkataraman S, Urmi A. The impact of taxation on economic growth in India: A disaggregated approach using the ARDL bounds test to co-integration [J]. 2017(1): 19-21.
[7] Xia Jie-chang and Wang Xin-li. The Negative Effects of Macro Tax Burden and Tax Structure on Economic Growth [J]. Tax Research, 2003, (4): 13-17.
[8] Chang shi-wang, Han ren-yue. The optimization of tax system structure from the perspective of economic growth [J]. Tax Research. 2015 (1): 54-57.
[9] Ma Hai-tao, Duan Q. Reconstruction of Tax System in the Background of Financial Reform in "Supply Side" [J]. Journal of Suzhou University (Philosophy and Social Sciences), 2016, (3): 100-109.