Selection of the parental combinations through multivariate
analysis in dessert banana genotypes for hybridization
programme
Saudamini Swain
1, Partha Sarathi Munsi
2, Swarnalata Das*
3and Prabhu Charan Lenka
1 1Department of Fruit Science, OUAT, Bhubaneswar, Odisha, India2Department of Horticulture, Visva-Bharati, West Bengal, India
3Department of Plant breeding & Genetics, OUAT, Bhubaneswar, Odisha, India
*Corresponding author e-mail: [email protected]
Paper No. 555 Received: 17-02-2016 Accepted: 19-03-2017
Abstract
In the present investigation 22 dessert banana genotypes were evaluated under coastal plain zone of Odisha during the year 2013-14 and 2104-15 in a randomized block design with three replications. Observations were recorded on growth parameters and yield attributing traits. Analysis of variance indicated significant differences among the genotypes in respect of all the growth parameters and yield attributing traits. The PCV and GCV (phenotypic and genotypic coefficient variation) were higher for finger weight, bunch weight and number of fingers. Bunch girth and finger weight had very high broad sense heritability (h2). Finger weight recorded the highest genetic advance followed by bunch weight. All the genotypes, on the basis of total variability were grouped into twelve distinct clusters. Maximum number of cultivars was accommodated in Cluster 1 followed by Cluster 7. Inter cluster distance was the highest between cluster 12 and cluster 7. Bunch girth made the maximum contribution to divergence (45.02 %) followed by finger weight (39.83 %).
Highlights
• Improvement of banana genotypes in respect of number of hands/bunch, number of fingers/bunch, finger length, finger weight and bunch weight would be rewarding as these traits had high GCV and PCV along with high heritability and high genetic advance.
• Maximum inter cluster distance was observed between cluster 12 and cluster 9.
• Grand Naine of cluster 12 may be crossed with genotypes of cluster 9 through somatic hybridisation/ sexual hybridization to develop superior transgressive segregants or heterotic hybrids.
Keywords: Banana, PCV, GCV, heritability, genetic advance, PCA, D2 analysis
Banana (Musa spp.), is the 2nd most important fruit crop in India next to mango. World banana production is around 103 million tonnes annually, of which bananas cultivation for the export trade account for only 10% (Aurore et al. 2009). India is the largest producer of banana in the world producing about 30.0 million metric tonnes from 8.3 lakh hectares (NHB, 2010). Hence, fruit harvested from bananas are important components of food security in the tropical world and provide income to the farming community through local and international
trade. Banana is a very popular fruit due to its low price and high nutritive value. It is a rich source of carbohydrate and rich in vitamins particularly vitamin B. It is also a good source of potassium, phosphorus, calcium and magnesium. The fruit is easy to digest, free from fat and cholesterol. Banana plants also provide useful by-products, such as fiber, vegetables, beer, wine and vinegar (Aurore et al. 2009).
Banana cultivation is an important source of income DOI: 10.5958/2230-732X.2017.00002.X
©2017 New Delhi Publishers. All rights reserved
production in Odisha is very low, contributing only 2% to the total banana production in the country (NHM year book). The low production could be alleviated by developing high yielding genotypes which indirectly demands evaluation and selection of elite genotypes. Selection on the other hand depends upon the genetic variability present in the base population. For the success of any breeding programme the basic requirement is the variability found within the members of the population. It is this variation which if heritable could be used for cultivar improvement, as improved cultivars are the backbone of any orchard system (Sharma et al. 2013). Use of Mahalanobis D2 statistics to estimate or evaluate the net/total divergence in breeding for crop improvement has been indicated by number of workers in different fruit crops. Rai and Mishra (2005) followed D2 analysis to study genetic divergence in a set of 17 genotypes of bael. Hernandez-Delgado et al. (2007) studied genetic diversity in Mexicana guava germplasm. Jagadeesh et al. (2007) studied genetic variability for fruit quality in jackfruit. Saran et al. (2007) studied genetic diversity in Indian jujube for powdery mildew and other traits. Rajan et al. (2007) followed multivariate analysis to assess genetic diversity in guava. Chipojola et al. (2009) studied the genetic diversity and relationship among 40 accessions of cashew. The use of genetically divergent parents in hybridization under transgressive breeding programme is dependent upon categorization of breeding material on the basis of appropriate criteria (Santos et al. 2011).
Apart from providing requisite assistance or help in selection of divergent parents in hybridization, D2 statistics also adequately assists in the measurement of diversification and the contribution of the relative proportion of each component trait towards the total genetic divergence or variation. While studying the clonal variability in mango, Manchekar et al. (2011) reported substantial variation after applying D2 statistics. Jana et al. (2015) studied genetic divergence in guava. Kabita et al. (2016) followed D2 analysis for identification of elite cashew hybrids. Ghaderi-Ghahfarokhi et al. (2016) studied geographical discrimination of 24 pomogranate cultivars using chromatographic analyses and multivariate statistical methods.
Quantitative classification offers a divergence value
among individuals and thus enables breeders to understand the racial affinities and evolutionary pattern in various species of cultivated plants. Furthermore, it also helps in making decisions in selection of the best parental combinations in hybridization programme. It serves as a sound basis of grouping any two or more genotypes based on minimum divergence or resemblance between them. Therefore, prior to initiation of any breeding programme the extent of variability present must be adequately assessed so that the breeding programme could yield the desired results. To use or exploit the available variability present in the genetic material in the form of some specific groups or classes, the divergence studies based upon some desirable/suitable parameters is of very essential and of utmost significance. Keeping in view the above the genetic variation and cluster analysis using D2 statistics was undertaken with the objectives to assess the variability present among the twenty two banana genotypes and potential use of this variability for further crop improvement through hybridization.
Materials and methods
The experiment was conducted in a randomised block design with three replications under All India Coordinated Research Project on Fruits at Central Research Station, OUAT, Bhubaneswar (East and SE Coastal Plain Zone, 20°15’N latitude and 85°52’ E longitude) in the year 2013-14 and 2014-15. The experimental material comprised of 22 banana genotypes of which 11 were national released cultivars and 11 were local landraces of Odisha (as given in Table 2).
firmly around the suckers. Planting was done on 5th August 2013. Irrigation was applied as and when necessary. Fertiliser was applied to the banana plants @ 200:50:200 g N:P:K/plant in four split doses i.e., at the time of planting, at 3rd, 5th and 7th months after planting. Five plants were selected at random in each plot to record observations on height of the pseudostem, girth of the pseudostem, number of leaves, length of leaf, width of leaf, days to shooting, days to harvest, length of bunch, girth of bunch, number of hands, number of fingers, length of finger, girth of finger, finger weight and bunch weight. The mean performance was evaluated by averaging the mean of plant crop and 1st ratoon crop. Genetic parameters and divergence study was done taking the mean data of all observations by using SAS software (9.0 version).
Results and discussion
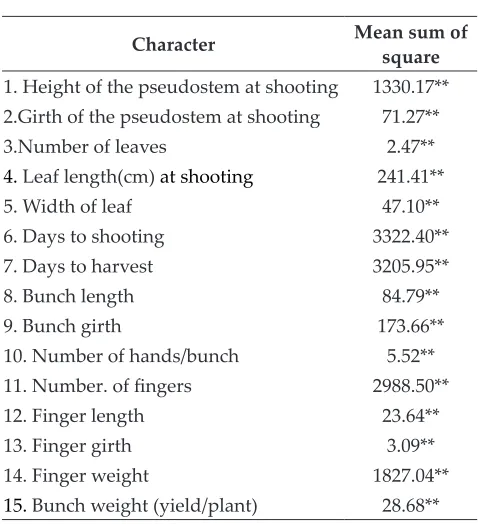
The mean squares from analysis of variance for dessert banana cultivars with respect to fifteen traits are presented in Table 1. The results revealed the presence of significant (P < 0.01) differences among the traits studied. The overall result showed the presence of genetic variability among the tested dessert banana cultivars.
Table 1:Mean sum of square in respect of 22 characters
Character Mean sum of square
1. Height of the pseudostem at shooting 1330.17** 2.Girth of the pseudostem at shooting 71.27**
3.Number of leaves 2.47**
4. Leaf length(cm) at shooting 241.41**
5. Width of leaf 47.10**
6. Days to shooting 3322.40** 7. Days to harvest 3205.95**
8. Bunch length 84.79**
9. Bunch girth 173.66**
10. Number of hands/bunch 5.52** 11. Number. of fingers 2988.50**
12. Finger length 23.64**
13. Finger girth 3.09**
14. Finger weight 1827.04**
15. Bunch weight (yield/plant) 28.68**
Mean performance of banana cultivars in
respect of growth parameters
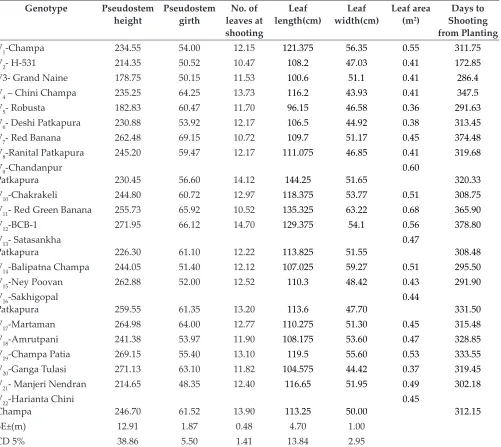
From Table 2, it was observed that the national released variety BCB-1 recorded the highest plant height (271.95 cm). BCB-1 was statistically at par with the national released cultivars Martman, Ney Poovan, Red Banana and the local cultivars Ganga Tulsi, Champa Patia, Sakhigopal Patkapura, Red Green Banana and Harianta Chini Champa. The minimum plant height was recorded in Grand Naine (178.75 cm) and other national released and local cultivars were significantly taller than Grand Naine except Robusta (182.83 cm). Red Banana had maximum girth of 69.15 cm followed by BCB-1(66.12 cm) and it was statistically at par with Red Green banana, Chini Champa, Martman, Ganga Tulsi, Harianta Chini Champa, Sakhigopal Patkapura, Satasankha Patkapura, Chakrakeli and Robusta. The minimum pseudostem girth was recorded in Manjeri Nendran (48.35 cm) and it was at par with Grand Naine, H-531, Balipatna Champa, Ney Poovan, Deshi Patkapura, Amrutpani, Champa, Champa Patia and Chandanpur Patkapura. Chandanpur Patkapura had the maximum leaf length of 144.25 cm followed by H-531 and BCB-1 which were statistically at par but significantly superior to rest of the cultivars. Red Green Banana was found statistically at par with BCB-1, Champa, Champa Patia and Chakrakeli and found significantly superior to rest of the cultivars. Leaf width varied significantly in the cultivars (Table 2).
BCB-1 and H-531 scored first rank and last rank respectively. BCB-1, Red Banana and Red Green Banana were late in shooting whereas Balipatna Champa, Ney Poovan, Robusta, Grand Naine and H-531 were earlier in shooting.
Mean performance of banana cultivars in
respect of yield and yield attributing characters
Mean data reflected (Table 3) earliness of H-531 (264.43 days) and lateness of BCB-1 (466.25 days), Red Banana (465.23 days) and Red Green Banana (457.40 days). The local cultivars Ganga Tulsi, Satsankha Patkapura, Ranital Patkapura, Harianta Chini Champa and Balipatna Champa were found
to be at par with the check variety Grand Naine (376.38 days). Pooled mean revealed that Grand Naine was unique amongst all, having the highest bunch length (66.83 cm) and none of the local and national cultivar was at par with it. The lowest bunch length was recorded in Manjeri Nendran (36.93 cm) and it was statistically at par with the cultivars Harianta Chini Champa and Amrutpani. The local cultivar Satsankha Patkapura attained the highest bunch girth of 95.90 cm and it was at par with Red Green Banana (94.33 cm) and Chandanpur Patkapura (91.05 cm). Ney Poovan recorded the highest number of hands/bunch (10.18) followed by Grand Naine (9.93) and the lowest was recorded Table 2: Mean Performance of 22 desert banana cultivars in respect of vegetative characters
Genotype Pseudostem
height Pseudostem girth leaves at No. of shooting
Leaf
length(cm) width(cm)Leaf Leaf area (m2)
Days to Shooting from Planting
V1-Champa 234.55 54.00 12.15 121.375 56.35 0.55 311.75
V2- H-531 214.35 50.52 10.47 108.2 47.03 0.41 172.85
V3- Grand Naine 178.75 50.15 11.53 100.6 51.1 0.41 286.4
V4 – Chini Champa 235.25 64.25 13.73 116.2 43.93 0.41 347.5
V5- Robusta 182.83 60.47 11.70 96.15 46.58 0.36 291.63
V6- Deshi Patkapura 230.88 53.92 12.17 106.5 44.92 0.38 313.45
V7- Red Banana 262.48 69.15 10.72 109.7 51.17 0.45 374.48
V8-Ranital Patkapura 245.20 59.47 12.17 111.075 46.85 0.41 319.68 V9-Chandanpur
Patkapura 230.45 56.60 14.12 144.25 51.65 0.60 320.33
V10-Chakrakeli 244.80 60.72 12.97 118.375 53.77 0.51 308.75
V11- Red Green Banana 255.73 65.92 10.52 135.325 63.22 0.68 365.90
V12-BCB-1 271.95 66.12 14.70 129.375 54.1 0.56 378.80
V13- Satasankha
Patkapura 226.30 61.10 12.22 113.825 51.55 0.47 308.48
V14-Balipatna Champa 244.05 51.40 12.12 107.025 59.27 0.51 295.50
V15-Ney Poovan 262.88 52.00 12.52 110.3 48.42 0.43 291.90
V16-Sakhigopal
Patkapura 259.55 61.35 13.20 113.6 47.70 0.44 331.50
V17-Martaman 264.98 64.00 12.77 110.275 51.30 0.45 315.48
V18-Amrutpani 241.38 53.97 11.90 108.175 53.60 0.47 328.85
V19-Champa Patia 269.15 55.40 13.10 119.5 55.60 0.53 333.55
V20-Ganga Tulasi 271.13 63.10 11.82 104.575 44.42 0.37 319.45
V21- Manjeri Nendran 214.65 48.35 12.40 116.65 51.95 0.49 302.18
V22-Harianta Chini
Champa 246.70 61.52 13.90 113.25 50.00 0.45 312.15
SE±(m) 12.91 1.87 0.48 4.70 1.00
in Red Banana (4.95). The local cultivar Champa Patia having the highest number of fingers (191.50) significantly exceeded the check Grand Naine (135.75). The cultivars Ney Poovan, BCB-1, Robusta, Champa and Balipatna Champa had more number of fingers than the check. Manjeri Nendran recorded the highest finger length (23.08) followed by check Grand Naine. Ranital Patkapura was found to be at par with the check and all other cultivars had
significantly short finger length. Red Banana had the highest girth (14.68 cm) and Champa Patia had the lowest girth (9.38 cm). None of the local cultivars recorded significantly higher girth than the check cultivar. Red Banana had the highest finger weight (136.68 g) and it was at par with Manjeri Nendran (127.0 g), Robusta (126.33 g), Red Green Banana (125.25 g) and Grand Naine (122.75 g). The lowest finger weight was recorded in Ney Poovan (37.10
Table 3: Mean Performance of 22 desert banana cultivars in respect of yield characters
Genotype Days to harvesting
from Planting
Bunch
length (cm)girth (cm)Bunch Hands/No. of bunch
No.of Fingers/
bunch
Length
of finger
(cm)
Girth of
finger
(cm)
Finger weight
(g)
Bunch weight (kg)/plant
V1-Champa 409.08 54.5 68.63 9.1 146.75 13.45 12.03 70.75 12.01 V2- H-531 264.43 47.3 73.13 5.88 99.75 13.05 12.20 62.75 8.55
V3- Grand Naine 376.38 66.83 69.53 9.93 135.75 22.15 12.00 122.75 20.61 V4 - ChiniChampa 438.58 49.20 66.05 7.35 108.50 12.28 11.93 62.40 8.71
V5- Robusta 383.88 56.43 84.25 9.80 150.25 17.55 12.48 126.33 21.34
V6- Deshi Patkapura 404.70 49.53 78.80 6.55 81.75 15.90 12.20 89.48 9.32
V7- Red Banana 465.23 47.98 81.00 4.95 62.50 15.90 14.68 136.68 10.83
V8-Ranital
Patkapura 404.83 47.10 85.25 5.83 86.50 18.05 12.25 101.95 10.34 V9-Chandanpur
Patkapura 419.88 56.83 91.05 6.30 88.00 16.75 12.23 100.25 12.25 V10-Chakrakeli 403.45 54.25 80.20 6.23 98.75 13.18 12.20 101.58 12.55 V11- Red Green
Banana 457.40 48.15 94.33 5.08 66.25 16.10 14.10 125.25 10.81
V12-BCB-1 466.25 51.08 83.88 8.30 151.50 14.30 10.55 61.65 11.99
V13- Satasankha
Patkapura 405.85 58.25 95.90 6.08 79.75 14.53 12.58 109.95 10.05 V14-Balipatna
Champa 389.43 53.23 77.75 8.55 144.25 12.60 11.35 58.25 9.64
V15-Ney Poovan 388.95 59.03 79.48 10.18 185.00 11.65 9.88 37.10 8.59
V16-Sakhigopal
Patkapura 420.25 45.28 67.30 7.00 89.75 15.98 12.43 95.88 10.31 V17-Martaman 408.53 49.13 83.45 8.00 105.75 15.43 12.63 82.50 10.81
V18-Amrutpani 419.85 43.73 64.13 7.48 92.75 10.50 10.08 64.98 7.48
V19-Champa Patia 403.10 53.28 76.60 9.80 191.50 9.05 9.38 45.15 11.20 V20-Ganga Tulasi 412.20 48.55 65.80 7.00 81.00 11.85 11.73 59.50 6.85
V21- Manjeri
Nendran 392.43 36.93 82.68 5.10 47.75 23.08 12.60 127.00 6.38
V22-Harianta Chini
Champa 404.08 41.93 68.63 8.05 109.75 11.85 10.73 52.45 6.25
SE±(m) 13.64 2.55 3.18 0.67 17.06 1.51 0.52 11.96 1.58
g). Robusta recorded the highest bunch weight (21.34kg) and at par with the check Grand Naine (20.61kg). But the national check Grand Naine significantly gave higher yield as compared to other cultivars. Chandanpur Patakapura was the highest yielder and Harianta Chini Champa was the lowest yielder among local cultivars.
Genetic parameters (GCV, PCV, heritability, genetic advance)
Mean, range, genotypic co-efficient of variability (GCV %), phenotypic co-efficient of variability (PCV%), heritability (broad sense; H) and genetic advance as % of mean (GA) are presented in Table 4. The grand mean for pseudo stem height was 240.36 cm. The estimates of GCV and PCV were low. Broad sense heritability was found to be moderate (58.4%) with low GA (14.50) indicating that selection for this trait would not be effective.
Though the genotypic co-efficient of variability (9.72) and phenotypic co-efficient of variability (10.72) were low in case of pseudostem girth but they were close to each other indicating that the effect of environment in expression of this trait was negligible. High heritability (82.1%) and low genetic gain (18.14) in respect of pseudostem girth indicates that improvement in pseudo stem girth through selection would be less effective. The
genotypic co-efficient of variability was the lowest (8.09) indicating that less variation is present in the population for number of leaves. Phenotypic co-efficient of variability was also low (9.77).
Moderate degree of heritability (68.5 %) was accompanied with low genetic advance (13.8) indicating that improvement in number of leaves through selection would be less effective. The mean leaf length was 114.28 cm and the range was very high. The genotypic co-efficient of variability was low (8.69) indicating that less variation is present in the population for leaf length. Phenotypic co-efficient of variability was also low (10.46). Moderate degree of heritability (68.5 %) accompanied with low genetic advance (13.8) indicated that improvement in length of leaves through selection would be less effective. The genotypic co-efficient of variability for leaf width was 9.29 % whereas phenotypic co-efficient of variability was 9.69 % and these two parameters were almost equal. So environment has no role in expression of leaf width. This trait was highly heritable (91.8 %) with low genetic advance (18.34).
Days to shooting ranged from 172.85 to 378.80 days with the mean of 315.02 days. The genotypic co-efficient of variability was 12.71% whereas phenotypic co-efficient of variability was 13.16 %. Heritability was too high (93.2 %) and GA was low Table 4: Genetic parameters of 22 banana cultivars
Character Mean Range GCV
(%)
PCV (%)
Heritability (broad sense)
GA (%) of Mean 1. Height of the pseudostem at shooting (cm) 240.36 178.75-271.95 9.21 12.06 0.584 14.50
2. Girth of the pseudostem at shooting (cm) 58.34 48.35-69.15 9.72 10.72 0.821 18.14
3. Number of leaves 12.41 10.47-14.70 8.09 9.77 0.685 13.80
4. Leaf length(cm) at shooting 114.28 96.15-144.25 8.69 10.46 0.689 14.86
5. Width of leaf (cm) 51.11 43.92-63.23 9.29 9.69 0.918 18.34
6. Days to shooting 315.02 172.85-378.80 12.71 13.16 0.932 25.29 7. Days to harvest 406.31 264.42-466.25 9.62 10.09 0.908 18.88 8. Length of bunch (cm) 50.84 36.92-66.83 12.36 13.24 0.872 23.78 9. Girth of bunch (cm) 78.08 64.13-95.90 11.92 11.94 0.996 24.51
10. No. of. hands 7.39 4.95-10.17 22.06 23.04 0.916 43.51
(25.29) and this may be due to non additive gene actions. Days to harvest ranged from 264.42 to 466.25 days with the mean of 406.31 days indicating that some cultivars were early type and some were late type. The genotypic co-efficient of variability was 9.62% whereas phenotypic co-efficient of variability was 10.09 %. Heritability was high (90.8 %) and GA was low (18.88) and this may be due to non additive type of gene actions.
The mean bunch length was 50.84 cm and the range was high (36.92- 66.83). The genotypic co-efficient of variability was 12.36 indicating that less variation is present in the population for bunch length. Phenotypic co-efficient of variability was 13.24. High degree of heritability (87.2 %) accompanied with low genetic advance (23.78) indicated non additive type of gene actions. The genotypic co-efficient of variability was 11.92 and phenotypic co-efficient of variability was 11.94 in case of bunch girth. High degree of heritability (99.6 %) accompanied with low genetic advance (24.51) indicated non additive type of gene actions.
The genotypic and phenotypic co-efficient of variability were 22.06 and 23.04. Heritability was very high (91.6 %) for number of hands/bunch and genetic advance was medium (43.51). So selection could be followed for further improvement of this trait. The average number of fingers/bunch was 109.25 across the cultivars and it ranged from 47.75 to 191.50. The genotypic and phenotypic co-efficient of variability were moderate (34.24 and 36.49). This indicated that the present population retained
variability for further selection. High heritability (88.0 %) with high genetic advance (66.18) indicated positive response to selection. The mean finger length was found to be 14.78 cm and the range was 9.05 to 23.07 cm. The estimates of genotypic (22.85) and phenotypic co-efficient of variability (23.66) were close to each other. Though the genetic variability had been depleted to a larger extent still then some amount of variability is present in the population for further selection. High heritability (93.3 %) with moderate genetic advance (43.51) indicated positive response to selection.
The average girth of finger was 11.92 cm and it ranged from 9.37 to 14.67. The estimates of genotypic (10.33) and phenotypic co-efficient of variability (10.53) were very low indicating that genetic variability had been fully exploited for improvement of finger girth and further selection would not be beneficial. It showed high heritability (96.3 %) with low genetic advance (20.90) indicating that finger girth is governed by non additive type of genes.
The average finger weight was 86.12 g and the minimum finger weight recorded was 37.10 g and the maximum was 136.68 g. The genotypic (42.89) and phenotypic co-efficient of variability (42.91) were very high. Finger weight exhibited high heritability (99.1 %) with high genetic advance (71.82) indicating additive type of gene action and selection for this trait would go in positive direction. The mean bunch weight across the cultivars was 10.76 kg and the range was 6.25 to 21.33 kg. This
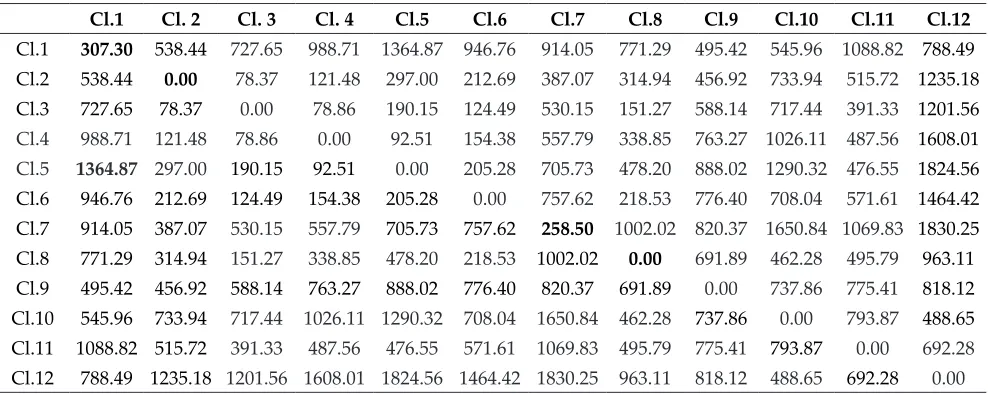
Table 5: Inter and intra cluster distances
Cl.1 Cl. 2 Cl. 3 Cl. 4 Cl.5 Cl.6 Cl.7 Cl.8 Cl.9 Cl.10 Cl.11 Cl.12
Cl.1 307.30 538.44 727.65 988.71 1364.87 946.76 914.05 771.29 495.42 545.96 1088.82 788.49
Cl.2 538.44 0.00 78.37 121.48 297.00 212.69 387.07 314.94 456.92 733.94 515.72 1235.18
Cl.3 727.65 78.37 0.00 78.86 190.15 124.49 530.15 151.27 588.14 717.44 391.33 1201.56
Cl.4 988.71 121.48 78.86 0.00 92.51 154.38 557.79 338.85 763.27 1026.11 487.56 1608.01
Cl.5 1364.87 297.00 190.15 92.51 0.00 205.28 705.73 478.20 888.02 1290.32 476.55 1824.56
Cl.6 946.76 212.69 124.49 154.38 205.28 0.00 757.62 218.53 776.40 708.04 571.61 1464.42
Cl.7 914.05 387.07 530.15 557.79 705.73 757.62 258.50 1002.02 820.37 1650.84 1069.83 1830.25
Cl.8 771.29 314.94 151.27 338.85 478.20 218.53 1002.02 0.00 691.89 462.28 495.79 963.11
Cl.9 495.42 456.92 588.14 763.27 888.02 776.40 820.37 691.89 0.00 737.86 775.41 818.12
Cl.10 545.96 733.94 717.44 1026.11 1290.32 708.04 1650.84 462.28 737.86 0.00 793.87 488.65
Cl.11 1088.82 515.72 391.33 487.56 476.55 571.61 1069.83 495.79 775.41 793.87 0.00 692.28
result clearly revealed that most of the cultivars had low bunch weight. The genotypic and phenotypic co-efficient of variability were moderate (34.58 and 35.78). This indicated that the present population retained enough variability for further selection. High degree of heritability (93.4 %) accompanied with high genetic advance (68.85) indicated additive gene action and there is ample scope for improvement of bunch weight.
D2 analysis and PCA (Canonical roots)
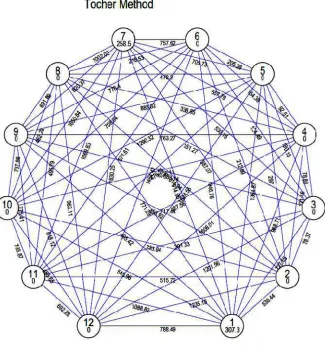
Genetic diversity analysis is generally used to identify diverse genotypes for hybridization purpose. The genotypes grouped together in a cluster are less divergent than the ones which fall into different clusters. From the results of D2 analysis it was observed that twenty two cultivars were grouped into 12 numbers of clusters (Fig. 1) of which ten clusters were monotypic. Cluster 1 comprised of 8 genotypes such as Champa (V1), Chini Champa (V4), Deshi Patkapura (V6), Chakrakeli (V10), Sakhigopal Patkapura (V16), Amrutpani (V18), Ganga Tulasi (V20) and Harianta Chini Champa (V22); cluster 7 comprised of four genotypes namely BCB-1 (V12), Balipatna Champa (V14), Ney Poovan (V15) and Champa Patia (V19); cluster 2 was a mono cluster containing the variety Martaman (V17); cluster 3- Ranital Patkapura (V8), cluster 4- Chandanpur Patkapura (V9), cluster 5- Satasankha Patkapura (V13), cluster 6- Red Green Banana (V11), cluster 8- Manjeri Nendran (V21), cluster 9- H-531 (V2), cluster 10- Red Banana (V7), cluster 11- Robusta (V5) & cluster 12- Grand Naine
(V3) respectively (Fig. 1).
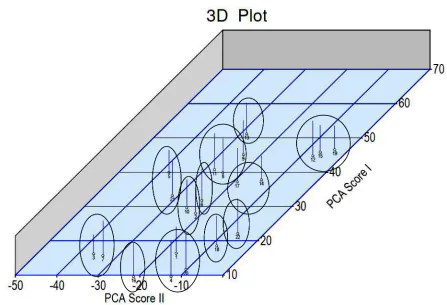
From the 3 D plot (Fig. 2) it was observed that the twenty two genotypes were grouped into 12 numbers of clusters. The genotypes present in each cell represented one cluster like Tocher’s method but the composition of cluster was different. Here. The maximum inter-cluster D2 values were observed between clusters IV and V indicating wide genetic diversity between the genotypes. Since, these clusters have more inter-cluster distances among themselves, selection of parents from such clusters for hybridization programme would help to evolve novel hybrids. The number of genotypes falling in these two clusters was 6 and 1. The parents for hybridization could be selected on the basis of their large inter-cluster distance for isolating useful recombinants in the segregating generations. Inter-cluster distance was found to be minimum in cluster II indicating close relationship and similarity for most traits in the genotypes of this cluster. Hence, selection of parents from this cluster is to be avoided. Similar studies conducted on other crops by Singh et al. (5) in pomegranate, and Rai and Misra (3) in bael have suggested selection of distant parents based on D2 analysis.
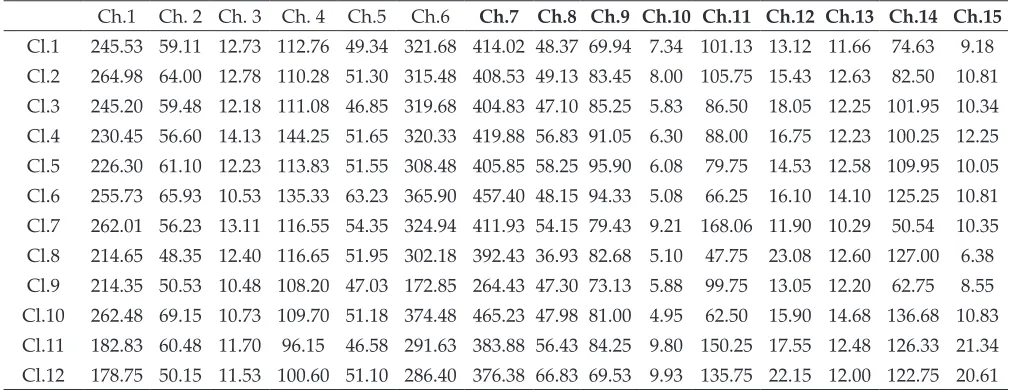
The intra (diagonal value) and inter cluster distances were presented in Table 5. The maximum intra cluster distance was 307.30 and minimum was 0.0. The longest inter cluster distance (1830.25) was observed between cluster 7 and cluster 12. Since, these clusters have more inter-cluster distances among themselves, selection of parents from such Table 6: Cluster means (Tocher Method)
Ch.1 Ch. 2 Ch. 3 Ch. 4 Ch.5 Ch.6 Ch.7 Ch.8 Ch.9 Ch.10 Ch.11 Ch.12 Ch.13 Ch.14 Ch.15
Cl.1 245.53 59.11 12.73 112.76 49.34 321.68 414.02 48.37 69.94 7.34 101.13 13.12 11.66 74.63 9.18
Cl.2 264.98 64.00 12.78 110.28 51.30 315.48 408.53 49.13 83.45 8.00 105.75 15.43 12.63 82.50 10.81
Cl.3 245.20 59.48 12.18 111.08 46.85 319.68 404.83 47.10 85.25 5.83 86.50 18.05 12.25 101.95 10.34
Cl.4 230.45 56.60 14.13 144.25 51.65 320.33 419.88 56.83 91.05 6.30 88.00 16.75 12.23 100.25 12.25
Cl.5 226.30 61.10 12.23 113.83 51.55 308.48 405.85 58.25 95.90 6.08 79.75 14.53 12.58 109.95 10.05
Cl.6 255.73 65.93 10.53 135.33 63.23 365.90 457.40 48.15 94.33 5.08 66.25 16.10 14.10 125.25 10.81 Cl.7 262.01 56.23 13.11 116.55 54.35 324.94 411.93 54.15 79.43 9.21 168.06 11.90 10.29 50.54 10.35
Cl.8 214.65 48.35 12.40 116.65 51.95 302.18 392.43 36.93 82.68 5.10 47.75 23.08 12.60 127.00 6.38
Cl.9 214.35 50.53 10.48 108.20 47.03 172.85 264.43 47.30 73.13 5.88 99.75 13.05 12.20 62.75 8.55
Cl.10 262.48 69.15 10.73 109.70 51.18 374.48 465.23 47.98 81.00 4.95 62.50 15.90 14.68 136.68 10.83 Cl.11 182.83 60.48 11.70 96.15 46.58 291.63 383.88 56.43 84.25 9.80 150.25 17.55 12.48 126.33 21.34
Fig. 1: Clustering of the cultivars by Tocher’s method
clusters for hybridization programme would help to evolve novel hybrids. Cluster 1 was farthest from cluster 5 (1364.87) and nearest to cluster 9 (495.42). Cluster 2 was farthest from cluster 12 (1235.18) and nearest to cluster 3 (78.37). Cluster 3 was farthest from cluster 12(1201.56) and nearest to cluster 2 (78.37). Cluster 4 was farthest from cluster 12(1608.01) and nearest to cluster 3 (78.86). Cluster 5 was far away from cluster 12(1824.56) and nearest to cluster 4 (92.51). Cluster 6 was farthest from cluster 12(1464.42) and nearest to cluster 3 (124.49). Cluster 7 was farthest from cluster 12(1830.25) and nearest to cluster 2 (387.07). Cluster 8 was farthest from cluster 7 (1002.02) and closest to cluster 3 (78.86). Cluster 9 was farthest from cluster 5 (888.02) and closest to cluster 2 (456.92). Cluster 10 was farthest from cluster 7 (1650.84) and closest to cluster 8 (462.28). Cluster 11 was farthest from cluster 1 (1088.82) and closest to cluster 3 (391.33). This inter and intra cluster distances indicated some uniqueness of cluster 12.
Photos on Banana Genotypes
Champa bunch with male flower H - 531 with male flower
Grand Naine with male flower Chini Champa with male flower
Robusta bunch with male flower Deshi Patkapura with male flower
Chandanpur Patkapura with male flower Chakrakeli bunch with male flower
Red green banana bunch with male flower BCB-1 bunch with male flower
Satsankha patkapura bunch with male flow(2) Balipatna champa with male flower
the maximum contribution to divergence (45.02 %) followed by finger weight (39.83 %). Grand Naine was found to be the best genotype.
In the present investigation phenotypic variance was relatively higher than the genotypic variance for all the traits. However, the magnitude of difference for most of the traits indicates that there was lesser influence of environment on these characters. This reveals that selection based on any traits would definitely reflect on bunch weight. High genotypic and phenotypic co-efficient of variation was recorded for number of fingers, bunch weight and finger weight while moderate GCV and PCV was observed in number of hands/bunch and finger length. This was further supported by the higher magnitude of heritability coupled with higher magnitude of genetic advance registered for most morphological traits especially for bunch weight, number of fruits/hand, number of fingers, and finger weight and number of hands/bunch. The genetic
co-efficient of variability estimate would furnish the most reliable information on the amount of advance expected from the selection.
The low PCV and GCV estimated in the present study may be either due to the occurrence of low spontaneous mutation rates or to the small population size or to both reasons. Out of the fifteen characters on which genetic analysis was done, only bunch weight, leaf length and average fruit weight had moderate heritability and expected genetic advance showing promise for genetic improvement. Higher heritability and expected genetic advance were observed for bunch weight and average fruit weight which may be due to wide genetic variability of the germplasm belonging to different genomic groups. It has also been reported that heritability estimates would be reliable if accompanied by a high expected genetic advance. For any crop improvement programme presence of genetic variability in the population is quite indispensable. In the present investigation genetic
Martaman bunch with male flower (2) Amritpani bunch with male flower (2)
variability present in the population was studied. Sirisena et al. (2000) estimated variability parameters within `Mysore' banana clones and their implication for crop improvement. Lenka et al. (2004) reported variation among nine varieties of plantain. They also observed high heritability in respect of bunch weight and number of fingers/bunch. Mohammed et al. (2013) evaluated 11 cooking banana (Musa sp.) clones of East Africa origin for study on genetic variability and distance. Kavitha et al. (2008) studied genetic variability like genetic variance, heritability and genetic advance in 19 banana hybrids in order to identify desirable genotypes for crop improvement programme. Crouch et al. (2000) made comparative analysis of phenotypic and genotypic diversity among 76 plantain landraces (Musa spp. AAB group). Although significant progress has been made over the past two decades, only a few hybrid-bred cultivars (mostly tetraploids) are grown in significant acreages by banana farmers. As noted by Ortiz et al. (2011), the focus of Musa breeding needs to gradually shift from addressing existing constraints to assessing the risk potential of emerging threats and preparing to respond to them, particularly under a changing climate that may increase both abiotic and biotic stress incidences and severity in this crop.
For an efficient breeding program, selection of genetically divergence and superior genotypes is important. Therefore, making crosses between genotypes which would ensure the exploitation of heterosis and development of transgressive segregants. For estimation of maximum heterotic effects, selection of parents belonging to different clusters would be profitable (Jana et al. 2015). In this case the maximum inter-cluster D2 values were observed between clusters 12 and 7 indicating wide genetic diversity between the genotypes. Since, these clusters have more inter-cluster distances among themselves, selection of parents from such clusters for hybridization programme would help to evolve novel hybrids. The number of genotypes falling in these two clusters was 1 and 4. The parents for hybridization could be selected on the basis of their large inter-cluster distance for isolating useful recombinants in the segregating generations. Singh et al. (5) in pomegranate, and Rai and Misra (3) in bael have suggested selection of distant parents based on D2 analysis.
Conclusion
The present investigation indicated that number of hands/bunch, number of fingers/bunch, finger length, finger weight and bunch weight had high GCV and PCV along with high heritability and high genetic advance. Hence selection for these yield attributing traits would be rewarding. Grand Naine present in cluster 12 may be crossed with parents of cluster 9 through somatic hybridisation/sexual hybridization to develop superior transgressive segregants or heterotic hybrids.
References
Aurore, G., Parfait, B. and Fahrasmane, L. 2009. Bananas raw materials for making processed food products. Trends in Food Science & Technology, 20: 78-91.
Chipojola, F.M., Mwase, W.F., Kwapata, M.B. and Maliro, M.F. 2009. Morphological characterization of cashew (Anacardium occidentale L.) in four populations in Malawi. African J Biotech., 8(20): 5173-5181.
Crouch, H.K., Madsen, S., Vuylsteke, D.R. and Ortiz, R. 2000. Comparative analysis of phenotypic and genotypic diversity among plantain land races Musa spp. AAB group. Theoretical and Applied Genetics 101(7): 1056-1065. Ghaderi-Ghahfarokhi, M., Barzegar, M. and Nabil, M. 2016.
Geographical Discrimination of Iranian Pomegranate Cultivars Based on Organic Acids Composition and Multivariate Analysis. J Agr. Sci., 18: 1221-1232.
Hernandez-Delgado, S., Padilla-Ramýrez, J.S., Nava-Cedillo, A. and Mayek-Perez, N. 2007. Morphological and genetic diversity of Mexican guava germplasm. Plant Genetic Resources - Characterization and Utilization 5: 131-141. Jagadeesh, S.L., Reddy, B.S., Basavaraj, N., Swamy, G.S.K.,
Kirankumar, Laxminarayan, H., Raghavan, G.S.V. and Kajjidoni, S.T. 2007. Inter tree variability for fruit quality in jackfruit selections of Western Ghats of India. Science Horticulture, 112: 382-387.
Jana, B.R., Munsi, P.S., Mann, D.C., Sarkar, H. and Das, B. 2015.Genetic Divergence Studies in Guava (Psidium guajava L.).Electronic J Plant Breeding 6(1): 161-166. Kavitha, P.S., Balamohan, T.N., Kumar, N. and
Veeraragavathatham, D. 2008. Genetic variability studies in banana hybrids. The Asian Journal of Horticulture 3(2): 265-269.
Lenka, P.C., Biswal, M.K. and Mishra, S.N. 2004. Genetic variability and correlation studies in culinary banana. Proceedings of National Seminar on Banana Industry-Present Scenario and Future Strategies held at Bidhan Chandra Krishi Viswavidyalaya during June 11-13. pp. 3-4.
Mohammed, W.., Kebede, W., Tsadik, Tekalign, T. and Kiflemariam, Y. 2013. Genetic variability and distance of East Africa cooking Banana (Musa sp.) Clones for Morpho-physicochemical Traits. East African Journal of Sciences, 7(2): 67-76.
Ortiz, R., Pillay, M. and Tenkouano, A. 2011. Future prospects in Banana Breeding. Progress and Challenges. CRC Press, Boca Raton, Florida. p. 349–351. In: M. Pillay and A. Tenkouano (eds.)
Rai, D. and Mishra, K.K. 2005. Studies on genetic divergence in Bael (Aegle marmelos Correa). Indian J Hort., 62(2): 152-154.
Rajan, S., Yadav, L.P., Kumar Ram and Saxena, S.K. 2007. Genetic divergence in seed characteristics of guava: A basis for parent selection in hybridization. Indian J Hort., 64(3): 290-293.
Santos, C.A.F., Corrêa, L.C. and Costa, S.R. 2011. Genetic divergence among Psidium accessions based on biochemical and agronomic variables. Crop Breed. App Biotech., 11: 149-156.
Saran, P.L., Godara, A.K. and Dalal, R.P. 2007. Biodiversity among indian jujube (Ziziphus mauritiana Lamk.) Genotypes for powdery mildew and other traits. Not Bot Hort Agrobot Cluj., 35(2): 15-22.
Sethi, K., Tripathy, S.K. and Lenka, P.C. 2016. Assessment of Genetic Diversity and identification of Elite Cashew Hybrids. Advances in Life Sciences, 5(16): 6200-6205. Sharma, G., Sharma, N., Bashir, R., Khokhar, A. and Jamwal,
M. 2013. Genetic divergence and cluster analysis studies of different apple genotypes using D2 statistics. African J Agric Res., 8(37): 4681-4685.
Singh, R., Meena, K.K. and Singh, S.K. 2003. Genetic divergence for yield and its component traits in pomegranate (Punica granatum L.). Indian J Plant Genet Resour., 16: 133-34. Sirisena, J.A. and Senanayake, S.G.J.N. 2000. Estimation of