Experimental Study on Sorption and
Desorption of NaCl to Sand Using a Physical
Model
Zahra Mardani
1, Kumars Ebrahimi
1*and Ali Jafari
11 University of Tehran, Tehran, IRAN
[email protected], [email protected], [email protected]
Abstract
In many parts of our planet, salinity has caused numerous problems in the production of goods, especially in arid and semi-arid areas, which account for one third of the planet's surface area. The main purpose of this article is to investigate the NaCl’s adsorption to and desorption from saturated porous media of sand. The NaCl solutions with the concentrations of 2.5, 5 and 10 g/l, and three types of soil textures with the weights of 50, 100 and 200g were used as samples of the experiments. The samples were placed in capped containers. The salinity of the solutions was measured using an EC-metre at 1, 2, 4, 7 and 24 hours from the beginning of the experiment
.
The results indicated that in the soils with less weight, the adsorption of sodium ions were more, and as soil weight increased, the adsorption of ions decreased, and finally the adsorption phenomenon was departed. Over time, the process of adsorption and desalination eventually stopped.1
Introduction
Groundwater rarely consists of pure water; on the contrary, it generally contains dissolved elements and suspended particles. Moreover, bacteria, viruses, toxic gases, etc. could affect water quality. The type and concentration of dissolved elements in groundwater depends upon the chemical composition of the rock formation through which groundwater flows, and it depends on the travel time of the fluid mass within the rocks (Ebrahimi & Falconer 2015).
* Corresponding author of the paper
Volume 3, 2018, Pages 1306–1315
In many parts of the planet Earth, especially the arid and semi-arid areas, which account for one third of the Planet's surface area, salinity has caused numerous problems in the production of goods. Salinity with increasing osmotic pressure disturbs the balance between nutrients and the toxicity of certain elements essential for plant growth; furthermore, it changes the ion selection patterns by the roots and reduces the ion displacement inside plants
.
Various models have been developed in order to study the movement of contaminating bodies in groundwater as well as the penetration of saline water and the transfer of the leachate from distant places to groundwater (Wang & Anderson 1982).
From Heidarzadeh 2017 it could be recognised that although the practice of sampling to monitor the quality of groundwater is a costly and time consuming process, the dataset of groundwater quality from a time period of about two decades obtained from sampling, could be used for further prediction of groundwater quality with powerful models like artificial neural network (ANN). Also, it was mentioned that the suitable input variables for the purpose of his study were pH, electrical conductivity and total hardness.
The importance and effects of soil salinity was also mentioned by recent researches. The effect of soil salinity on root growth of most crop plants was researched by Byrt et al. 2018 and they emphasized the effects of salt stress on important determinants of inhibition of root enlongation.
The assessment of the soil salinity through satellite thermography was practiced by Ivushkin et al. 2018 for irrigated and rainfed crops, and they concluded that in all cases average canopy temperatures were significantly correlated with soil salinity of the area.
The sorption and desorption of different materials and pollutants in soils have been researched by different scientists around the world. Bai et al. 2015 studied the phosphorus sorption - desorption process in wetland soils through laboratory experiments and using a binomial equation, he described the effects of salinity, pH and temperature on phosphorus sorption.
The sorption and desorption of potentially toxic metals (Cd, Cu, Ni and Zn) by an amended soil with sorbents was studied by Tahervand & Jalali 2017 at the pH range of 2 to 9. It was reported that metal sorption on both the control and amended soils was dependent to pH.
Tabebordbar et al. 2013 combined kaolinite with different concentrations of MTBE and then, they researched the effects of various parameters on the soil capacity to adsorb MTBE. The research results indicated that unlike other clay minerals, the kaolinite clay soil was not appropriate to filter the dissolved MTBE in water and the efficiency of Kaolinite to filter MTBE from water was less than other clay minerals.
Mohsenipour et al. 2015 evaluated the effects of kaolin on nitrate reduction under acidic condition, and also he studied the capacity of nitrate adsorption on kaolin involving two well-known adsorption isotherm models, namely, Freundlich and Longmuir. His research revealed that approximately 25% of the nitrate present in the solution was adsorbed on clay kaolin, and his experiments indicated that kaolin can be used as a natural scavenger of pollution in the environment.
Although different researches have been carried out both in terms of quantity and variety to study the adsorption and desorption of different pollutants in soils, few researches have been undertaken to measure the adsorption and desorption of NaCl salt in soils with different textures. According to the fact that it is necessary to track contaminants properly in groundwater, the use of tracers is a common practice to simulate the path of contamination in physical models. The results of this research show that the trap adsorption process in the porous medium is an important function, which has a major role in tracking the performance and limits of the use of detectors. Also, the selection of a traceable resistor to adsorb NaCl in the soil is helpful to interpret the results correctly, and meanwhile, it contributes to the tracking operations to be successful. Adsorption is an irreversible process which is affected by different variables including temperature, the intensity of water turbulence, the type of water, the gradation of sediments, and the type of tracers.
water or the soil media, the lack of deposition of tracer along the flow path, and its insolubility in water are important features to be considered (Moftakhari Anasori Movahed & Saboor 2016).
1.1
The effect of temperature on the tracer
The resistance of the detectors to the temperature is of considerable importance, specifically when the tracking operation requires the desired thermal environment. It is important to note that temperature and electrical conductivity have a linear relationship. In order to remove the temperature effect on the amount of electrical conductivity measured by salt detectors, the measured electrical conductivity was corrected using the thermal coefficient of salts. The trajectory behaviour of detectors was evaluated at different temperatures by applying the conditions of decreasing and increasing temperature relative to the initial state and evaluating the changes of the detectors
.
This paper is the upgraded and developed version of the research by Mardani et al. 2018.
2
Materials and Methods
The purpose of this study is to investigate the NaCl adsorption and desorption phenomenon from saturated porous media of sand. Based on this experiment, different amounts of dry soil with normal moisture (adsorbents) were prepared using the beforehand prepared solutions, and the water and various NaCl concentrations were mixed, and the NaCl concentration was measured at different time intervals
.
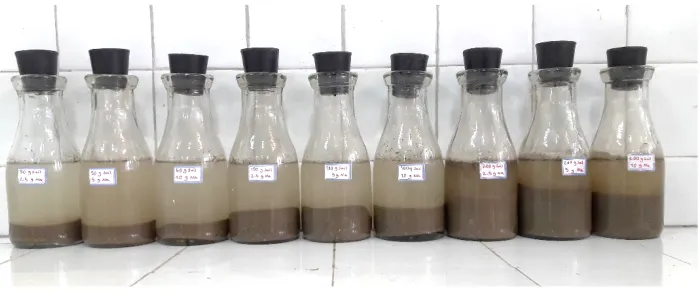
The NaCl solutions with the concentrations of 2.5, 5 and 10 g/l, and three types of soil textures with the weights of 50, 100 and 200 g were utilized as samples of the experiment. The samples were placed in capped containers and the containers were located next to one another (Figure 1). At 1, 2, 4, 7, and 24 hours from the beginning of the experiment, the salinity of the solution was measured by an EC-metre (Manufactured by AZ Instrument in Taiwan, Model: 8301, Conductivity Accuracy: 0.01
µS)
.
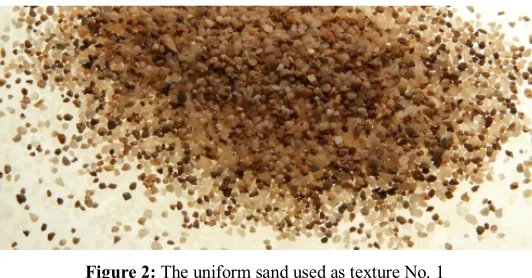
Texture No. 1 is sandy with a uniform texture as shown in Figure 2. Among its various applications are the water and wastewater treatment plants, the sand blasting of pipes and reservoirs, and the use for metal and concrete surfaces. Tables 1 and 2 demonstrate the different features and components of the sand as follows
:
Table 1: Physical, chemical and mechanical features of the sand (%)
Specification SiO2
Fe2O3 Al2O3
K2O CaO MgO L.O. I amount 97.5 0.85 0.95 0.19 0.27 0.24 0.0
Table 2:Components of the sand (%)
As presented in Table 1, the chosen sand used for texture No. 1 has a fairly uniform texture, and Table 2 depicts that although the utilized sand is mostly composed of SiO2, it maintains a range of
diversity in other minerals. The components for textures No. 2 and 3 are available in Table 3 as below
:
Soil texture components (%)
Soil No. Clay Silt Sand Soil texture 2 39.53 44.62 15.86 Silt Clay Loam 3 2.6 96.6 0.8 Silt
Table 3:Components of texture No. 2 and No. 3
Specification Colour Specific Density Zinter Point Corner Coefficient Particle Diameter (mm) D10 D60 Coefficient of Uniformity amount white to yellow 2.62 1400> 1.3< 1-2.5 1210 945 1.28
Table 3 illustrates that unlike texture No. 1, the textures No. 2 and 3 are composed of various amounts of sand, silt and clay.
3
Results and Discussion
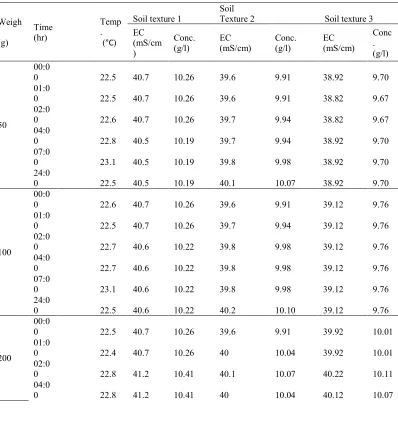
The information provided in Table 4 are the results from the experiment presenting the values of EC and concentrations measured at 1, 2, 4, 7, and 24 hours from the beginning of the experiment on the three soil weights of 50, 100 and 200 grams with three different textures. Also, the temperatures were recorded during the experiment at all EC and concentration measurements and the effect of temperature was taken into account.
Weigh t (g)
Time (hr)
Temp . (°C)
Soil texture 1 Soil Texture 2 Soil texture 3 EC
(mS/cm )
Conc.
(g/l) EC (mS/cm) Conc. (g/l) EC (mS/cm)
Conc . (g/l)
50
00:0
0 22.5 40.7 10.26 39.6 9.91 38.92 9.70
01:0
0 22.5 40.7 10.26 39.6 9.91 38.82 9.67
02:0
0 22.6 40.7 10.26 39.7 9.94 38.82 9.67
04:0
0 22.8 40.5 10.19 39.7 9.94 38.92 9.70
07:0
0 23.1 40.5 10.19 39.8 9.98 38.92 9.70
24:0
0 22.5 40.5 10.19 40.1 10.07 38.92 9.70
100
00:0
0 22.6 40.7 10.26 39.6 9.91 39.12 9.76
01:0
0 22.5 40.7 10.26 39.7 9.94 39.12 9.76
02:0
0 22.7 40.6 10.22 39.8 9.98 39.12 9.76
04:0
0 22.7 40.6 10.22 39.8 9.98 39.12 9.76
07:0
0 23.1 40.6 10.22 39.8 9.98 39.12 9.76
24:0
0 22.5 40.6 10.22 40.2 10.10 39.12 9.76
200
00:0
0 22.5 40.7 10.26 39.6 9.91 39.92 10.01
01:0
0 22.4 40.7 10.26 40 10.04 39.92 10.01
02:0
0 22.8 41.2 10.41 40.1 10.07 40.22 10.11
04:0
07:0
0 23.2 41.2 10.41 40.1 10.07 40.12 10.07
24:0
0 22.5 41.2 10.41 40.5 10.19 40.12 10.07
Table 4:The changes in EC and concentration values of the experiment samples over time
After recording the salt contents of the samples, the EC values were converted to concentration. Thus, using the equation No. 1, the concentration values were obtained in milligrams per litre
.
C = a(EC)b
(1)
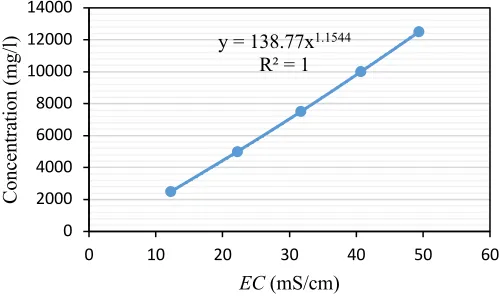
In equation No. 1, C is the concentration in mg/l, a and b are the equation coefficients without unit, and EC is the electrical conductivity in mS/cm. In order to determine the coefficients a and b, solutions were first prepared with different concentrations in the laboratory and the EC values were recorded for each solution in Table 5. Then the coefficients were calculated by plotting the concentration versus EC graph and fitting the exponential function curve as illustrated in Figure 3. The calculated coefficients are presented in equation No. 1.
Concentration
(ppm) NaCl (g) EC (mS/cm)
2500 6.36 12.27
5000 12.72 22.2
7500 19.08 31.7
10000 25.44 40.7
12500 31.8 49.4
Table 5: Concentrations, EC and NaCl measured values
The concentration and EC data, from which the coefficients a and b were drawn are presented in figure 3, below.
y = 138.77x1.1544
R² = 1
0 2000 4000 6000 8000 10000 12000 14000
0 10 20 30 40 50 60
Co
nc
en
tr
at
io
n
(m
g/
l)
EC(mS/cm)
Equation No. 1 is presented as follows:
C = 138.77 (EC)1.1544 (2)
9.65 9.75 9.85 9.95 10.05 10.15 10.25 10.35 10.45
0 5 10 15 20 25 30
Sol
ut
ion
C
onc
en.
(
g/
l)
Time (hr)
initial concentration 50 gr
100 gr 200 gr
9.65 9.75 9.85 9.95 10.05 10.15 10.25 10.35 10.45
0 5 10 15 20 25 30
Sol
ut
ion
C
onc
en.
(
g/
l)
Time (hr)
initial concentration 50 gr
100 gr 200 gr
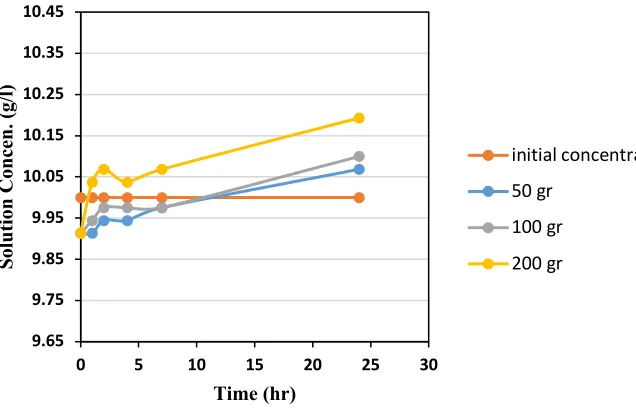
Figure 4: Changes in solution concentrations versus time for the soil texture No. 1
As illustrated in Figures 4, 5 and 6 the initial concentration for all textures is a constant value of 10 g/l. In texture No. 1 the initial values of concentration for the soil weights were similar, but in less than 4 hours, the solution concentration of the 100 and 50 g samples have decreased and reached to constant values; on the other hand, a sharp increase in the 200 g sample could be observed after two hours, then it has peaked and after a slight decline between the second and the third hour, it also has reached a constant value. From the concentration changes of texture No. 1 it could be concluded that although the samples showed different behaviours in initial hours of the experiment, they all reached to specific constant values over time.
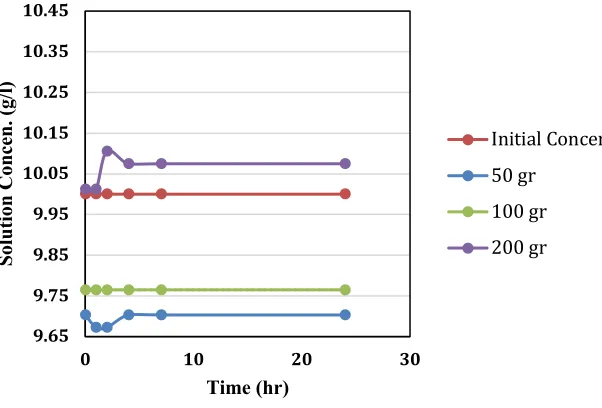
In the texture No. 2 (Figure 5), except for the 50 g sample, which had a slight decrease and bottomed in the first hour, the other two soil samples have maintained upward trends in the first two hours, and they all reached a relative maximum in the second hour. After the second hour, all the samples declined towards a relative minimum in the 4th and 7th hours, and then, they all maintained a steady, but slight upward trend to meet their highest values at the 24th hour, and then all the three soil weights attained their constant values, in which the concentrations remained unchanged.
In texture No. 3 (Figure 6), except for the 100 g sample which has adopted a constant value throughout the experiment, the 200 and 50 g samples have peaked and bottomed respectively in less than 4 hours, and they both reached to constant values. The samples of texture No. 3, No. 2, and No. 1 reveal almost similar results in terms of initial changes and reaching to constant values over time.
In order to determine the effects of soil and contact time on the adsorption capacity at a constant temperature and as a sample of NaCl solution concentration of 10 g/l, the different weights of the tested soils that were 50, 100 and 200 g with 250 ml of admixture solution were put together. After the test was started, the electrical conductivity was measured at different time intervals of 1, 2, 4, 7 and 24 hours using the EC-metre.
9.65 9.75 9.85 9.95 10.05 10.15 10.25 10.35 10.45
0 10 20 30
Sol
ut
ion
C
onc
en.
(
g/
l)
Time (hr)
Initial Concentration 50 gr
100 gr 200 gr
3.1
Results of the effect of soil weight on adsorption capacity
According to the diagrams of Figure 4, in Table 1, as the weight of soil increases, its response to the NaCl solution becomes greater. The reaction of sand to the solution in the weight of 50 grams is more than the weight of 100 grams and then the reaction decreases over time and reaches a constant level.
The overall trend of the increasing NaCl reaction is observed with the increase of sand weight. In texture No. 2, a general increasing trend for NaCl solution reaction is observed with the increase in soil mass, i.e., as the amount of soil weight increases, the soluble reaction with soil particles also increase. In texture No. 3, as soil weight increases, NaCl adsorption decreases and the desorption phenomenon occurs.
3.2
Results of the effect of contact time on adsorption capacity
As an example, in the texture No. 1 at the weight of 50 grams, first, the rate of salt adsorption by the soil is high and over time, the adsorption rate decreases to reach a constant level after 4 hours, as shown in Figure 4, and then the adsorption phenomenon stops. At the weight of 100 grams, the initial rate of adsorption is high and then it reaches a constant level, which means after 2 hours no adsorption has taken place. At the weight of 200 grams, the desorption rate is initially high, and after 2 hours, the NaCl disintegrating phenomenon in the solution stops.
4
Conclusion
In order to study the effect of soil mass on the adsorption capacity, according to the results of the experiment it can be concluded that in the soils with less weight, the adsorption of sodium ions is more, and as soil weight increases, adsorption decreases and the adsorption phenomenon departs. Over time, the process of adsorption and desensitization stops. The results of this study are applicable to be used in physical model experiments, solute transport and researches for the soil porous media.
Acknowledgements
In this regard, we thank the University of Tehran for providing the necessary facilities to conduct this research and to prepare the related articles.
References
Bai, J., Ye, X., Jia, J., Zhang, G., Zhao, Q., Cui, B., Liu, X. (2017) Phosphorus sorption-desorption and effects of temperature, pH and salinity on phosphorus sorption in marsh soils from coastal wetlands with different flooding conditions. Chemosphere, doi: 10.1016/j.chemosphere.2017.08.117
Byrt, C. S., Munns, R., Burton R. A., Gilliham, M., Wege S. (2018) Root cell wall solutions for crop plants in saline soils. Plant Science, 269, 47 - 55
Heidarzadeh, N. (2017) A practical low-cost model for prediction of the groundwater quality using artificial neural networks. Journal of Water Supply: Research and Technology—AQUA, 66 (2) 86-95, doi: 10.2166/aqua.2017.035
.
Ivushkin, K., Bartholomeus, H., Bregt, A. K., Pulatov, A., Bui, E. N. (2018) Soil salinity assessment through satellite thermography for different irrigated and rainfed crops. International Journal of Applied Observation and Geoinformation, 68, 230 – 237.
Mardani, Z., Ebrahimi, K., Liaghat, A., Araghinejad, Sh. (2018) (Experimental study on sorption and desorption of NaCl to sand using a physical model). 11th International Congress on Civil Engineering, University of Tehran, Tehran, Iran.
Moftakhari Movahed, S. & Saboor, M. (2016) (Estimation of the adsorption coefficient of organic pollutants into soil using molecular reliefs). Fourth International Congress on Civil Engineering, Urban Development and Architecture, Tehran, Permanent Secretariat of the Conference, Shahid Beheshti University.
Mohsenipour, M., Shahid, Sh. & Ebrahimi, K. (2015) Nitrate adsorption on clay kaolin: batch tests. Journal of Chemistry, Article ID 397069, 7 pages.
Tabebordbar, A., Ghaziani, F., Raeisi Astabregh, A., Liaghat, A. (2013) (Absorption capacity, separation method and determination of MTBE concentration in MTBE contaminated kaolinite soil). Iranian Journal of Soil and Water Research, Vol. 44, No. 4, 35.
Tahervand, S. & Jalali, M. (2017) Sorption and desorption of potentially toxic metals (Cd, Cu, Ni and Zn) by soil amended with bentonie, calcite and zeolite as a function of pH. Journal of Geochemical Exploration, Volume 181, October 2017, Pages 148-159, doi: 10.1016/j.gexplo.2017.07.005.