Method Development and Validation of Naftopidil by Reverse Phase-HPLC in Bulk and Pharmaceutical Dosage Forms
6
0
0
Full text
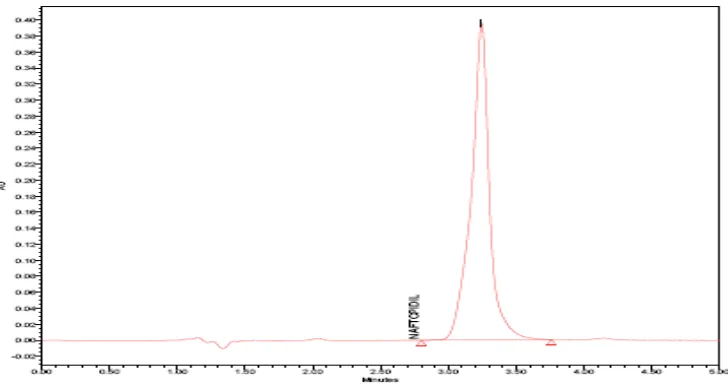
(2) 30 V.Gayathri et al / Int. J. of Pharmacy and Analytical Research Vol-1(1) 2012 [29-34]. Litreature survey reveals that a chiral HPLC method was developed for separation and analysis of Naftopidil enantiomers(3).Further a fluorescence method(4),chemiluminescence method (5) and direct determination of naftopidil in phosphor rescence were reported(6). A HPLC method was developed for determination of naftopidil in biological samples [7].. MATERIALS AND METHODS Quantitative HPLC was performed on an isocratic high pressure liquid chromatography (Waters model 2695) Equipped with a photodiode array detector capable of operating in the range of 190 nm to 800 nm with Kromosil C18 (150×4.6mm, 3.5µ). REAGENTS AND CHEMICALS Orthophosphoric acid of AR grade, methanol of HPLC grade, acetonitrile of HPLC grade and water HPLC grade were obtained from Rankem Chemicals Ltd., Mumbai. Naftopidil was obtained as a gift sample from Aurobindo pharma, India. The commercially available Naftopidil tablets were procured from the local Pharmacy. CHROMATOGRAPHIC CONDITIONS The mobile phase consisting of acetonitrile and water (pH adjusted 2.4 by orthophosphoric acid) in the ratio of 50:50 %(v/v %) was filtered through 0.45μ membrane filter before use, degassed and pumped from the solvent reservoir into the column at a flow rate of 1 ml/min. The detection was monitored at 232 nm and the run time was 5 minutes. The volume of injection loop was 4 μl and prior to the injection of the drug solution; the column was equilibrated for at least 30 minutes with the mobile phase flowing through the system. The column and the HPLC system were maintained at 45°c temperature.. Preparation of standard stock solution 50 mg of Naftopidil was accurately weighed and transferred into a 50 ml clean dry volumetric flask, and 30 ml of methanol and 20 ml of water was added, sonicated for 10 minutes to dissolve the contents and diluted to volume with water to get a concentration of 1mg/ml (stock 1). 5 ml of the above stock solution was transferred to a 25 ml volumetric flask and made up to the mark to get a concentration of 200 µg/ml (stock 2).. Preparation of sample solution 10 tablets of Naftopidil were accurately weighed and powdered. Transfer the powder equivalent to 50 mg of Naftopidil into 50 ml of clean, dry, volumetric flask. To this 30 ml of Methanol and was added and sonicated for about 10 minutes, further the volume was made up with diluent and then filtered through 0.45 micron filter. Further 1 ml of the filtrate was diluted to 10 ml with water.. METHOD DEVELOPMENT A C18 column (150×4.6mm, 3.5µ) as a stationary phase with a mobile phase of acetonitrile and water at a flow rate of 1.0 mL/min and a detection wavelength of 232 nm afforded the best separation of Naftopidil. The standard solutions prepared as above were injected into the 10 μl loop and the chromatogram was recorded as shown in fig 2. The retention time of Naftopidil was found to be 3.245 min. The calibration curve was constructed by plotting concentration versus peak area ratio. The amount of Naftopidil present in sample was calculated through the standard calibration curve. ASSAY Ten tablets each containing 50 mg were weighed accurately and powdered. A quantity equivalent to 50 mg of Naftopidil was weighed accurately and transferred to 50 ml volumetric flask containing 30 ml of methanol. The contents were sonicated for 20 min. and made up to the mark with the water. The resulting solution is filtered through 13 mm × 0.45µm PVDF. 1mL of the above solution was pipette into 10mL volumetric flask and made up with water. The solution obtained was diluted with the water so as to obtain a concentration in the range of linearity previously determined for the pure drug. The 20µl sample solution was injected under the chromatographic conditions and the chromatogram was recorded. The amount of Naftopidil present in tablet formulation was determined by comparing the peak area from the standard. The results were furnished in Table 1.. METHOD VALIDATION The optimized chromatographic method was completely validated according to the procedures described in ICH guidelines Q2(R1) for the validation of analytical methods(ICH,2005)[8]. www.ijpar.com.
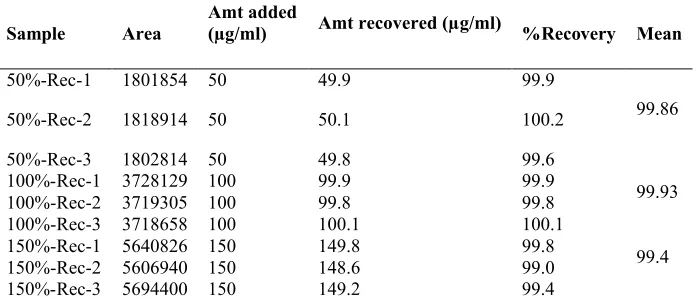
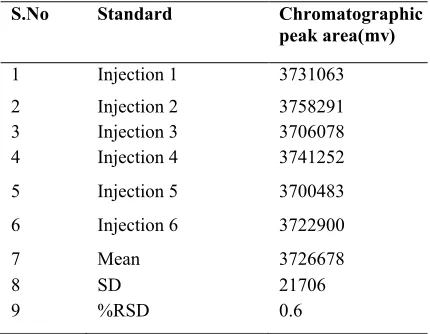
(3) 31 V.Gayathri et al / Int. J. of Pharmacy and Analytical Research Vol-1(1) 2012 [29-34]. LINEARITY AND RANGE The linearity experiment was carried out in triplicate to ascertain accuracy and precision of the method. The standard curve was obtained in the concentration range of 50-150 μg /ml. The peak area ratios of the drug versus concentration were found to be linear and the results are furnished in Table 2.The linearity was evaluated by linear regression analysis using the least square method. It was found that correlation coefficient and regression analysis are within the limits. The linearity graph was shown in fig 3. ACCURACY Accuracy of the method was performed by preparing the placebo of the drug formulation according to the formulation procedure. To the required quantity of placebo, a known quantity of Naftopidil with the same proportion as in the drug formulation was added to get three concentrations (50, 100, 150 µg/mL of Naftopidil). Results have shown that the recovery of Naftopidil is within 98.0–102%, and the RSD is lower than 2.0%. The results are shown in Table 3.. PRECISION Repeatability Repeatability of the method was evaluated by. calculating the RSD of the peak areas of six replicate injections for the standard concentration (100%) of Naftopidil, which was found to be 0.6%.The results are furnished in Table 4. Intermediate precision (ruggedness) The Intermediate precision method was also evaluated by analyzing six samples of Naftopidil by two analysts in the same laboratory using different HPLC systems. Results of this study showed that the percentage RSD of Naftopidil was 0.8% indicating a good intermediate precision of the method. The results are tabulated in Table 5. LIMIT OF DETECTION (LOD) AND LIMIT OF QUANTITATION (LOQ) The LOD and LOQ for Naftopidil were predicted basing on the parameters of standard error of estimate and slope, calculated from linearity of the response data of Naftopidil. The results were shown in Table 6. ROBUSTNESS The robustness was checked by changing the flow rate to 0.8 and 1.2 ml/ min, and column oven temperature 40°c to 50°c, did not affect peak response and retention time so the method suits best and the results are shown in Table 7.. Fig 2.Chromatogram of Naftopidil standard solution. www.ijpar.com.
(4) 32 V.Gayathri et al / Int. J. of Pharmacy and Analytical Research Vol-1(1) 2012 [29-34]. Table1 Quantitative estimation of Naftopidil in tablet dosage form S. NO.. Tablet Sample. Label Claim in mg/tablet. 1. Naftopidil. 50. Peak Area Test. Standard. 37281 29. 3772820. Amount found mg/tablet 49.4. Percentage content of Drug 98.81. Fig 3: Linearity graph for Naftopidil. Table 2: Linearity data of Naftopidil S.no.. Concentration (µg/ml). Area of the peak(mv). 1 2 3 4 5. 50 75 100 125 150. 1889821 2808562 3776483 4712756 5656587. Table 3: Accuracy data of Naftopidil. Sample. Area. Amt added (µg/ml). Amt recovered (µg/ml). 50%-Rec-1. 1801854. 50. 49.9. 99.9. 50%-Rec-2. 1818914. 50. 50.1. 100.2. 50%-Rec-3 100%-Rec-1 100%-Rec-2 100%-Rec-3 150%-Rec-1 150%-Rec-2 150%-Rec-3. 1802814 3728129 3719305 3718658 5640826 5606940 5694400. 50 100 100 100 150 150 150. 49.8 99.9 99.8 100.1 149.8 148.6 149.2. 99.6 99.9 99.8 100.1 99.8 99.0 99.4. www.ijpar.com. %Recovery. Mean. 99.86. 99.93 99.4.
(5) 33 V.Gayathri et al / Int. J. of Pharmacy and Analytical Research Vol-1(1) 2012 [29-34]. Table 4: Repeatability data of Naftopidil S.No. Standard. Chromatographic peak area(mv). 1. Injection 1. 3731063. 2 3 4. Injection 2 Injection 3 Injection 4. 3758291 3706078 3741252. 5. Injection 5. 3700483. 6. Injection 6. 3722900. 7 8 9. Mean SD %RSD. 3726678 21706 0.6. Table 5 intermediate precision of Naftopidil S.No. Sample solution. 1. Injection 1. Chromatographic peak area(mv) 3745879. 2. Injection 2. 3721458. 3. Injection 3. 3768542. 4. Injection 4. 3702368. 5. Injection 5. 3710245. 6. Injection 6. 3700365. MEAN. 3736542. STANDARD DEVIATION %R.S.D. 22546 0.8. Table 6: LOD and LOQ data of Naftopidil S.NO 1.. Name Naftopidil. LOD Value (µg/ml) 1.13. LOQ Value (µg/ml) 3.43. Table 7: Robustness data of Naftopidil Effect of variation in Column Oven Temperature Variation in column System suitability parameters temperature( ºC). oven Acceptance criteria. 40. 45. 50. Tailing factor. 0.931. 0.937. 0.921. NMT 2.0. Theoretical plates. 3092. 3460. 3103. NLT 2500. www.ijpar.com.
(6) 34 V.Gayathri et al / Int. J. of Pharmacy and Analytical Research Vol-1(1) 2012 [29-34]. Effect of variation in flow rate. Variation in flow(ml/min) System suitability parameters. Acceptance criteria. 0.8. 1.0. 1.2. Tailing factor. 0.921. 0.937. 0.916. NMT 2.0. Theoritical plates. 3361. 3460. 2945. NLT 2500. CONCLUSION A convenient and rapid RP- HPLC method has been developed for estimation of Naftopidil in bulk and tablet dosage form. The developed method is cheap, easy, and it gives sharp peak with high resolution. The assay provides a linear response across a wide range of concentrations. Low intra-. day % RSD coupled with excellent recoveries. The proposed method is highly precise accurate and robust analytical procedure and its RT is 3.245 min allows the analysis of larger number of samples in short period of time. So this developed method can be used for the routine analysis of Naftopidil in tablet dosage form.. REFERENCES [1] The merck index, twelfth edition p. no 6443 [2] Masumori N,‘Naftopidil for the treatment of urinary symptoms in patients with benign prostatic hyperplasia’, DOI: http://dx.doi.org/10.2147/TCRM.S13883, June 2011, Volume 2011:7, Pages 227 – 238. [3] Yin-Xiang Sun, Bi-Yun Huang, MuYuan, Jing-Shan Shi, Development of a chiral HPLC [4] Method for the analysis of Naftopidil enantiomers, Journal of Chinese Pharmaceutical Sciences, 200918(1):61-63 ISSN: 1003-1057 CN: 11-2863/R. [5] ZHAO Xia, SUN Pei-hong, ZHOU Ying, LIU Yu-wang, ZHAO Dong-fang, CUI Yi-min, SUN Zhongmin, “Determination of naftopidil in human serum by HPLC-fluorescence and study on its pharmacokinetics in healthy volunteers”, The Chinese Journal of Clinical Pharmacology, CNKI:ISSN:1001-6821.0.2007-03-015. [6] Townshend, Alan; Pulgarín, José A. Murillo2; Pardo, M. Teresa Alañón Analytical and Bioanalytical Chemistry, Volume 381, issue 4 (February 2005), p. 925-931. ISSN: 1618-2642 DOI: 10.1007/s00216004-2998-Springer-Verlag, Berlin/Heidelberg. [7] José A. Murillo Pulgarín, Aurelia Alañón Molina and María Teresa Alañón Pardo, “Direct determination of naftopidil by non-protected fluid room temperature phosphorescence” , Analyst, 2001, 126, 234–238 [8] D H Yu, L T Wan, Y Q Lou, “Methodological study of determination of naftopidil concentration in biological samples by HPLC” Yao Xue Xue Bao. 1995 ;30 (4):286-90 7660794. [9] CH,Q2(R1) Validation of Analytical Procedures: text and methodology:2005. www.ijpar.com.
(7)
Figure
Related documents
Walachowski S, Dorenlor V, Lefevre J, Lunazzi A, Eono F, Merbah T, Eveno E, Pavio N, Rose N (2014) Risk factors associated with the presence of hepatitis E virus in livers
Keywords: Spinal muscular atrophy (SMA), Health-related quality of life (HRQOL), Direct cost, Indirect cost, Informal care cost, Cost of illness (COI), Health care burden,
This study aimed to develop and pilot test an educa- tional video containing information regarding the in- formed consent process for trauma patients undergoing surgery, develop
Automated epileptic seizures detection using multi-features and multilayer perceptron neural network
This study provides a multi-channel EEG analysis for the detection of epileptic seizures using PSD, entropy, Teager energy, and MLPNN classifier.. Initially, EEG signals
The purpose of this study is to characterize the very eld- erly population, who received emergency general surgery, and examine their surgical outcomes including identifica- tion
The current endeavors for the sustainable development of metal free processes employing visible light has evoked considerable interest in organic synthesis [9-12],
suis cells were detected on PAECs incubated with the negative control preparation (Figure 5d).. To assess whether the presence
The aim of the current study was to use the Bjorck classification to report outcomes of a well- defined group of patients, (with grade 1 or 2 open abdo- mens derived from
