Available Online at www.ijpret.com
807
INTERNATIONAL JOURNAL OF PURE AND
APPLIED RESEARCH IN ENGINEERING AND
TECHNOLOGY
A PATH FOR HORIZING YOUR INNOVATIVE WORK
CLASSIFICATION OF ELECTROCARDIOGRAM (ECG) WAVEFORM USING A NOVEL
TECHNIQUE
PROF. A. S. DUDHE, PROF. N. U. CHIPDE, PROF. S. S. AYANE
Assistant Professor, Department of Information Technology, Babasaheb Naik College of Enginerring , Pusad
Accepted Date: 15/02/2014 ; Published Date: 01/04/2014
\
Abstract: Electrocardiogram (ECG) is the P-QRS-T wave, representing the cardiac function. The information concealed in the ECG signal is useful in detecting the disease afflicting the heart. It is very difficult to identify the subtle changes in the ECG in time and frequency domains. The Discrete Wavelet Transform (DWT) can provide good time and frequency resolutions and is able to decipher the hidden complexities in the ECG. In this work, three types of beat classes of arrhythmia as recommended by Association for Advancement of Medical Instrumentation (AAMI) were classified. The dimensionality reduction algorithm; Independent Component Analysis (ICA) was applied on DWT sub bands for dimensionality reduction. These dimensionality reduced features were fed to the neural network (NN); Multilayer Perceptron (MLP), Principal Component Analysis (PCA), Probabilistic Neural Network (PNN) and Support Vector Machine (SVM) classifiers for automated diagnosis.
Keywords: ECG, DWT, ICA, PCA, PNN, Neurosolutions
Corresponding Author: PROF . A. S. DUDHE
Access Online On:
www.ijpret.com
How to Cite This Article:
AS Dudhe, IJPRET, 2014; Volume 2 (8): 807-817
Available Online at www.ijpret.com
808 INTRODUCTION
The electrocardiogram (ECG) is the recording of the electrical property of the heartbeats, which provides a physician with a view of the heart’s activity through electrical signals generated during the cardiac cycle, and measured with external electrodes. Its clinical importance in cardiology is well established, being used for example to determine heart rate, investigate abnormal heart rhythms, and causes of chest pain. Due to the high mortality rate of heart diseases, early detection and precise discrimination of ECG arrhythmia is essential for the treatment of patients.
An arrhythmia is any abnormal cardiac rhythm [18]. Heart arrhythmias result from any disturbance in the rate, regularity, and site of origin or conduction of the cardiac electric impulse [19]. Classification of arrhythmia is an important step in developing devices for monitoring the health of individuals. The sequence of electrical signals of heart provides symptomatic information for classifying cardiac arrhythmias. Classification of normal and abnormal beats requires analysis of the ECG data.
A good performance of an automatic ECG analyzing system depends heavily upon the accurate and reliable detection of the QRS complex.QRS detection is difficult, not only because of the physiological variability of the QRS complexes, but also because of the various types of noise that can be present in the ECG signal. Noise sources include muscle noise, artifacts due to electrode motion, power-line interference, baseline wander and T waves with high-frequency characteristics similar to QRS complexes. In this work, digital filters and wavelet transforms are used reduce the influence of these noise sources, and thereby improve the signal-to-noise ratio, followed by QRS detection using Pan-Tomkins algorithm.
In this work the wavelet transformation based on a set of analyzing wavelets allowing the decomposition of ECG signal in a set of coefficients that is used for classification. Each analyzing wavelet has its own time duration, time location and frequency band. The wavelet coefficient resulting from the wavelet transformation corresponds to a measurement of the ECG components in this time segment and frequency band. Electrocardiography has a basic role in cardiology since it consists of effective, simple, noninvasive, low-cost procedures for the diagnosis of cardiovascular disorders that have a high epidemiological incidence and are very relevant for their impact on patient life and social costs.
Available Online at www.ijpret.com
809 In this work, the integration of independent component analysis and neural network classifiers to discriminate three types of ECG beats was evaluated. Four different neural networks, including a MPL with back-propagation neural network, PCA, PNN and SVM are employed for classification of ECG beats. The capabilities of the neural networks in coordinate with the ICA features were evaluated.
This work gives the fast and accurate solution to analyze and classify the different ECG beats by using FastICA Algorithm & SVM neural network. It is possible to detect the overall percentage accuracy of 93.36% beats detection in ECG by simply taking the ECG data and processing it to get the analytical results so that accurate diagnosis of patient can be done.
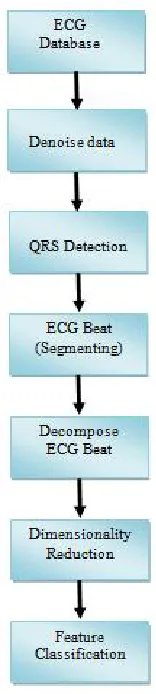
2. SYSTEM LAYOUT
The ECG signal downloaded from MIT-BIH database was subjected to wavelet based denoising using Daubechies D6 (‘db6’) wavelet basis function [23]. The ECG signals sampled at 360 Hz were decomposed up to 9 levels using db6 wavelet. The 9th level approximation sub band contains the frequency range of 0–0.351 Hz which is mainly the because of baseline wander, was not used for reconstructing the denoised signal [10]. Also the ECG would not contain much information after 45 Hz. Therefore the first and second level detail coefficients consisting frequency band of 90–180 Hz and 45–90 Hz respectively were not used for reconstructing the denoised ECG signal. The required sub bands, the 3rd, 4th, 5th, 6th, 7th, 8th and 9th level detail signals were only used (all other sub-band coefficients were replaced with zeros) for computing the reconstructing the original after denoising [23].
The QRS complex in the ECG is detected by using Pan Tompkins algorithm. The Pan Tompkins algorithm consists of taking derivatives, absolute/rectification operation, squaring, moving average integration and threshold operations [11]. After detection of QRS complex, 99 samples before the QRS peak and 100 samples after the peak and the QRS peak itself are considered as 200 samples segment as a single beat for the subsequent analysis [10].
Available Online at www.ijpret.com
810 Figure.2.1. System layout.
3. METHODOLOGY
3.1 QRS DETECTION: Pan-Tompkins Algorithm
This algorithm is used for QRS detection in real-time. Referring to general structure linear filtering is achieved by the bandpass filter & derivative operator whereas nonlinear transformation achieved by the squaring operator & moving-window (mov-win) integrator.
Available Online at www.ijpret.com
811 The algorithm for QRS detection in real time has been developed by Pan and Tompkins it has further been analyzed and described by Hamilton and Tompkins. The algorithm recognizes QRS complexes by analyzing slope and amplitude of ECG signals taking into account the width of appearing ECG waves.
Pan-Tompkins algorithm is intended for discrete-time ECG signals that have been obtained by sampling the true, continuous-time ECG signal at a rate of 200 samples/sec. This is true because the algorithm uses “integer” filters that realize pole and zero locations that are useful for the intended sampling rate, but become unreasonable for different sampling rates [11].
3.2 DIMENSIONALITY REDUCTION :-
Independent Component Analysis (ICA)
The step by step method of ICA is as follows.
Step P: Pre-processing
(a) Centering: Here the mean of the data was subtracted so that the average value of the signal would be zero as,
Where E{·} is the statistical expectation operator and N is the total number of patterns present
in the data.
(b) Whitening: If the data is not Gaussian distributed, it is made Gaussian by the whitening transformation,
Where
Available Online at www.ijpret.com
812 Step 1: Choose an initial weight vector w.
Step 2: Let
Where
and g’(u) is the derivative of g.
Step 3: Normalize W+ as,
Step 4: If W is not converged (W is said to be converged if its value does not change over next iteration), go to step 2.
After W is found from the above method, its inverse is computed to get matrix A. The weights in matrix A were used as features for subsequent pattern recognition. ICA method was applied independently on two DWT sub bands, 4th level approximation and detail. From each of the sub bands fifteen ICA components were used. So in total thirty features from the two sub bands were used for subsequent pattern recognition.
3.3 FEATURE CLASSIFICATION
In this work NEUROSOLTIONS for Excel was used for classifying the data by neural networks. Following are the some neural networks that are used in the work.
Multilayer Perceptron (MLP).
Principal Component Analysis (PCA).
Probabilistic Neural Network (PNN).
Support Vector Machine (SVM).
Available Online at www.ijpret.com
813 NeuroSolutions for Excel is an excel add-in that includes a limited version of NeuroSolutions which supports traditional linear regression techniques as well as probabilistic and multi-layer perceptron neural networks. It can also be integrated with any of the three levels of NeuroSolutions to provide a very powerful environment for manipulating your data, generating reports, and running batches of experiments.
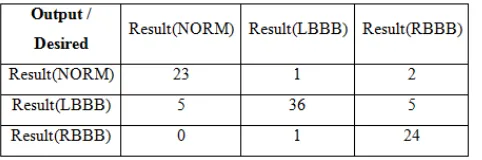
In this work the classification of ECG signal for normal beat (NORM) , left bundle branch block (LBBB), right bundle branch block (RBBB) have been done by using four different classifiers such as MPL, PAC, PNN, SVM through NeuroSolutions for Excel.60% samples were used for training, 15% were used for cross validation and 25% for testing. The correct classification or misclassification was assessed as True Positive (TP), True Negative (TN), False Positive (FP) and False Negative (FN). Based on these measures the sensitivity, specificity, precision and accuracy of a particular classifier were determined. Table 3.3.1, 3.3.2, 3.3.3 shows confusion matrix obtain from NeuroSolutions for Excel during training, cross validation and testing by using a SVM classifier respectively.
Table 3.3.1:-Confusion matrix obtained during training by SVM classifier.
Table 3.3.2:- Confusion matrix obtained during cross validation by SVM classifier.
Available Online at www.ijpret.com
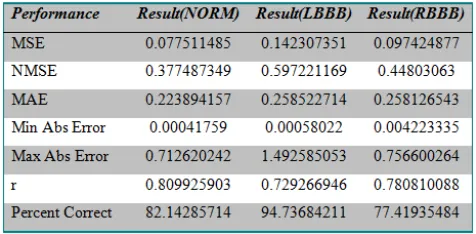
814 Table 3.3.4, 3.3.5, 3.3.6 shows performance table obtain from NeuroSolutions for Excel during training, cross validation and testing by using a SVM classifier respectively.
Table 3.3.4:- Performance table obtained during training by SVM classifier.
Table 3.3.5:- Performance table obtained during cross validation by SVM classifier.
Available Online at www.ijpret.com
815 4. Conclusion
The ECG signal depicts the electrical activity of the heart providing vital information about the cardiac state. In this work it was shown that ICA with combination of SVM classifier archives the highest average accuracy, sensitivity, precision and specificity of 93.36%, 90.80%, 89.62% and 95.16% respectively. The developed methodology in this work can be used in arrhythmia classification to detect the cardiac problems.
REFERENCE:
1. Hari Mohan Rai et al, “ECG Arrhythmia Classification using Daubechies Wavelet and Radial
Basis Function Neural Network”, Nirma University International Conference 4 On Engineering, NUiCONE-2012, 2013IEEE.
2. Amit K. Mishra et al “Local fractal dimension based ECG arrhythmia classification”,
Biomedical Signal Processing and Control 5, 2010 Elsevier, pp 114–123.
3. Dusit Thanapatay et al “ECG beat classification method for ECG printout with Principle
Components Analysis and Support Vector Machines”, 2010 International Conference on Electronics and Information Engineering (ICEIE 2010), 2010 IEEE volume 1 pp V1-72 - 75.
4. Mohamed cherif Nait-Hamoud, “Two Novel Methods for Multiclass ECG Arrhythmias
Classification Based on PCA, Fuzzy Support Vector Machine and Unbalanced Clustering” 2010 IEEE, pp 140-145.
5. Ayman Rabee et al “Ecg Signal Classification Using Support Vector Machine Based On
Wavelet Multiresolution Analysis”, IEEE 2012, pp 1319-1323.
6. Hari Mohan Rai et al “ECG Signal Classification using Wavelet Transform and Back
Propagation Neural Network” IEEE 2012,pp 1057-1064.
7. Alaa M. Elsayad” Classification of ECG arrhythmia Using Learning Vector Quantization Neural
Networks”, IEEE 2009, pp 139 - 143.
8. Mi Shen et al “Multi-lead ECG Classification based on Independent Component Analysis and
Support Vector Machine”, IEEE 2009, pp 960-964.
9. S.S. Anand, S. Yusuf, “Stemming the global tsunami of cardiovascular disease”, 2011, pp 529–
Available Online at www.ijpret.com
816
10.Roshan Joy Martis et al, “ECG beat classification using PCA, LDA, ICA and Discrete Wavelet
Transform”, Biomedical Signal Processing and Control 8, 2013 Elsevier Ltd, pp 437– 448.
11.J. Pan, W.J. Tompkins, “A real-time QRS detection algorithm”, IEEE Transactions on
Biomedical Engineering BME-32, 1985, pp 230–236.
12.R.J. Martis et al, “Application of higher order cumulants to ECG signals for the cardiac health
diagnosis, in: Engineering in Medicine and Biology Society”, Annual International Conference of the IEEE, 2011, pp. 1697–1700.
13.A. Hyvärinen, E. Oja, “Independent component analysis: algorithms and applications, Neural
Networks”, 2000, pp 411–430.
14.M. Jansen and P. Oonincx “Second generation wavelets and applications”, Springer, 2005.
15.S. Mallat, “A theory for multiresolution signal decomposition: the wavelet representation”,
IEEE 1989, pp. 674-693.
16.Farid Melgani et al, “Classification of Electrocardiogram Signals With Support Vector
Machines and Particle Swarm Optimization”, IEEE Transactions on Information Technology in Biomedicine, VOL. 12, NO. 5, 2008, pp 667-677.
17.G.D. Clifford, F. Azuaje, P.E. McShary, “Advanced Methods and Tools for ECG Data Analysis”,
Artech House, Norwood, MA, 2006.
18.M.S. Thaler, “The Only EKG Book You’ll Ever Need”, third ed., Lippincott / Williams &
Wilkins, Philadelphia, PA/Baltimore, MD, 1999.
19.H.V. Huikuri, A. Castellanos, R.J. Myerburg, “Sudden death due to cardiac arrhythmias”,
New England Journal of Medicine, 2001, pp 1473–1482.
20.E. D. Ubeyli, “Implementing wavelet transform/mixture of experts network for analysis of
electrocardiogram beats”, Expert system, Vol. 25, 2008, pp 150-162.
21.B.N. Singh, A.K. Tiwari, “Optimal selection of wavelet basis function applied to ECG signal
denoising”, Digital Signal Processing, 2006, pp 275–287.
22.M. Hadhoud, M. Eladawy, A. Farag, “Computer aided diagnosis of cardiac Arrhythmias”,
IEEE International Conference on Computer Engineering and Systems, 2006, pp. 262–265.
Available Online at www.ijpret.com