EFFECT OF AUDIT EDUCATION ON THE AUDIT
EXPECTATION GAP IN NIGERIA
Dr. S.A. Anichebe1 and Ugwu Hope Ifeyinwa2
1 Lecturer, Department of Accountancy, Chukwuemeka ojumegbu ojukwu University,Igbariam campus,
Anambra state.
2 M.Sc Research Scholar, Department of Accountancy, Chukwuemeka Odumegwu Ojukwu University,
Igbariam Campus, Anambra state.
1. INTRODUCTION:
Accounting and auditing professionals serve an absolutely vital role in our capital market; transparent informative and accurate financial reporting are the life blood of the capital market and are essential for investors to make informed decisions as to how to allocate their capital. External auditing is a credibility and reliability enhancement tool for effective and efficient functioning of business operations, the capital market and the entire economy. The potency of this tool was however called into serious questioning after some spectacular and well publicized multinational corporations like world Com, BCCI, ENRON etc. collapsed shortly after unqualified(“clean) audit reports has been issued on them.
The Nigerian Business environment witnessed financial scandals involving African Petroleum Plc, Cadbury Nig. Plc, Lever Brothers Plc and many financial institutions resulting from widespread fraud in which reputable audit firms and accounting professionals were implicated for fraudulent financial reporting and misleading the public (Appah 2010: Ihendimhu, 2007). These and similar circumstances fuelled widespread criticism and credibility and reliability of audit functions with investors, regulatory bodies, politicians and the general public pointing accusing fingers at auditors.
These criticism have risen due to the fact that the public expects the auditors to provide a complete error-free guarantee and accuracy of financial statements, including the discovering of fraud and irregularities, as against what auditors are actually required to do under the law and their professional code of practice.
Pierce and Kikommins(1996) provided evidence to show that some of the criticisms are based on society, lack of knowledge of company law and auditing standard and misunderstanding of the fundamental role of the external
auditors. In an earlier study, Tweedie(1981 p.20) noted that “ the public appears to require a burgular alarm system(i.e
protection against fraud). A radar station (i.e early warning of future insolvency, A safety net (i.e. general re-assurance of financial well being), an independent auditor (i.e. safeguards for independence), and A coherent communications (i.e. and understanding/interpretation of audit report). He concluded that the basic tenets of an audit have been
misunderstood by the public and this has resulted in user’s confusion and unreasonable expectation being imposed on the duties of the auditor.
Audit expectation Gap(AEG) is the difference in the perception of users of financial statements and the auditors as to the definite scope of audit function. It reflect a perceived difference between what the public expect from an audit and what the audit profession accepts. Adeyemi and Uadiate (2011) Lin and Clien(2004) reports the
Abstract: The Introduction of audit education could help to narrow down the audit expectation gap since the gap is largely suspected to be associated with ignorance and unreasonable expectations of the public (investor) being imposed on the duties of auditors. The study was carried out to determine if the introduction of auditing courses and enlightenment workshop training(lectures) to final year undergraduate of business administration and investing Public could be a factor in closing the gap. The study adopted the use of modified and validated five-point likert scale questionnaire that was distributed to four random selected group of participants, consisting of undergraduate student’s who have gone through audit course, practicing auditors, educated investor with knowledge of audit responsibilities and process and lastly the uneducated investors with no exposure to auditor coures or process. The result from the application of analysis of variance(ANOVA) and t-Test and Regression Analysis comparisons on the data gathered reveals that exposure to auditing courses significantly enhances the understanding of auditor responsibilities and can positively help in reducing the expectation gap. In conclusion, audit education has significant effect on audit expectation gap in Nigeria. The study recommends that accounting and auditing regulatory bodies should intensify effort to create publicity, means of enlightening the investing public and to introduce auditing courses as part of study curriculum in the tertiary institutions.
belief of the public and other users of financial statement that auditors should take more responsibility in detecting fraud, illegal acts and material misstatement and to perform better communication in the nature and result of audit, including giving an early warning about the possibility of corporate failure in the near future. This tall expectation and belief by the public, undoubtedly, butters public dissatisfaction with the performance of auditors. It is evidently the cause of misjudgement and unending blame heaved on auditors and the entire accounting profession each time a firm is reported to have gone bankrupt.
Lee, Azham and Shamini (2009) noted that audit profession believes the increase in litigation against and criticism of auditors can be traced to audit expectation gap.
Audit education involves the process of enlightening training and creating awareness on the statutory duties of auditors to users of financial statement(information) and aim at improving their level of understanding of the functions of an audit process and thus bridging the gap between expectations of the public and performance of the audit.
2. OBJECTIVE OF THE STUDY:
The main objective of the study is to examine the extent to which audit education has helped to reduce the expectation gap in Nigeria.
Hypothesis
Hypothesis that will guide the study
H0 - Acquiring knowledge (education) on statutory responsibilities of Auditor has not helped in reducing the audit
expectation gap in Nigeria.
H1- Acquiring knowledge (education) on the statutory responsibilities of audit work has helped in reducing the audit
expectation gap in Nigeria to a large extent.
3. REVIEW OF RELATED LITERATURE:
Dana (2005) examined audit expectation gap in public sector in Romania using primary data, questionnaire technique on 352 students and the study revealed that there is gap between the expectations of student regarding the public auditors' profession and their results and there are differences between level of knowledge of the students regarding the statements in audit and the expectation gap. The study also revealed that there is significant difference in perceptions of the role of the public auditor in respect of fraud detection. Also, Fowzia Rehana(2010) using the same primary data as Dana above did An Empirical Study on Audit Expectation Gap with the Role of Auditing Education in Bangladesh as a case study, the study showed that audit education has significant effect in narrowing the audit expectation gap.
Mahadevaswamy and Salehi (2008) did a review on Audit Expectation Gap, Auditor Responsibilities, Comparing India and Iran the results found that wide audit expectation gaps in both the countries in the area of
auditors’ responsibilities exist. There were no much differences between the opinion of auditors as well as investors in both countries. Pierce and Kilcommins (1996) examined the role of audit education on audit expectation, The results from the study indicated a significant reduction (at the .05 level) in all elements of the misunderstanding gap for those groups who had studied either a module or a course in auditing during the period but not for any of the other groups. Kamau (2013) also using linear regression and correlation analysis examined the Determinants of Audit Expectation Gap: Evidence from Limited Companies in Kenya. The study found that some factors suggested by the literature significantly affected the audit expectation gap among companies in Kenya. The rest of the factors tested were found not to have a significant effect on the audit expectation gap.
Research done in Nigeria unlike those carried out in other countries used more of ANCOVA and ANOVA in analyzing collected data. Adeniyi and Oluwatoyin (2014) examined impact of auditing education on audit expectation gap in Nigeria, They used primary data method and ANOVA to analyze collected data, this result showed that knowledge and exposure of accounting students makes a positive impact on reducing existing audit expectation gap. Also, Onulaka (2014) investigates if identified gaps have any significant effect in the volume of transactions in the Nigerian market. Chi-Square techniques was used to analyze data obtained, The study indicates that there is wide
expectation gap in the areas of auditor’s responsibility for fraud prevention and detection and also indicated that audit expectation gap has negative impact on the volume of transaction in the Nigerian Stock Exchange.
Abubakar and Ojemen using Chi-Square as Onulaka above examined the level and nature of expectation gap (performance gap) between auditors and users of financial statements. It sought to establish whether audit expectation
gap exists in Nigeria and the perception of the users’ group on its existence. The study indicated that there is a wide expectation gap in the areas of auditors’ responsibility for fraud prevention and detection. Audit expectation gap has
that there is significant improvement in their perception of the key components based on industry work experience of the students.
Enyi, Ifurueze and Rachael (2012) examined factors contributing to Audit expectation gap problem in Nigeria using chi-square analysis and analysis of variance (ANOVA), The study showed that audit expectation gap is associated with the independent audit function, Also Some of the causes of an audit expectation gap may be traced to
audit objectives, auditor’s obligation to detect and report fraud, auditor independence, and the third party liability of
auditors, quality of profession’s performance, its objectives and results and that which the society expects.
Many scholars has researched on this topic, The researcher noticed that many who examined audit education and audit expectations centered their work of mostly on the undergraduates and auditors, For the addition into the body of knowledge, This research includes a survey into the investing public, Considering both educated and uneducated investors in Nigeria
3.1 Theoretical Framework
The study was anchored on a number of theories.
These theories, which are briefly discussed and related to the study include: (i) The Role Theory;
(ii) The Agency Theory.
The Role Theory: This provides a theoretical explanation for the existence of an audit expectation gap. Based on role theory, an auditor can be viewed as occupying a status or position as a profession in the social system. Due to
the „position‟ of a „profession‟, auditors are required to comply with the prescriptions ascribed to them by the society.
„Failure to conform to the ascribed role or to meet role expectations creates the risk of social action to enforce conformity and to penalize nonconformity‟ (Davidson, 1975). According to Davidson (1975), „the role of the auditor
is subject to the interactions of the normative expectations of the various interest groups in the society (that is, different role senders) having some direct or indirect relationship to the role position.‟ He noted that these different groups (for example, management, the securities and exchange commission, institutional investors, analysts, auditors, accountants, etc.) may hold varying expectations of the auditor and these expectations may change from time to time depending on the re-specification of their own role requirements and the interaction of other forces in the society. Hence, the auditors are placed in multi-role and multi expectation situations. For the purpose of the study, stock brokers, investors, private accountants and management were used as role senders of the auditors.
The Agency Theory: In agency theory, a principal delegates decision making responsibility to an agent; in the case of a company the agents are the directors /managers. The theory implies entrusting resources to the agent and in turn these agents must usually produce a report regarding the use of resources both in quantitative and qualitative
manner. Those entrusted with decision making authority are generally regarded as having a duty of „accountability‟ a
duty to demonstrate how they managed the resources entrusted to them. Audit serves a fundamental purpose in promoting confidence and reinforcing trust in financial information. Agency theory is a useful economic theory of accountability that helps to explain the development of the audit.
Agency theory posits that agents have more information than principals and that this information asymmetry
adversely affects the principals‟ ability to monitor whether or not their interests are being properly served by the
agents. Agency theory is based on this relationship between investors (principals) and managers (agents). An audit provides an independent check on the work of agents and of the information provided by an agent which, helps to maintain confidence and trust, (ICAEW, 2005). The simplest agency model assumes that no agents are trustworthy and if an agent can make himself better off at the expense of a principal then he will. Auditing is a means of monitoring that will lead to an overall reduction of agency costs (Ng, 2002).
3.2 Overall Objectives of the Auditor
In conducting an audit of financial statements, the overall objectives of the auditor are:
(a) To obtain reasonable assurance about whether the financial statements as a whole are free from material misstatement, whether due to fraud or error, thereby enabling the auditor to express an opinion on whether the financial statements are prepared, in all material respects, in accordance with an applicable financial reporting framework;
(b) To report on the financial statements, and communicate as required by the international standard in Audit, in
3.3 An Audit of Financial Statements
ISA 200, (2009) The purpose of an audit is to enhance the degree of confidence of intended users in the financial statements. This is achieved by the expression of an opinion by the auditor on whether the financial statements are prepared, in all material respects, in accordance with an applicable financial reporting framework. In the case of most general purpose frameworks, that opinion is on whether the financial statements are presented fairly, in all material respects, or give a true and fair view in accordance with the framework. An audit conducted in accordance with ISAs and relevant ethical requirements enables the auditor to form that opinion.
4. METHODOLOGY:
A cross sectional survey was used in other to test the research hypothesis to help achieve the objective of the research.
4.1 Population sample Size and Technique
The population of the participant in the research from which the sample was drawn comprised of final year undergraduate students of Business Administration and Finance of UNIZK with exposure of audit courses and
practicing auditors from reputable audit firms and two class of investing public “educated and uneducated investors.
Three hundred and fifty respondents were chosen from the population of study but two hundred and ninety respondent information were collected and useful and reasonable for the study, comprising of ;
Table 1
Respondent of 290 recovered from population
Total
Final Year undergraduate 93
Practicing auditors 75
Uneducated investors 60
Educated investors 62
Source: authors 2018
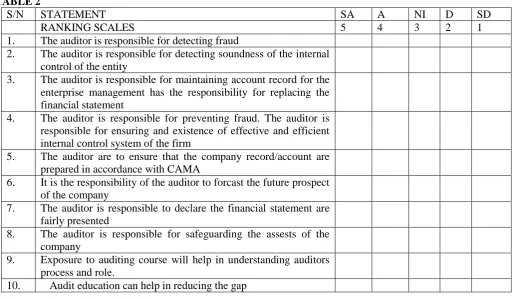
The study is based solely on primary data obtained through a structured questionnaire containing ten question addressing the expected responsibilities of auditors by the investors and the effect of education on investors.
TABLE 2
S/N STATEMENT SA A NI D SD
RANKING SCALES 5 4 3 2 1
1. The auditor is responsible for detecting fraud
2. The auditor is responsible for detecting soundness of the internal control of the entity
3. The auditor is responsible for maintaining account record for the enterprise management has the responsibility for replacing the financial statement
4. The auditor is responsible for preventing fraud. The auditor is responsible for ensuring and existence of effective and efficient internal control system of the firm
5. The auditor are to ensure that the company record/account are prepared in accordance with CAMA
6. It is the responsibility of the auditor to forcast the future prospect of the company
7. The auditor is responsible to declare the financial statement are fairly presented
8. The auditor is responsible for safeguarding the assests of the company
9. Exposure to auditing course will help in understanding auditors process and role.
10. Audit education can help in reducing the gap
For the purpose of the study, five (5) point likert scale was used to represent the response and ranked appropriately.
Strongly Agree (SA) 5 point
No idea (NI) 3 point
Disagree (D) 2 point
Strongly disagree (SD) 1 point
Questionnaire analysis; table 2
s/n SA
5
A 4
NI 3
D 2
SD 1
Q1 60 196 5 0 0
SCORE 300 784 15 0 0
Q2 0 91 11 166 166
SCORE 0 364 33 166 166
Q3 0 0 20 238 238
SCORE 0 0 60 238 238
Q4 0 42 60 92 93
SCORE 0 168 180 190 93
Q5 0 70 2 143 61
SCORE 0 280 6 122 143
Q6 40 35 21 39 155
SCORE 200 140 63 78 155
Q7 290 0 0 0 0
SCORE 1,450 0 0 0 0
Q8 0 0 0 61 229
SCORE 0 0 0 122 229
Q9 230 49 11 0 0
SCORE 1150 196 33 0 0
Q10 280 10 0 0 0
SCORE 1400 40 0 0 0
Source; field survey 2018
5. ANALYSIS AND RESULT DISCUSSION:
Table 3: ANOVA Result on the knowledge of variance that exist in the perception respondent Anova: Two-Factor
With Replication
SUMMARY 784 56 0 15 Total
0
Count 1 1 1 1 4
Sum 364 44 166 33 607
Average 364 44 166 33 151.75
Variance #DIV/0! #DIV/0! #DIV/0! #DIV/0! 23654.9
0
Count 1 1 1 1 4
Sum 0 64 238 60 362
Average 0 64 238 60 90.5
Variance #DIV/0! #DIV/0! #DIV/0! #DIV/0! 10526.3
0
Count 1 1 1 1 4
Sum 168 190 93 180 631
Average 168 190 93 180 157.75
Variance #DIV/0! #DIV/0! #DIV/0! #DIV/0! 1944.25
0
Count 1 1 1 1 4
Average 280 122 143 6 137.75
Variance #DIV/0! #DIV/0! #DIV/0! #DIV/0! 12622.9
200
Count 1 1 1 1 4
Sum 140 78 155 63 436
Average 140 78 155 63 109
Variance #DIV/0! #DIV/0! #DIV/0! #DIV/0! 2051.33
1450
Count 1 1 1 1 4
Sum 0 0 0 0 0
Average 0 0 0 0 0
Variance #DIV/0! #DIV/0! #DIV/0! #DIV/0! 0
0
Count 1 1 1 1 4
Sum 0 122 229 0 351
Average 0 122 229 0 87.75
Variance #DIV/0! #DIV/0! #DIV/0! #DIV/0! 12174.9
1150
Count 1 1 1 1 4
Sum 196 0 0 33 229
Average 196 0 0 33 57.25
Variance #DIV/0! #DIV/0! #DIV/0! #DIV/0! 8798.25
1400
Count 1 1 1 1 4
Sum 40 0 0 0 40
Average 40 0 0 0 10
Variance #DIV/0! #DIV/0! #DIV/0! #DIV/0! 400
Total
Count 9 9 9 9
Sum 1188 620 1024 375
Average 132 68.88889 113.77778 41.66667
Variance 17740 4409.111 9156.9444 3319.75
ANOVA
Source of Variation SS df MS F P-value
Sample 106458 8 13307.25 65535 #NUM!
Columns 45970.31 3 15323.435 65535 #NUM!
Interaction 170548.4 24 7106.1852 65535 #NUM!
Within 0 0 65535
Total 322976.8 35
The table indicates the existence of variance given the average in each of the different respondents the questionnaire, except for question no 6 and the then overall summary sows a positive variance= 3319.75 and mean square(MS) of interaction at 7106.185.
Table 4: T-test: two-sample assuming unequal variance.
t-Test: Two-Sample Assuming Unequal Variances
300 15
Mean 466.6667 41.66666667
Variance 433125 3319.75
Observations 9 9
Hypothesized Mean Difference 0
df 8
t Stat 1.929948
P(T<=t) one-tail 0.044864
t Critical one-tail 1.859548
P(T<=t) two-tail 0.089728
t Critical two-tail 2.306004
The table shows the comparison between investors who were exposed to audit courses and investor with no knowledge of audit process at all. With mean score educated 466.666? and 41.667 for uneducated and with the resulting T start 1.929948 indicating a t-critical two tail 2.306004 indicating higher t-critical two tail 2.306004 indicating a positive significant relationship to education.
P(T<-T)2.
Table 5: ANOVA Single factor
Anova: Single
Factor
SUMMARY
Groups Count Sum Average Variance
Column 1 10 4500 450 387777.7778
Column 2 10 1972 197.2 58279.28889
Column 3 10 676 67.6 3935.822222
Column 4 10 1024 102.4 9434.044444
Column 5 10 390 39 3022
ANOVA
Source of
Variation SS df MS F P-value
Between Groups 1113487 4 278371.68 3.009755888 0.0277333
Within Groups 4162040 45 92489.78667
Total 5275527 49
The table reveals the result from the four groups of respondent to the Ten Structured question and given the significant level statistical 0.05, the P.Value shows 0.0277333 lower than 0.05 which indicate that the study rejects the Null hypothesis.
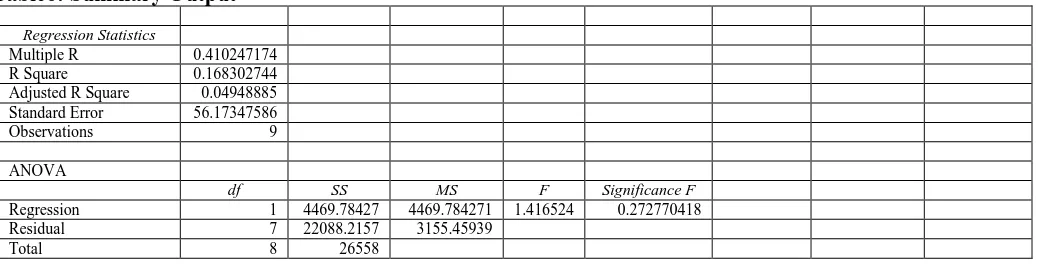
Table6: Summary Output
Regression Statistics
Multiple R 0.410247174
R Square 0.168302744
Adjusted R Square 0.04948885
Standard Error 56.17347586
Observations 9
ANOVA
df SS MS F Significance F
Regression 1 4469.78427 4469.784271 1.416524 0.272770418
Residual 7 22088.2157 3155.45939
Coefficients
Standard
Error t Stat P-value Lower 95% Upper 95% Lower 95.0%
Upper 95.0%
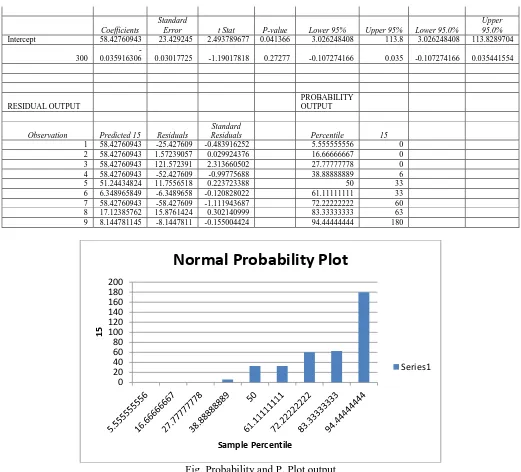
Intercept 58.42760943 23.429245 2.493789677 0.041366 3.026248408 113.8 3.026248408 113.8289704
300
-0.035916306 0.03017725 -1.19017818 0.27277 -0.107274166 0.035 -0.107274166 0.035441554
RESIDUAL OUTPUT
PROBABILITY
OUTPUT
Observation Predicted 15 Residuals
Standard
Residuals Percentile 15
1 58.42760943 -25.427609 -0.483916252 5.555555556 0
2 58.42760943 1.57239057 0.029924376 16.66666667 0
3 58.42760943 121.572391 2.313660502 27.77777778 0
4 58.42760943 -52.427609 -0.99775688 38.88888889 6
5 51.24434824 11.7556518 0.223723388 50 33
6 6.348965849 -6.3489658 -0.120828022 61.11111111 33
7 58.42760943 -58.427609 -1.111943687 72.22222222 60
8 17.12385762 15.8761424 0.302140999 83.33333333 63
9 8.144781145 -8.1447811 -0.155004424 94.44444444 180
Fig. Probability and P. Plot output
The result reveals figures which when compared with statistical sig-level such like p-value of 0.05 vs 0.041366 and upper and lower case level % of 95%. Agnees to reject the Null hypothesis and indicates that Education is positively significant to narrowing the audit expectation gap.
6. CONCLUSION:
Since the European Enroll and globacom and Nigeria companies collapse, considerable debate about the scope of responsibilities of auditor that inspired the expectation gap which actually is the difference between what auditors actually do and what third parties think auditors should do in conducting the audit practice. the research concluded that audit expectation gap exist in Nigeria with great possibility of reducing the gap but a total elimination of the gap may never be possible from the study, it became a knowledgeable fact that final year Business finance Students undergone audit course has the same perception of audit responsibility and nature as the educated investor unlike the uneducated investor whose ignorance of audit process and regulation expresses a gap, hence, education is an effective approach towards narrowing the audit expectation gap.
REFERENCES:
1. Bernard Pierce and Mary Kilcommins (1996). The audit expectations gap: the role of auditing education, DCU Busines School research paper series. Vol 13. Retrieved from www.doras.dcu.ie/2148
2. Charles Guandaru Kamau (2013). Determinants of Audit expectationgap: evidence from limited companies in Kenya. Internatinal Journal of Science and Research (IJSRN) Vol 2(1). Retrieved from www.ijsr.net
0 20 40 60 80 100 120 140 160 180 200
15
Sample Percentile
Normal Probability Plot
3. Fowzia Rehana (2010) An Empirical Study on Audit Expectation Gap: Role of Auditing Education in Bangladesh. Munich personal Repec Archieve retrieved from https://mpra.ub.uni-muenchem.de/22708/ 4. Gherai Dana (2005) Audit expectation gap in the public sector in Romania retrieved from
https://ideas.repec.org/a/ora/journl/v1y2011i2p510-516.html
5. G.H. Mahadevaswamy and Mahdi Salehi(2008). Audit expectation gap in Auditor responsibilities: comparison between India and Iran, International Journal of busness and management. Vol 3(11)
6. Idowu Adeniyi and Adebayo Oluwatoyin (2014). Impact of Auditing on Audit expectation gapin Nigeria, international Journal of academic research in accounting, finance and management science. Vol 4(3).
7. John Uzoma Ihendinihu1 & Silvia Nwakaego Robert (2014). Role of Audit Education in Minimizing Audit Expectation Gap (AEG) in Nigeria, International Journal of Business and Management; Vol. 9(2) retrieved from www.ccsenet.org
8. Oseni Abubakar and Ehimi Ojemen EXISTENCE AND NATURE OF AUDIT EXPECTATION GAP:
NIGERIAN. PERSPECTIVE, Asian Economic and Financial Review. Vol 2(8) retrieved from www.aessweb.com/pdf-files/1051-1063.pdf
9. Paul Onulaka (2014) Effect of Audit expectation gap in Nigerian capital market, International Journal of accounting and financial reporting. Vol 4 (2). Retrieved from www.macrothink.org/ijafr