UK Journal of Pharmaceutical and Biosciences Vol. 3(5), 46-59, 2015 RESEARCH ARTICLE
Inclusion of Different Levels of Eucalyptus Oil: An
In Vitro
Trial to Study the Effect on
Sheep Rumen Methanogenesis and Fermentation Processes
Tisa Mukharji, Meera Srivastava
*Post Graduate Department of Zoology, Govt. Dungar College, Bikaner 334001, Rajasthan, India
Article Information Received 9 May 2015
Received in revised form 26 Aug 2015 Accepted 28 August 2015
Abstract
An in vitro trial was conducted in fermentation vessels under anaerobic conditions using
composite feed-1 and composite feed-2 with inclusion of different levels of Eucalyptus oil (EO)
along with buffered rumen liquor of sheep to observe the effects of oil on rumen methanogenesis
and fermentation. The CF-1 consisted of 40% of concentrate and CF-2 had 25 % of concentrate.
The various concentrations of EO used in present study were 0.5,1 and 2 µl/ml. During the
present investigation it was observed that on increasing concentration of EO in CF-1 and CF-2
resulted in linear decrease in total gas production up to 74.26% in CF-1; and 31.01% by inclusion
of EO in CF-2, respectively. The findings suggest that decrease in total gas production and
methane concentration was highly pronounced in CF-1 compared to CF-2. The rumen
digestibility in CF-1 and CF-2 also decreased significantly (p < 0.01) from control. A significant
decrease in NH3 –N compared to control was also documented. As EO in both the feeds was
found to inhibit deamination activity, the ammonia production decreased with increase in the
efficiency of protein utilization. The inclusion of the oil decreased the Total Volatile Fatty Acids
(TVFA) concentration significantly (p < 0.01). The A:P ratio increased by inclusion in CF-2 but not
in CF-1. The pH was effected on inclusion of EO in CF-2 whereas inclusion of EO in CF-1
exhibited non significant effect. Therefore, the difference in Volatile Fatty acids (VFA) pattern
due to essential oil might be because of different diets and pH in different experiments. The
inclusion of EO decreased the protozoa number significantly (p < 0.01). EO was found to
decrease fermentation in a manner that even at 0.5 µl/ml concentration there was a significant
decrease in GP, ME, SCFA, TDDM and MBP. It could therefore be envisaged that increasing the
proportion of concentrate in diets and using EO as a feed additive increases the rumen efficiency
by reducing the methane concentration and gas production. Keywords:
Methanogenesis, Fermentation, Eucalyptus oil, Sheep rumen
*
Corresponding Author: E-mail: [email protected] Mob.: +919414324806
1 Introduction
The concerted activities of different groups of microorganisms
ferment the food in rumen to volatile fatty acids, which serve as an
energy source for the animal. Carbon dioxide and methane are
amongst the by-products generated during the process of
fermentation. Methanogenesis is one of the essential metabolic
process in the rumen to maintain steady state fermentation, as this
scavenges the molecular hydrogen generated during fermentation.
Depending upon the nature of feed, methane produced in the rumen
has 13.15 kcal/g of energy resulting in a 3-12% loss of gross energy
intake1. Also, methane has a greenhouse effect and is responsible
for 15% of global warming2. Globally, ruminants produce about
77×1012 g (77 Tg) methane annually, which constitutes about 15%
of total atmospheric methane emission3. Different chemicals and
microbial feed additives have been used by various workers to
reduce methane emission by using 4,5and some plant secondary
metabolites have also been tested recently6,7, but most of them
either have adverse effects on nutrient utilization or are economically
unfeasible. The chemical composition of feed influences the extent of
methanogenesis and therefore, it appears that manipulation of
feeding strategies might be one of the easiest mode of controlling
UK Journal of Pharmaceutical and Biosciences
Available at www.ukjpb.com
UK J Pharm & Biosci, 2015: 3(5); 47 enteric methane emission. Sheep is one of the important ruminant
livestock for global agricultural economy and contributes to
sustainable agriculture. Like other ruminant, it has rumen, reticule
and abomasums and the fermentation process takes place in sheep
rumen leading to generation of methane. A group of Archaea known
collectively as methanogens produce methane in the rumen and hind
gut of sheep which belong to the phylum Euryarcheota. It has been
suggested that a decrease in methane emission by up to 80% in vitro
and about 25% in vivo is possible by addition of oils to ruminant
diets8. With the afore mentioned view, it was planned to conduct an
experiment to evaluate anti-methanogenic activities in the rumen of
sheep (in vitro) induced by admixing eucalyptus oil with feed and to
adjudge the reduction in enteric methane emission.
2 Materials and method
The present study was carried out in the laboratory of Central sheep
and Wool Research Institute, Arid Region Campus, Beechwal,
Bikaner where the experimental animal sheep, Ovisaries were being
maintained. They were kept here in different sectors, sent for grazing
in the fields and water was provided adlib.Five experimental animals
were chosen in the study from which the rumen liquor was collected
for investigations.
2.1 Preparation of composite feed-1 (CF-1) and composite feed-2
(CF-2)
The mature grass of Sewan (L.sindicus) was harvested from the
experimental farm of Arid Region Campus, Central Sheep and Wool
Research Institute, Bikaner. A sewan based two types of composite
feed mixtures viz.. CF-1 and CF-2 were prepared that had roughage
to concentrate ratio of 60:40 and 75:25 respectively. The concentrate
mixture was composed of maize, groundnut cake (GNC), barley,
mineral mixture and common salt. Besides these, CF-2 also
consisted of wheat bran as given in table 1. Further, they were used
as the substrate for in vitro experiments. The feed ingredients were
oven dried at 70ºC and ground to pass through 1.5mm sieve to
prepare complete feed subjected to in vitro studies. In this prepared
composite feed mixture, eucalyptus oil was added at three levels of
inclusion (0.5, 1 and 2%).
2.1.1Chemical analysis of composite feeds
Standard methods were used to determine organic matter9; Neutral
detergent fibre (NDF), Acid Detergent Fibre (ADF) and
Hemicellulose, cellulose and lignin10; Crude protein was determined
by Kjeldahl technique9; Condensed Tannin (CT)11 and Total phenol12.
Cellulose was calculated as a loss during 72% acid treatment;
Difference between neutral detergent fibre and acid detergent fibre
was used as measure to assess Hemicellulose .
2.1.2 In vitro gas production
The incubation media was prepared for the present study13.
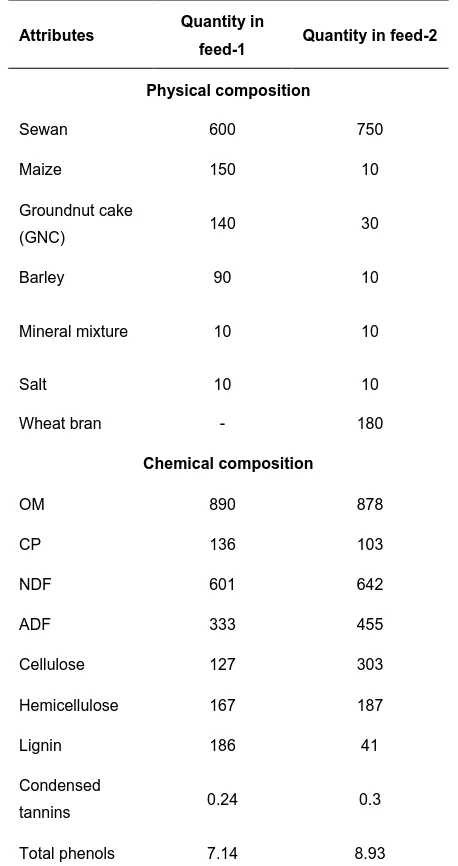
Table 1: Physical and chemical composition of composite
feed-1 & 2 (g/Kg DM)
Attributes Quantity in
feed-1 Quantity in feed-2
Physical composition
Sewan 600 750
Maize 150 10
Groundnut cake
(GNC) 140 30
Barley 90 10
Mineral mixture 10 10
Salt 10 10
Wheat bran - 180
Chemical composition
OM 890 878
CP 136 103
NDF 601 642
ADF 333 455
Cellulose 127 303
Hemicellulose 167 187
Lignin 186 41
Condensed
tannins 0.24 0.3
Total phenols 7.14 8.93
Organic matter (OM), Crude protein (CP), Neutral detergent fibre (NDF), Acid detergent fibre (ADF).
2.1.3 Preparation of inoculums
Rumen liquor was collected using a stomach tube under low vacuum
from five mature sheep managed on L. sindicus (sewan), dominated
pastured and each receiving 300g/d concentrate supplement. The
collected rumen liquor was immediately transferred into pre-warmed
thermo flask and was taken to the laboratory. The rumen liquor was
filtered through two layers of muslin cloth, before mixing with buffer
under carbon dioxide flux. All the solutions were poured in Woulff
flask, mixed with magnetic stirrer, warmed to 39ºC in water bath with
Srivastava et al. Inclusion of Different levels of Eucalyptus Oil
UK J Pharm & Biosci, 2015: 3(5); 48 plate 3 after solution became clear, rumen liquor was added to it in
following order (Table 2):
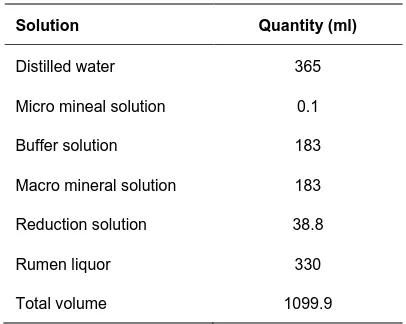
Table 2: Preparation of inoculumns
Solution Quantity (ml)
Distilled water 365
Micro mineal solution 0.1
Buffer solution 183
Macro mineral solution 183
Reduction solution 38.8
Rumen liquor 330
Total volume 1099.9
After complete rumen liquor buffer was prepared its pH was determined using digital pH meter.
2.1.4 In vitro gas production test
The gas production was determined13.Further, in vitro dry matter
degradability was determined14and OMD%13, ME and SCFA15 were
calculated.
2.2 Estimation of methane on Gas Liquid Chromatography
2.2.1 Standard
The standard gas for methane estimation consisted of 50% methane
and 50% carbon dioxide of this mixture 10l was injected with help of
100 l Hamilton gas tight syringe in the column.
2.2.2Sample
The gas produced in fermentation was directly used for methane
estimation by injecting 10l of sample gas in methane column.
Condition for methane estimation
A. (i) The detector used was flame ionizing detector (FID)
(ii) Stainless steel column was used.
B. Flow rate
(i) Nitrogen 5kg/cm2
(ii) Hydrogen 2kg/cm2
(iii) Air 2kg/cm2
The rate of gas flow was regulated by pressure valves provided in
cylinder and after opening the valves of cylinder, the nitrogen
cylinder was opened and was made to flow alone till FID and column
oven reached to temperature of 60ºC after that hydrogen and air
valves were opened and flame was lighted with flame lighter, then
sample was injected in column at injecting port.
Temperature
Injector oven 50ºC
Column over 60ºC
Detector over 60ºC
Sample size 100ml
Calculation
After completing the estimation of methane gas the hydrogen and air
cylinder were closed then cooling program was switched on, when
oven reached to temperature below 50ºC, oven gates were opened
and nitrogen supply was closed down and power supply was
switched off.
2.3 Protozoan count
The Protozoa number was determined or counted16.
2.4 Chemical analysis of rumen liquor
Total-N was estimated using Kjeldahl method9; Estimation of volatile
fatty acid was done employing gas liquid chromatography;
Ammonia-nitrogen content was also estimated17.
2.5Statistical analysis
The analysis of data was done using SPSS version 10.0 and was
subjected to one way ANOVA and significant differences were
separated by using Duncan's Multiple Range test.
3 Results
3.1 Effect of various levels of eucalyptus oil (EO) on different
attributes of composite feed-1 (CF-1)
The effects of adding various levels of eucalyptus oil (EO) on CF-1
(60:40) related to gas production and digestibility are presented in
table 3. The effect of adding various levels eucalyptus oil (EO) on
total gas productions at different hours is shown in fig.1.The total gas
productions (ml/g DM) in respect to various levels of EO in CF-1
viz.,0,0.5, 1 and 2 (µl/ ml) was observed to be 147.60,102.10,74.10
and 46.60 respectively. The comparison of the three treatments of
EO (0.5,1and 2µl/ml) showed a significant decrease (p< 0.01) with
respect to control and also with each other.The methane gas
concentration(l/kg dm) was recorded to be 22.23, 6.55, 2.79 and
0.235 at 0,0.5,1 and 2 µl/ml levels of EO respectively. The three
treatments of EO showed a significant decrease (p< 0.01) in
methane concentration when compared with control, but when the
three treatments were compared among themselves after 1 µl/ml of
UK J Pharm & Biosci, 2015: 3(5); 49 to 0,0.5,1 and 2 (µl/ml) of EO in CF-1 was observed to be 6.97, 5.89,
5.11 and 4.76 (MJ/Kg DM);and SCFA to be 0.5619, 0.3854, 0.2577
and 0.2011(µMol) respectively. A significant decrease (p < 0.01) was
shown by three treatments of EO in ME and SCFA when compared
with control, but when the three treatments were compared between
themselves after 1 µl/ml a non significant decrease was found.
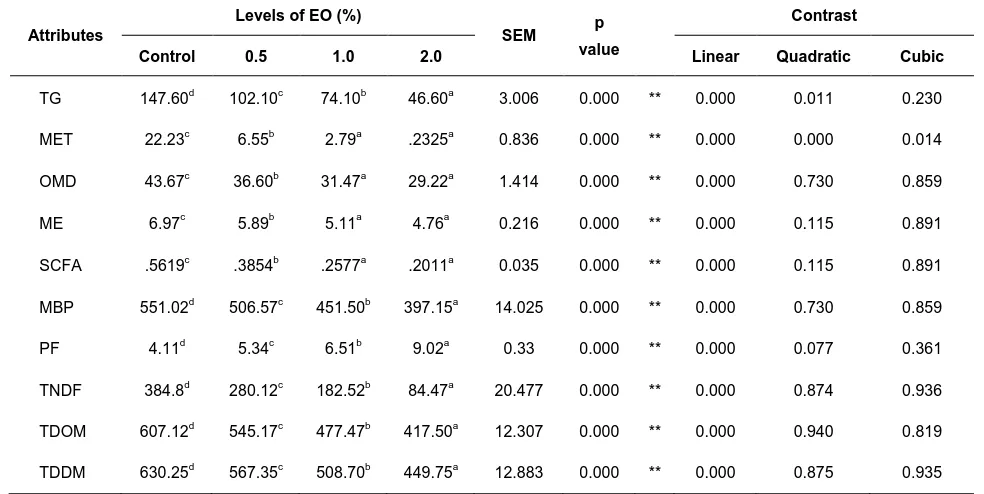
Table 3:The effect of adding various levels of eucalyptus oil on different attributes of composite feed-1 related to gas production and
digestibility when treated with rumen liquor buffer (in vitro)
Attributes
Levels of EO (%)
SEM p
value
Contrast
Control 0.5 1.0 2.0 Linear Quadratic Cubic
TG 147.60d 102.10c 74.10b 46.60a 3.006 0.000 ** 0.000 0.011 0.230
MET 22.23c 6.55b 2.79a .2325a 0.836 0.000 ** 0.000 0.000 0.014
OMD 43.67c 36.60b 31.47a 29.22a 1.414 0.000 ** 0.000 0.730 0.859
ME 6.97c 5.89b 5.11a 4.76a 0.216 0.000 ** 0.000 0.115 0.891
SCFA .5619c .3854b .2577a .2011a 0.035 0.000 ** 0.000 0.115 0.891
MBP 551.02d 506.57c 451.50b 397.15a 14.025 0.000 ** 0.000 0.730 0.859
PF 4.11d 5.34c 6.51b 9.02a 0.33 0.000 ** 0.000 0.077 0.361
TNDF 384.8d 280.12c 182.52b 84.47a 20.477 0.000 ** 0.000 0.874 0.936
TDOM 607.12d 545.17c 477.47b 417.50a 12.307 0.000 ** 0.000 0.940 0.819
TDDM 630.25d 567.35c 508.70b 449.75a 12.883 0.000 ** 0.000 0.875 0.935
The MBP was observed to be 551.02, 506.57,451.50 (g/kg DM) and
397.15 at 0,0.5,1 and 2 µl/ml level of EO respectively. The three
treatments of EO showed a significant decrease (p < 0.01) in MBP
with control and each other. In respect to various levels of EO
viz.,0,0.5, 1 and 2 (µl/ ml) in CF-1, TDDM was recorded
630.25,567.35,508.70 and 449.75(g/kg DM); TDOM to be 607.12,
545.17, 477.47 and 417.50 (g/kg DM); and TDNDF to be
384.8,280.12, 182.52 and 84.70 (g/kg DM) respectively. A significant
decrease (p < 0.01) in TDDM, TDOM and TDNDF was shown by
three treatments of EO when compared with control.The OMD
percentage was observed to be 43.67, 36.60, 31.47 and 29.22 at
0,0.5,1 and 2 (µl/ml) levels of EO respectively. While comparing the
effect of three different levels of EO on OMD percent with control,the
OMD percent was found to decrease significantly (p < 0.01). A
nonsignificant decrease in OMD percent was found after 1 µl/ml of
EO, when the three treatments were compared with each other.
The effects of adding various levels of EO on CF-1 related to
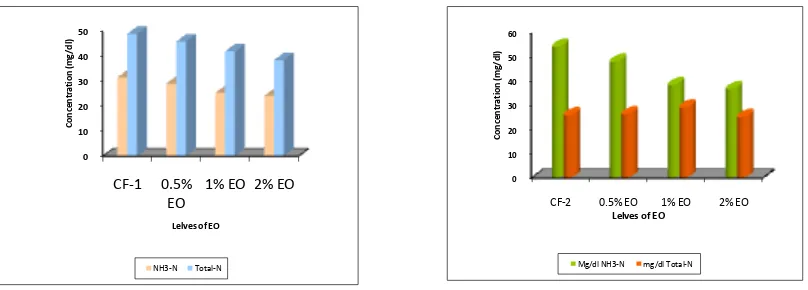
fermentation are given in table 4. The effect of adding various levels
EO(EO) in CF-1 on concentration of NH3- N and total N are shown
fig. 3 The concentration of NH3- N was found to be
31.62,26.50,25.37 and 22.97(mg/dl) ;and total –N to be 49,42.87,
42,35(mg/dl) at 0,0.5,1 and 2 (µl/ml) levels of EO respectively.
While comparing the three treatments of EO (0.5, 1 and 2µl/ml)a
significant decrease was found in concentration of NH3-N and total N
with control. While comparing the NH3-N and total N resulting by
addition of EO at three levels it was found that 0.5 µl/ml and 1 µl/ml
differed non significantly with each other, andsignificant(p<0.01)
difference was observed between 0.5 µl/ml and 2 µl/ml; 1 µl/ml and 2
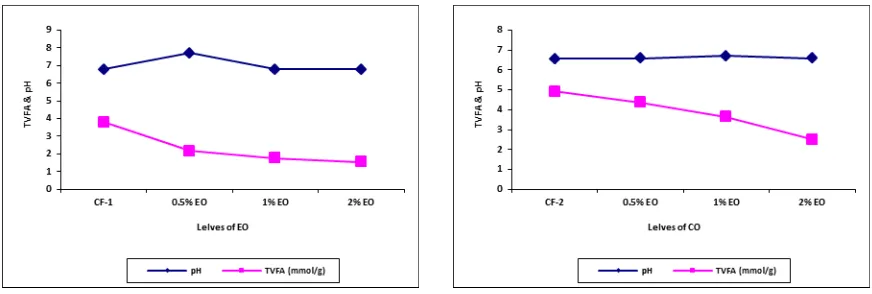
µl/ml treatments.The effect of adding various levels of EO in CF-1 on
TVFA and pH are shown in fig. 7. The concentration of TVFA, was
observed to be 3.79, 2.18,1.76 and 1.54(mmol/g);of acetate to be
2.64, 1.67, 1.54 and 1.35(mm/dl); of propionate to be 0.8985,
0.3946, 0.1552 and 0.1358(mm/dl); of butyrate to be 0.2283, 0.1083,
0.0686 and 0.0467(mm/dl);and A:P ratio to be 2.96,4.46,10.11 and
10.12 at 0,0.5,1 and 2 (µl/ml) levels of EO respectively. When
comparisons were made, the three treatments of EO were found to
significantly decrease the concentration of TVFA, acetate,
propionate, butyrate as compared to control.
While comparing the three treatments of EO between themselves a
non significant decrease in TVFA and propionate was found after 1
µl/ml,whereas the acetate concentration was found to be significantly
(p<0.01) different between 0.5 µl/ml and 2 µl/ml and 1 µl/ml and 2
µl/ml treatments and 0.5 µl/ml and 1 µl/ml was non-significant with
Srivastava et al. Inclusion of Different levels of Eucalyptus Oil
UK J Pharm & Biosci, 2015: 3(5); 50 in AP ratio was observed after 0.5 µl/ml of EO with control. But when
three treatments were comparedthemselves, a non significant
increase was found after 1 µl/ml of EO.The pH in respect to various
levels of EO namely 0,0.5,1 and 2 (µl/ml) in CF-1 was observed to be
6.82, 7.67,6.84 and 6.83 respectively. When compared, the three
treatments of EO showed a nonsignificant effect on pH with respect
to control and amongst themselves.
The effect of adding various levels of EO in CF-1 on protozoa
number is given in Fig. 5. The protozoa count in respect to various
levels of EO viz.,0,0.5,1 and 2 (µl/ml) were found to be 26.94, 17.22,
12.77 and 8.89(N*105/dl) respectively. When compared, the three
treatments of EO showed a significant (p<0.01) decrease in protozoa
number with control and also between each other.
3.2 Effect of various levels of eucalyptus oil (EO) on different
attributes of composite feed-2 (CF-2)
The effects of adding various levels ofeucalyptus oil(EO) on CF-2
(75:25) related to gas production and digestibility are presented in
Table 5. The effect of adding various levels EO on total gas
productions at different hours is shown in Fig. 2.
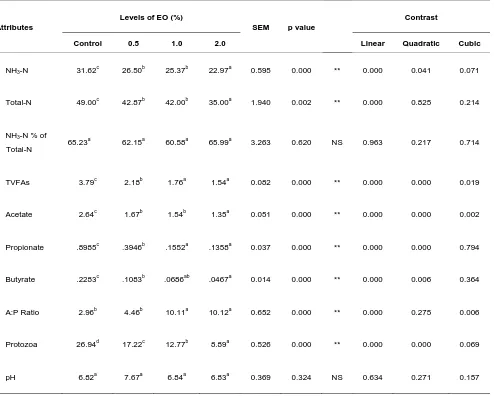
Table 4: The effect of adding various levels of eucalyptus oil on different attributes of composite feed-1 related to fermentation when
treated with rumen liquor buffer (in vitro)
Attributes
Levels of EO (%)
SEM p value
Contrast
Control 0.5 1.0 2.0 Linear Quadratic Cubic
NH3-N 31.62
c
26.50b 25.37b 22.97a 0.595 0.000 ** 0.000 0.041 0.071
Total-N 49.00c 42.87b 42.00b 35.00a 1.940 0.002 ** 0.000 0.825 0.214
NH3-N % of
Total-N 65.23
a
62.15a 60.58a 65.99a 3.263 0.620 NS 0.963 0.217 0.714
TVFAs 3.79c 2.18b 1.76a 1.54a 0.082 0.000 ** 0.000 0.000 0.019
Acetate 2.64c 1.67b 1.54b 1.35a 0.051 0.000 ** 0.000 0.000 0.002
Propionate .8985c .3946b .1552a .1358a 0.037 0.000 ** 0.000 0.000 0.794
Butyrate .2283c .1083b .0686ab .0467a 0.014 0.000 ** 0.000 0.006 0.364
A:P Ratio 2.96b 4.46b 10.11a 10.12a 0.652 0.000 ** 0.000 0.275 0.006
Protozoa 26.94d 17.22c 12.77b 8.89a 0.526 0.000 ** 0.000 0.000 0.069
UK J Pharm & Biosci, 2015: 3(5); 51
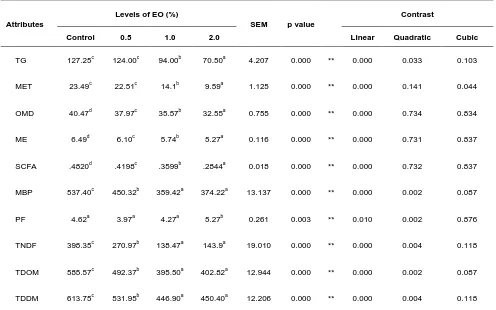
Table 5:The effect of adding various levels of Eucalyptus oil on different attributes of composite feed-2 related to gas production and
digestibility when treated with rumen liquor buffer (in vitro)
Attributes
Levels of EO (%)
SEM p value
Contrast
Control 0.5 1.0 2.0 Linear Quadratic Cubic
TG 127.25c 124.00c 94.00b 70.50a 4.207 0.000 ** 0.000 0.033 0.103
MET 23.49c 22.51c 14.1b 9.59a 1.125 0.000 ** 0.000 0.141 0.044
OMD 40.47d 37.97c 35.57b 32.55a 0.755 0.000 ** 0.000 0.734 0.834
ME 6.49d 6.10c 5.74b 5.27a 0.116 0.000 ** 0.000 0.731 0.837
SCFA .4820d .4198c .3599b .2844a 0.018 0.000 ** 0.000 0.732 0.837
MBP 537.40c 450.32b 359.42a 374.22a 13.137 0.000 ** 0.000 0.002 0.087
PF 4.62a 3.97a 4.27a 5.27b 0.261 0.003 ** 0.010 0.002 0.876
TNDF 398.35c 270.97b 138.47a 143.9a 19.010 0.000 ** 0.000 0.004 0.118
TDOM 585.57c 492.37b 395.50a 402.82a 12.944 0.000 ** 0.000 0.002 0.087
TDDM 613.75c 531.95b 446.90a 450.40a 12.206 0.000 ** 0.000 0.004 0.118
abc
Means with different superscripts in a row differ significantly (p<0.01); **P<0.01(highly significant), *P<0.05(significant),NS=non significant; Net gas volume (TG=ml/g), Methane (MET= l/kg DM), organic matter digestibility (OMD= %), Metabolizable energy (ME= MJ/Kg DM), Short chain fatty acids (SCFA=µ mol), Microbial bio mass production (MBP= g/Kg DM) and Partitioning factor (PF) ,Truly degradability of Dry Matter (TDDM=g/kg DM), Organic matter (TDOM= g/kg DM) and NDF (TNDF=g/kg DM) of the experimental diets
The total gas productions (ml/g DM) in respect to various levels of
EO in CF-1 viz., 0,0.5,1 and 2 (µl/ml) was observed to be 127.25,
124.00, 94.00 and 70.50 respectively. When the three treatments of
EO (0.5, 1 and 2 µl/ml) were compared with control, only 1 µl/ml and
2 µl/ml of EO showed a significant (p<0.01) decrease, whereas, 0.5
µl/ml of EO had a non significant effect on total gas production. The
total gas production differed significantly (p<0.01) when the three
treatments of EO were compared amongst themselves.The Methane
gas concentration(l/kg DM) was recorded as 23.49, 22.51, 14.10,
and 9.59 at 0,0.5,1 and 2 (µl/ml) levels of EO respectively. The three
treatments of EO showed a significant decrease (p< 0.01) in
methane concentration after 0.5 µl/ml of EO with control. Whereas,
amongst the three treatments a significant (p<0.01) difference was
found. The ME in respect to various levels of EO namely0,0.5, 1 and
2 (µl/ ml) in CF-2 was observed to be 6.49, 6.10, 5.74 and 5.27
(MJ/Kg DM); of SCFA to be 0.4820, 0.4198, 0.3599 and 0,2844
(µmol); and OMD% 40.47, 37.97, 35.57 and 32.55 (%) respectively.
When compared, the three treatments of EO showed a significant
decrease (p < 0.01) in ME, SCFA and OMD with control and also
amongst themselves.
The TDDM, with respect to various levels of EO viz.,0,0.5, 1 and 2
(µl/ ml) in CF-2 were recorded as 613.75, 531.95, 446.90 and
450.40(g/kg DM);TDOM as 585.57, 492.37, 395.50 and 402.82 (g/kg
DM); TDNDF as 398.35, 270.97, 138.47 and 143.90 (g/kg DM); and
MBP as 537.40, 450.32, 359.42 and 374.22 (g/kg DM) respectively.
When the three treatments of EO were compared with control a non
significant difference was found after 1 µl/ml of EO. While comparing
the TDDM, TDOM, TDNDF and MBP resulting as an addition of EO
at three levels it was found that 0.5 µl/ml and 1 µl/ml and 0.5 µl/ml
and 2 µl/ml differed significantly(p<0.01) with each other, while a non
significant difference was observed between 1 µl/ml and 2µl/ml
treatments.
The effects of adding different levels of EO on CF-2 related to
fermentation are given in Table 6. The effect of adding various levels
Srivastava et al. Inclusion of Different levels of Eucalyptus Oil
UK J Pharm & Biosci, 2015: 3(5); 52
are shown Fig. 4. The concentration of NH3- N was found to be
25.50, 26.15, and 20.55 (mg/dl); and of total N as 54.42, 42.00,38.00
and 35.00 at 0,0.5,1 and 2 (µl/ml) levels of EO respectively. When
the three treatments of EO (0.5, 1 and 2 µl/ml) were compared with
control,only 2 µl/ml of EO showed a significant (p<0.01) effect, while,
0.5 µl/ml and 1 µl/ml of EO differed non significantly in concentration
of NH3-N. While comparing the NH3- N concentration resulting as an
addition of EO at three levels, it was found that 0.5 µl/ml and 2 µl/ml
and 1 µl/ml and 2 µl/ml differed significantly (p<0.01) with each other
while a non significant difference was observed between 1 µl/ml and
0.5 µl/ml treatments. When compared the effect of three treatments
of EO on total N concentration with control the total N concentration
was found to decrease significantly (p<0.01). While comparing the
total N concentration resulting as an addition of EO at three levels it
was found that 0.5 µl/ml and 1 µl/ml and 1 µl/ml and 2 µl/ml differed
non significantly with each other while a significant (p<0.01)
difference was observed between 0.5 µl/ml and 2 µl/ml treatments.
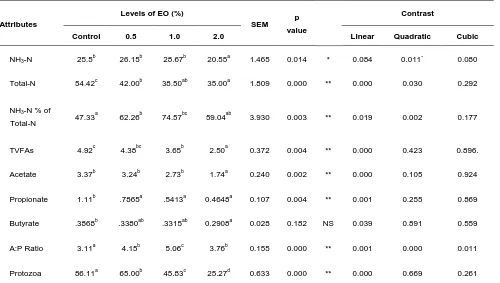
Table 6: The effect of adding various levels of eucalyptus oil on different attributes of composite feed-2 related to fermentation when
treated with rumen liquor buffer (in vitro)
Attributes
Levels of EO (%)
SEM p
value
Contrast
Control 0.5 1.0 2.0 Linear Quadratic Cubic
NH3-N 25.5
b
26.15b 28.67b 20.55a 1.465 0.014 * 0.084 0.011` 0.080
Total-N 54.42c 42.00b 38.50ab 35.00a 1.809 0.000 ** 0.000 0.030 0.292
NH3-N % of
Total-N 47.33
a
62.26b 74.57bc 59.04ab 3.930 0.003 ** 0.019 0.002 0.177
TVFAs 4.92c 4.38bc 3.65b 2.50a 0.372 0.004 ** 0.000 0.423 0.896.
Acetate 3.37b 3.24b 2.73b 1.74a 0.240 0.002 ** 0.000 0.105 0.924
Propionate 1.11b .7865a .5413a 0.4648a 0.107 0.004 ** 0.001 0.255 0.869
Butyrate .3868b .3380ab .3315ab 0.2908a 0.028 0.182 NS 0.039 0.891 0.559
A:P Ratio 3.11a 4.15b 5.06c 3.76b 0.155 0.000 ** 0.001 0.000 0.011
Protozoa 86.11a 65.00b 45.83c 25.27d 0.633 0.000 ** 0.000 0.669 0.261
abc
Means with different superscripts in a row differ significantly (p<0.01); **P<0.01(highly significant), *P<0.05(significant),NS=non significant; Fermentation parameters of ammonia-N (NH3-N=mg/dl), Total nitrogen (Total-N = mg/dl), Total volatile fatty acids (TVFAs= mmol/g), ammonia-n % of Total-N and population of
ciliate protozoa (N*105/dl) acetate (mm/dl), Propionate (mm/dl) and butyrate (mm/dl) of the experimental diets
The effect of adding various levels of EO in CF-2 on TVFA and pH
are showed in Fig. 8. The concentration of TVFA, was observed to
be 4.92, 4.38, 3.65 and 2.50 (mmol/g); of acetate to be 3.37, 3.24,
2.73 and 1.74(mm/dl); of propionate to be 1.11, 0.7865, 0.5413 and
0.4648;of butyrate to be 0.3868, 0.3380, 0.3315and 0.2908 (mm/dl)
;and A:P ratio to be 3.11, 4.15, 5.06 and 3.76 at 0,0.5,1 and 2 (µl/ml)
levels of EO respectively. When the three treatments of EO were
compared with control for TVFA concentration, a significant
difference was found after 0.5 µl/ml of EO addition. The effect on
TVFA concentration when three treatments of EO were compared
between themselves were found as 0.5 µl/ml and 2 µl/ml and 1 µl/ml
and 2 µl/ml showed a significant effect (p < 0.05), where as 0.5 µl/ml
and 1 µl/ml differed non-significantly with each other.When three
treatments of EO were compared with control, the effect on acetate
was found to be significant at 2µl/ml, while at 0.5µl/ml and 1 µl/ml
anon significant effect was noted.While comparing the acetate
concentration resulting as an addition of EO at three levels it was
found that 0.5 µl/ml and 2µl/ml and 1 µl/ml and 2µl/ml differed
significantly with each other, while a non significant difference was
observed between 0.5 µl/ml and 1 µl/ml treatments. The three
treatments of EO showed a significant (p<0.01) decrease in
propionate concentration as compared to control. But within
UK J Pharm & Biosci, 2015: 3(5); 53
0
50
100
2hr
4hr
8hr
18hr 24hr 48hr
To
ta
l g
as
p
ro
d
u
ctio
n
(m
l/0
.5
g)
Hours
CF-1
0
20
40
60
80
2hr
4hr
8hr
18hr 24hr 48hr
To
ta
l ga
s
p
ro
d
u
ct
io
n
(m
l/
0.5
g)
Hours
CF-2
Fig 1& 2: Effect of various levels of eucalyptus oil in composite feed-1 and feed-2on total gas production respectively
0 10 20 30 40 50
CF-1 0.5% EO
1% EO 2% EO
C
o
n
ce
n
tra
ti
o
n
(m
g/
d
l)
Lelves of EO
NH3-N Total-N
0 10 20 30 40 50 60
CF-2 0.5% EO 1% EO 2% EO
C
o
n
cen
tr
ati
o
n
(m
g/
d
l)
Lelves of EO
Mg/dl NH3-N mg/dl Total-N
Fig 3 & 4: Effect of various levels of eucalyptus oil in composite feed-1and feed-2 On concentration of NH3-N and total- N respectively
Srivastava et al. Inclusion of Different levels of Eucalyptus Oil
UK J Pharm & Biosci, 2015: 3(5); 54
Fig 7& 8: Effect of various levels of eucalyptus oil in composite feed-1 and feed- 2 on TVFA (mmol/g) and pH respectively
When compared, the three treatments of EO with control showed a
significant effect on A:P ratio. While comparing the AP ratio
concentration resulting in an addition of EO at three levels it was
found that 0.5 µl/ml and 1 µl/ml and 1 µl/ml and 2µl/ml differed
significantly with each other, while, a non significant difference was
observed between 0.5 µl/ml and 2 µl/ml treatments. While comparing
the three treatments of EO with control the effect on pH was found to
be significantly( p < 0.01) different at 1 and 2 µl/ml only, but when the
three treatments were compared amongst themselves, the effect on
pH was found to be significantly different at all three levels of
treatment between them.The effect of adding various levels of EO in
CF-2 on Protozoa number is given in fig. 6. The Protozoa count with
respect to various levels of EO namely, 0,0.5,1 and 2 (µl/ml) were
found to be 86.11, 65.00, 45.83 and 25.27 (N*105/dl) respectively.
When compared,the three treatments of EO (0.5, 1 and 2 µl/ml)
showed a significant decrease in Protozoa number with control and
also between each other.
4 Discussion
4.1 Gas Production and Methane Production (GP & CH4)
During the present investigation, it was observed that increasing
concentration of EO in CF-1 and also CF-2 resulted in a linear
decrease in total gas production upto 74.26% in CF-1 and 31.01% by
inclusion of EO in CF-2 respectively. Similarly, Methane gas
concentration also showed the decrease in the linear manner with
EO supplementation upto 19.04% in CF-1 and 8.09% by inclusion of
EO in CF-2. The results of the present study indicated that inclusion
of increasing level of EO in CF-1 and CF-2 significantly decreased
the total gas production which is similar to the earlier reports
18-22
where in also a decrease was observed in methane gas production
by addition of unsaturated fatty acid essential oil, which serve as
electron acceptor during biohydrogenation in the rumen. A decrease
in total gas production and methane production was highly
pronounced in CF-1 which had 40% of concentrate as compared to
CF-2 which had 25% of concentrate is in conformation to other
findings23 when the authors reported thatan increase in proportion of
concentrate in the diet reduced methane and gas production more
efficiently by 7 to 40%. Addition of 4% canola oil in diet containing
85% concentratedhas also been observed by earlier workers to bring
a reduction in methane production by 33%24, which supports the
present findings.
The inclusion of EO in CF-1 was found to reduce significantly total
gas production and different levels compared to control, while the
inclusion of EO in CF-2 reduced the total gas production significantly
at higher levels of 1 and 2 µl/ml EO. A 73% decrease in methane by
inclusion of 7% CO in diet containing to concentrate as compared to
forage diet has been documented earlier25. It has been suggested
that Eucalyptus leaves have a potential to reduce methane
production as well as gas production because they contain tannins,
flabonoids and volatile oils. The high degree of unsaturation of EO
likely made it toxic to methanogenesis has earlier been
suggested26,27 which caused the steep fall in methane production.
The results of present investigations are in consistence with earlier
reports27,28. They reported significant decrease in total gas
production and methane production after inclusion of EO might be
because essential oils have anti methanogenic agents29 the
characterstics of essential oils to interact with cell membrane
resulting in inhibition of growth of some positive and
gram-negative bacteria generated the possibility of exploring some of the
essential oils from garlic, hot pepper and clove buds as anti
methanogenic agents. Earlier reports30 have also suggested that
dietary supplementation containing higher proportion of concentrate
with myristic acid rich in coconut oil reduced methane production. All
these support the present study.
UK J Pharm & Biosci, 2015: 3(5); 55 ME and SCFA production could be predicted from gas values, and
the result of the present investigations showed that ME and SCFA
decreased (p < 0.05) significantly from control with increasing level of
EO in CF-1 as well as CF-2.Gas production is basically the result of
fermentation of carbohydrate to acetate, propionate and butyrate31
and substantial changes in carbohydrate fractions were reflected by
total gas produced32 suggesting that probably a shift in the proportion
of ME and SCFA will be reflected by changes in gas production. The
inclusion of EO in both the diets CF-1 and CF-2 decreased MBP
significantly (p < 0.01) but decrease was very pronounced in CF-1
containing 40% concentrate, which is similar to earlier reports23
where the author observed the rumen MBP decreased more in diet
containing the higher amount of concentrate.
4.3 True digestibilty of neutral detergent fibre(NDF), dry matter (DM)
and organic matter (OM)
TDDM, TDOM and TDNDF drastically decreased with the inclusion
of EO but did not decrease significantly at higher levels.The addition
of fats in the diet to decrease the fiber digestibility has also been
noticed earlier33. The reduction in the digestibility might be due to
anti bacterial effect of essential oil or vegetable oil on rumen
microflora34. This might be true for the present study also. The
inclusion of EO in CF-1 very significantly (p< 0.01) decreased
TDNDF, TDDM and TDOM while in CF-2 the decrease was only upto
1 µl/ml of EO, further to this level there was no significant decrease.
These results also indicate that increase in proportion of concentrate
in diet causes more reduction in digestability of feed as reported
earlier23.It has also been suggested that coconut oil inclusion could
depress rumen fibre digestion35. According to reports available, upto
1 µl/ml level of EO, digestibility of feed was found to reduce
significantly there after no further decrease was observed with
increasing dose of eucalyptus oil28and peppermint oil36. Earlier
workers have also documented a linear decrease in degradability of
dry matter and NDF with increasing doses for essential oil37.
4.4 TVFA concentration and Acetate: Propionate (A:P) ratio
In CF-1, the inclusion of EO upto 1 µl/ml concentration level was
found to decrease the concentration of TVFA and increase A:P ratio,
but beyond this concentration level there was neither significant
decrease in TVFA nor increase in A:P ratio while in CF-2 a
significant decrease in TVFA and increase in AP ratio took upto 2
µl/ml of EO concentration was noted during the present study. This is
similar to the earlier findings38,39 whereby it was noted that inclusion
of CO did not affect TVFA concentration. No effect in TVFA
concentration when sheep were fed with diet 60:40 (silage:
concentrate) with 100 mg of essential oil40. It has been suggested
that VFA is the end products of rumen microbial fermentation and
represent the main supply of metabolizable energy for ruminants41.
Therefore, a reduction in their production would be nutritionally
unfavorable for the animal42.
The decrease in TVFA concentration and increase in A:P ratio by
inclusion of oils in the diet has also been observed earlier28,43.The
increasing level of peppermint oil reduced the TVFA concentration
and increased A:P ratio asalso been suggested earlier36. Higher A:P
ratio accompanied by reduction in vitromethane emission by
inclusion of essential oil of clove in the diet has also been noted44. A
decrease in TVFA at inclusion of higher levels of essential oil in the
diethas been observed45which is consistent with their antimicrobial
activity and it has been suggested that decrease in TVFA is due to
reduction in feed digestibility46. But according to earlier workers47,48,
the effect of essential oils on TVFA andA:P ratio is pH and diet
dependent. Cardozo et al. (2005) reports47suggests that at pH 6-7
the total VFA concentration decreased, and A:P ratio increased.
Similar effect has also been suggested earlier49, wherein, a reduction
in acetate proportion,A:P ratio and increased TVFA at lower pH
(5-5.5) was documented.A decrease in TVFA with inclusion of essential
oil without any change in pH has been noted50.Reports29 onincrease
in TVFA production and decrease in A:P ratio in a diet containing
more proportion of concentrate compared to forage are
available.Therefore, it may be suggested that difference in VFA
pattern due to essential oil might be due to difference in diet used in
different experiments during the present study.
4.5 pH of rumen fluid
The inclusion of EO in CF-1 was not found to effect pH during the
present investigation. Similar observations were also made by earlier
workers33,50,who found no change in rumen pH by inclusion of
essential oil in the diet. Rumen pH were noted to increase with
addition of EO in CF-2 as compared to control, but it remained
constant with increasing level of EO during the present work. The
observed increase in pH is reflective of the lower concentration of
VFA.
As pH decreases acid tends to become un-dissociated and more
hydrophobic thereby interacting more easily with cell membrane and
exerting their antimicrobial effect. Furthermore, bacteria seem to be
more susceptible to the effects of essential oils at low pH51. In this
study, the pH of in vitro rumen fluid varied from 6.45 to 7.0 which
were within the normal range of rumen pH (6.45 to 7.0052).The result
indicated that feeding oil had no adverse effect on rumen pH in
sheep.
4.6 Ammonia nitrogen concentration (NH3-N)
The inclusion of EO in CF-1 and CF-2 linearly decreased NH3-N
nonsignificantly. This result was similar to those observed
Srivastava et al. Inclusion of Different levels of Eucalyptus Oil
UK J Pharm & Biosci, 2015: 3(5); 56
suggesting that deamination was inhibited. Workers35,54,55have
attributed lower NH3-N levels to be caused by addition of essential oil
resulting in a reduced deamination of amino acid.
The decrease in NH3-N concentration by vegetable oil
supplementation may be due to lower rate of protein degradation.
However, it is possible that reduction in deamination relates to
reduction in availability of dehydrogenases. The decrease in rate of
Ammonia production may be beneficial nutritionally by increasing
efficiency of protein utilization in rumen56. No effect on NH3-N
concentration by inclusion of peppermint oil36and coconut oil39 has
been documented by earlier workers, while,an increase in NH3-N
concentration in the rumen of cattle fed with diet having high
proportion of concentrate with supplementation of eugenol has been
oberved57 and it has also been noticed that deaminase activity is not
inhibited.
4.7 Total – N concentration
The inclusion of EO in CF-1 reduced total – N concentration
significantly (p < 0.01), with increasing level of EO from control.
Similar results with respect to total – N were also observed by
addition of EO in CF-2 during the present study where as a
significant decrease (p < 0.01) with increasing levels of oils, but no
change in total-N has been earlier observed58 with inclusion of
peppermint oil in diet. The difference in total –N pattern in different
experiments might be due to the difference in type and dose of
essential oils used.
4.8 Protozoa number
The addition of EO in both diets CF-1 and CF-2 depressed protozoa
count significantly(p<0.01). In CF-1, a decrease in protozoa number
by 19.04% was noted with the addition of EO while, the inclusion of
EO in CF -2 caused the decrease in protozoa number by 40.75%.
Eucalyptus oil has been suggested to reduce protozoa by earlier
workers too28.Supplementation of unsaturated fatty acid has been
suggested to reduce the protozoan population in sheep
rumen59.Inclusion of CO in diet caused the reduction in protozoan
number53,60. Decrease in methane production is also accompanied
by reduction in the number of protozoa resulting from increased oil
concentration.Close association of methanogenic bacteria with
protozoa population might have adversely affected
methanogenicarchea which caused methane inhibition.
The authors conducted a similar study employing coconut oil as feed
additive61.
5 Conclusion
It could be therefore concluded that inclusion of eucalyptus oil
tended to decrease GP,ME,SCFA,TDDM and MBP. EO was found to
decrease fermentation in a manner that even at 0.5 µl/ml
concentration there was a significant decrease in all these
parameters.
From the above gas production and fermentation parameters noticed
in two diets CF-1 and CF-2 with inclusion of different levels of EO, it
can be envisaged and concluded that increasing the proportion of
concentrate in diets and using EO as a feed additive increases the
rumen efficiency by reducing the methane concentration and gas
production.
6 Acknowledgement
The authors are highly grateful and thank Dr. R.C. Jakhmola,
Director, Central Sheep and Wool Research Institute, Bikaner for
permitting us to carry out the work and avail the facilities in the
Institute.
7 Competing interests
Molecular characterization studies, camel haematology amd
biochemical studies
8 Author’s contributions
TM carried out laboratory work and MS supervised and drafted the
manuscript
9 References
1. Lee HJ, Lee SC, Kim JD, Oh YG, Kim BK, Kim CW, Kim
KJ. Methane production potential of feed ingredients as
measured by in vitro gas test. Asian-Aust. J.Anim.Sci.
2003; 16:1143-1150.
2. Tyler SC.13C/12C ratios in atmospheric methane and
some of its sources. In: Rogers JE & Whitman W (Eds)
Microbial Production and Consumption of Greenhouse
Gases. American Society for Microbiology, Washington,
DC. 1991; pp 395-409.
3. Crutzen P. Overview of tropospheric chemistry:
developments during the past quarter century and a look ahead. Faraday Discuss. 1995; 100: 1–21.
4. Nagaraja TG, Newbold CJ, Van Nevel CJ, Demeyer DI.
Manipulation of ruminal fermentation. The Rumen
Microbial Ecosystem.P. N. Hobson and C. S. Stewart, ed.
Chapman and Hall, London,UK.1997; pp 523-623.
5. Fievez V, Piattoni F, Mbanzamihigo F, Demeyer D.
Reductiveacetogenesis in the hindgut and attempts to its
induction-a review. J. Appl. Anim. Res. 1999;16:1-22.
6. Hosoda K, Nishida T, Park WY, Eruden B. Influenceof
Mentha piperita L. (Peppermint) supplementation on
nutrient digestibility and energy metabolism in lactating
UK J Pharm & Biosci, 2015: 3(5); 57
7. Lila ZA, Mohammed N, Kanda S, Kurihara M, Itabashi H.
Sarsaponin effects on ruminal fermentation and microbes,
methane production, digestibility and blood metabolites in
steers. Asian-Aust. J. Anim. Sci. 2005;18:1746-1751.
8. Machmuller A, Ossowski DA, Kreuzer M. Comparative
evaluation of the effects of coconut oil, oilseeds and
crystalline fat on methane release, digestion and energy
balance in lambs. Animal Feed Science and Technology. 2000; 85: 41–60.
9. AOAC. Official Method of Analysis, 16th ed. Association of
Official Analytical Chemists, 1995; Washington, DC.
10. Van Soest PJ, Robertson JB, Lewis BA. Methods of
dietary fiber, neutral detergent fiber and non-starch
carbohydrates in relation to animal nutrition. J. Dairy Sci.
1991; 74: 3583–3597.
11. Porter LJ, Hrsrich LN, Chan BG. The conversion of
procyanidins and prodelphinidins to cyaniding and
delphinidin. Phytochemistry, 1986;1: 223-230.
12. Makkar HPS, Blummel M, Becker K. Formation of
complexes between polyvinyl pyrrolidones or polyethylene
glycols and tannins, and their implication in gas production
and true digestibility in in vitro techniques. Br. J. Nutr.
1995; 73:897-913.
13. Menke KH, Steingass H. Estimation of the energetic feed
value obtained by chemical analysis and in vitro gas
production using rumen fluid. Animal Research and
Development, 1988; 28: 7-55.
14. Tilley JMA, Terry RA. A two stage technique for the in vitro
digestion of forage crops. J. Br. Grassl. Soc. 1963;18:104–
111.
15. Getachew G, Blummel M, Makkar HPS, Becker K. In vitro
gas measuring techniques for assessment of nutritional
quality of feeds: a review. Anim. Feed Sci. Technol. 1997;
72:261-281.
16. Kamra DN, Sawal RK, Pathak NN, Kewalramani N,
Agarwal N. Diurnal variations in ciliate protozoa in the
rumen of blackbuck (Antilope cervicapra) fed green
forages. Lett. Appl. Microbiol. 1991;13:165-167.
17. Chaney AL, Marbach EP. Modified reagents for
determination of urea and ammonia. Clin. Chem. 1962;
8:130–132.
18. McAllister TA, Okine EK, Mathison GW, Cheng KJ.
Dietary, environmental and microbiological aspects of
methane production in ruminants. Canadian Journal of
Animal Science, 1996; 76: 231–243.
19. Boadi D, Benchaar C, Chiquette J, Massé D. Mitigation
strategies to reduce enteric methane emissions from dairy
cows: Update review. Canadian Journal of Animal Science, 2004; 84: 319–335.
20. Dohme F, Machmüller A, Wasserfallen A, Kreuzer M.
Ruminal methanogenesis as influenced by individual fatty
acids supplemented to complete ruminant diets. Lett. Appl. Microbiol. 2001; 32, 47–51.
21. Johnson KA, Johnson DE. Methane emissions from cattle.
Journal of Animal Science, 1995; 73: 2483- 2492.
22. Hegarty RS. Reducing rumen methane emissions through
limination of rumen protozoa. Aust. J. Agric. Res. 1999;
50: 1321–1327.
23. Benchaar C, Pomar C, Chiquette J. Evaluation of dietary
strategies to reduce methane production in ruminants: A
modeling approach. Canadian Journal of Animal Science,
2001; 81: 563–574.
24. Mathison GW. Effect of canola oil on methane productionin
steers. Can. J. Anim. Sci. 1997; 77: 545–546.
25. Machmuller A, Kreuzer M. Methane suppression by
coconut oil and associated effects on nutrient and energy
balance in sheep. Canadian Journal of Animal Science,
1999; 79: 65–72.
26. Prins RA, Van Nevel CJ, Demeyer DI. Pure culturestudies
of inhibitors for methanogenic bacteria. Ant.
V.Leeuwenhoek. J. Microbiol.Serol. 1972; 38: 281–287.
27. Sallam SMA, Bueno ICS, Brigide OP, Godoy PB, Vitti
DMSS, Abdalla AL. Efficacy of eucalyptus oil on in vitro
rumen fermentation and methane production. Options
Medigterraneennes, 2009; 85: 267-272.
28. Kumar RKN, Kamra N, Agrawal, Chaudhary LC. Effect of
eucalyptus (Eucalyptus globules) oil on in vitro
methanogenesis and fermentation of feed with buffalo
rumen liquor. Anim. Nutr. Feed technol, 2009 ; 9: 237-243.
29. Calsamiglia S, M Busquet, Cardozo PW, Castillejos L,
Ferret A. Invited review.Essential oils as modifiers of
rumen microbial fermentation. J. Dairy Sci. 2007; 90:
2580-2595.
30. Odongo NE, Or-Rashid MM, Kebreab E. Effect of
supplementing myristic acid in dairy cow rations on
ruminalmethanogenesis and fatty acid profile in milk. J.
Dairy Sci. 2007; 90: 1851–1858.
31. Steingass H, Menke KH. Schätzung des energetischen
Futterwertesaus der in vitro mit Pansensaftbestimmten
Gasbildung undder chemischen Analyse. I:
Untersuchungenzur Methode. Übers.Tierern. 1986; 14:
251–270.
32. Coelho M, Hembry FG, Barton FE, Saxton AM. A
near-Srivastava et al. Inclusion of Different levels of Eucalyptus Oil
UK J Pharm & Biosci, 2015: 3(5); 58 infrared reflectance spectroscopy method in forage
evaluation. Anim. Feed Sci. Technol. 1988; 20:219-231.
33. Mc Guinn SM, Beauchemin KA, Coates T. Methane
emissions from beef cattle: effects of monensin, sunflower
oil, enzymes, yeast and fumaric acid. Journal ofAnimal
Science, 2004;82: 3346–3356.
34. Oh HK, Sakai T, Jones MB, Longhurst WM. Effect of
various essential oils isolated from Douglas fir needles
upon sheep and deer rumen microbial activity. Appl. Microbiol. 1967;15:777–784.
35. Machmüller A, Soliva CR, Kreuzer M. Effect of coconut oil
and defermentation treatment on methanogenesis in
sheep.Repord. Nutr. Dev. 2003; 43, 41–55.
36. Aggarwal N, Shekhar C, Kumar R, Chaudhary LC, Kamra
DN. Effect of peppermint (Mentha piperita) oil on
fermentation of feed and methanogenesis in in vitro gas
production test. Animal Feed Science and Technology,
2009;148: 321-327.
37. Yang WZ, Ametaj BN, Benchaar C, Beauchemin KA. Does
response to cinnamaldehyde supplementation in growing
beef heifers: Ruminal and intestinal digestion. J. Anim.
Sci., 2010b; 88: 680-688.
38. Jordan E, Kenny D, Hawkins M. Effect of refined soy oil or
whole soybeans on intake, methane output, and
performance of young bulls. Journal of Animal Science.
2006; 84 (9): 2418-25.
39. Pilajun R, Wanapat M, Wachirapakorn C, Navanukroaw C.
Effect of coconut oil and sunflower oil ratio on ruminal
fermentation, rumen microorganisms, N-balance and digestibility in cattle. J. Anim. Vet. Adv. 2010; 9,1868–
1874.
40. Wallace RJ, Mc Ewan NR, McIntosh FM, Teferedegne B,
Newbold CJ. Natural products as manipulators of rumen
fermentation. Asian-australias.J. Anim. Sci. 2002;10:1458–
1468.
41. Van Soest PJ. Nutritional Ecology of the Ruminant. O and
B Books Inc., Corvalis. 1982
42. Busquet M, Calsamiglia S, Ferret A, Kamel C. Plant
extracts affect in vitro rumen microbial fermentation.
Journal of Dairy Science, 2006; 89: 761–771.
43. Maoheboeuf D, Morgavi DP, Papon Y, Mousset JL,
Arturo-Schaan M. Dose response effects of essential oils on in
vitro fermentation activity of the rumen microbial
population. Anim. Feed Sci. Technol., 2008;145: 335-350.
44. Patra AK, Kamra DN, Agarwal N. Effect of spices on
rumen fermentation, methanogenesis and protozoa counts
in in vitro gas production test. International Congress
Series, 2006;1293: 176-179.
45. Davidson PM, Naidu AS. In Phyto-phenols Natural Food
Antimicrobial Systems. A. S. Naidu, ed. CRCPress, Boca Raton, FL. 2000; Pages 265–293.
46. Oldick BS, Firkins JL. Effects of degree of fat saturation on
fiberdigestion and microbial protein synthesis when diets are fed twelvetimes daily. J. Anim. Sci. 2000;78, 2412–
2420.
47. Cardozo PW, Calsamiglia S, Ferret A, Kamel C. Screening
for the effects at two pH levels on in vitro rumen microbial
fermentation of a high-concentrate beef cattle diet. J.
Anim. Sci. 2005; 83:2572–2579.
48. Castillejos L, Calsamiglia S, Ferret A. Effect of essential
oils active compounds on rumen microbial fermentation
and nutrient flow in in vitro systems. J. Dairy Sci. 2006;
89:2649–2658.
49. Spanghero M, Zanfi C, Fabbro E, Scicutella N, Camellim
C. Effects of a blend of essential oil on some and products
of in vitro rumen fermentation. Anim. Feed Sci. Technol.
2008;145: 364-374.
50. Wanapat M, Pilajun R, Kongmun P. Ruminal ecology of
swamp buffalo as influenced by dietary sources. Anim.
Feed Sci. Technol. 2009;151, 205–214.
51. Skandamis NP, Nychas GJE. Development and evaluation
of a model predicting the survival of Escherichia coli
O157:H7 NCTC 12900 in homemade eggplant salad at
various temperatures, pHs, and oregano essential oil
concentrations. Applied and Environmental Microbiology,
2000; 66: 1646-1653.
52. Mir Z, Rushfeldt ML, Mir PS, Paterson LJ, Weselake RJ.
Effect of dietary supplementation with either conjugated
linoleic acid (CLA) or linoleic acid rich oil on the CLA
content of lamb tissues. Small Rumin. Res. 2000;
36:25-31.
53. Kongmun PM, Wanapat, Pakdee P, Navanukraw C. Effect
of coconut oil and garlic powder on in vitro fermentation
using gas production technique. Livest. Sci.
2010;127:38-44.
54. Newbold CJ, FM McInotch, P Williams, R Losa, Wallace
RJ. Effects of a specific blend of essential oil compounds
on rumen fermentation. Anim. Feed Sci. Technol.,
2004;114: 105-112.
55. Molero R, Ibara M, Caalsamiglia C, Ferret A, Losa R.
Effects of a specific blend of essential oil compounds on
dry matter and crude protein degradability in heifers fed
diets with different forage to concentrate ratios. Anim.
Feed Sci. Technol., 2004; 114: 91-104.
56. VanNevel CJ, Demeyer DI. Manipulation of rumen
UK J Pharm & Biosci, 2015: 3(5); 59 Hobson (ed.). Elsevier Applied Science, London, UK,
1988; p. 387-443.
57. Devendra C, Sevilla CC. Availability and use of feed
resources in crop-animal systems in Asia. Agricultural
Systems. 2002; 71:59-73.
58. Ando S, Nishida T, Ishida M, Hosoda K, Bayaru E. Effect
of peppermint feeding on the digestibility, ruminal
fermentation and protozoa. Livest. Prod. Sci. 2003; 82, 245–248.
59. Baah J, Ivanb M, Hristov AN, Koenig KM, Roded LM,
McAllister TA. Effects of potential dietary antiprotozoal
supplements on rumen fermentation and digestibility in heifers. Anim. Feed Sci. Technol. 2007;137,126–137.
60. Dohme F, Machmüller A, Wasserfallen A, Kreuzer M. The
role of the rumen ciliate protozoa for methane suppression
caused by coconut oil. Lett. Appl. Microbiol. 1999; 29, 187–192.
61. Mukharji, Tisa, Srivastava, Aakash and Srivastava Meera.
An in vitro trial to study the effect of inclusion of different
levels of coconut oil on sheep rumen methanogenesis and
fermentation processes. UK Journal of Pharmaceutical