Copyright © 2015 IJECCE, All right reserved
A Proposed Decision Support System for E-Services
Based on GIS
Nama Al-Shumany Deptt. of Information Systems, Faculty of Computer and Information Sciences, Mansoura University, Mansoura,
Egypt
Bahaa Shabana Computer Science Deptt., Misr Higher Institute for Commerce &
Computer, Mansoura, Egypt.
Hazem M. El-Bakry Deptt. of Information Systems, Faculty of Computer and Information Sciences, Mansoura University, Mansoura,
Egypt.
Abstract – Geographic Information Systems (GIS) have been widely used for spatial data and as a supporting tool to develop spatial decision support systems (SDSS). Information technologies, including GIS and the Internet, have provided opportunities to overcome many of the limitations of computer-based models in terms of data preparation and visualization, and provide the possibility to create integrated SDSS. This paper presents a Decision Support System for E-Service based on GIS "DS-ES-GIS". The proposed system utilizes websites to determine the required e-services according to the Geographic Location (GL). GL (latitude and longitude) are stored in temporarily excel sheet. Such data are read form ArcGIS as spatial data. GIS uses spatial data layers (Base map, Customers, point of service) to calculate the number of customer and the number of service points for each polygon. Therefore the system supports the decision making by the Geographic distribution for both services and customers.
Keywords – Spatial Decision Support System (SDSS), Geographic Information System (GIS) E-Services (ES).
I.
I
NTRODUCTIONGIS is very important in our life to days, also internet and networks are used widely to days. Most real-case complex problems can be considered as spatial decision problems, since they are usually located in a certain position/area and have a spatial component [11-17]. In such situations, both data location and spatial relationships usually make a prominent impact during the decision making process. For example, decisions related with urban regeneration, environmental risk assessment or policy making contain a strong spatial component that should be analyzed and included as a new dimension into the decision making process. Therefore, spatial decision problems should be geographically referenced and represented in a computer by using (GIS). In some cases, decision makers rely just on the GIS powerful storage and visualization capabilities to obtain support for their decisions, leaving the analysis and interpretation tasks to the decision maker. However, such complex spatial decision problems require considering a large set of parameters, policies, expert and stakeholder opinions and alternatives in a dynamic environment. As the complexity of the problem increases, it becomes difficult or even impossible to plot all the digital information to be analyzed in a GIS environment.
1.1. Internet Protocol (IP) addresses
Internet Protocol (IP) addresses. is the unique identification number for each computing devices connected with the Internet. Some addresses are static,
where it is the same over time and some addresses are dynamic, where the addresses change as devices log on or off the network. Each IP address is broken into bit lengths, with IPv4 (Internet Protocol version 4) addresses consisting of 32 bits (as is used in this research), and IPv6 (Internet Protocol version 6) addresses containing 128 bits. Many researchers, both in geography and outside the field, use IP addresses as a method for obtaining Geolocation data within cyberspace [5]. It depends on the Internet Protocol (IP) for information dissemination. IP address is one of the most important parts of the Internet Protocol, which is used not only for Internet routing, but also for end host identification. When the geolocation of IP addresses are known, many interesting location-aware applications can be provided [2].
There are two types of IP geolocation techniques: active IP geolocation and passive IP geolocation. Active IP geolocation technique relies on one IP address to another. However, the active method requires complicated calculations and cannot handle a very large volume of IP geolocation. Passive IP location is a database-driven procedure which relies on relational databases (such as MS SQL or MySQL databases). The IP geolocation databases include the index for mapping different levels of IP address
1.2. Geographic Information Systems (GIS)
GISs are systems that combine maps, tabular data and analysis capabilities. According the world’s preeminent provider of GIS software, “a GIS integrates hardware, software, and data for capturing, managing, analyzing, and displaying all forms of geographically referenced information. GIS allows users to take information, view that information spatially and analyze that information; therefore, users can recognize patterns, see correlations and reach conclusions” has several advantages as [6] . GIS the ability to perform spatial analysis; can categorize ;place objects into individual themes the ability to treat these objects differently; the ability to store data related to the visual presentation over the spatial database; can be implemented online ; thus control of the system can be easy ;remotely conducted; The cost of the implementation
of a GIS is considerable [9].
1.3. Decision Support System
Copyright © 2015 IJECCE, All right reserved
International Journal of Electronics Communication and Computer Engineering Volume 6, Issue 5, ISSN (Online): 2249–071X, ISSN (Print): 2278–4209
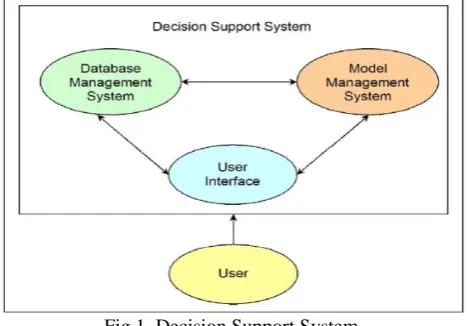
A Decision Support System (DSS) is a system controlled by one or more of aid to decision-making in business, providing a set of tools designed to improve the effectiveness of emission decision. Decision makers should be noted that despite the DSS is a valuable tool in the decision-making process is not a mechanism for decision-making. DSS consists of: Data Management System, Knowledge Management, Model Engine, User interface, and User [10].
To facilitate solution development for decision-making it is logical to separate data management from model management and then re-integrate the two in combination with a user interface to form a decision support application framework. This approach fosters inclusion of a variety of modeling techniques; a pre-requisite for an integrated modeling approach. The components of such a framework (Figure 1) include. a Data base Management System that includes tools to support data collection and storage, the management of data for models, and the ability to retrieve data from storage. A Model Management System that provides a set of tools and models that is supported by item and produces relevant for the decision making process. This new information is aligned/designed to management objectives and policy goals; and A User Interface supporting the visualization of the data sets and output from models (current and alternate scenarios) in a form that makes it clear whether management objectives and policy goals are being or are likely to be achieved [4].
Fig.1. Decision Support System.
1.4 E-Service
Rowley (2006), defines E-Service as “deeds, effort or performance whose delivery is mediated by information technology (including the web, information kiosks and mobile devices) such e-service includes the service element of e-tailing, customer support and service, and service delivery”. Then it explained that in e-service, interaction of the customer with service provider is through the technology such as the websites [7].
II.
R
ELATEDW
ORKCornel Ghiţă (2014), presented the structural, lineaments, and running pattern of a DSS purpose to help business and managers in the operation of site making decision. These studies assembled connotation derived
from notion, results of tentative studies both with unfold GIS software and data with respect to more expansion of the DSS, there is a quantum direction increasing geographical amplification and a arbitrary direct on– estimate and remedy, where suitable, of basilar benefits to employees (businessmen and directors), this as easement study time, location appreciation, Interdependence with genuine estate Exhibitors, structural and prioritize their site main effects and Errands ,mounting them works consciousness ,quantifying them necessarily, and provide arbitrage with other users in the itself manufacturer(Received returns from manufacturer directions) The trouble of menstruation the density of site effects in the different districts of the project area is much complicated For example, for account arrival or attraction density, nor the source neither the destination points are Famous. in theory, an employee can locus the works any place, complies to obtainable options. And therefore, effects density is a prorated menstruation, driven the maximum aggregate to polygons whereas intensity is the high and depress aggregate to polygon swish have slash worker density. In geometrid line at ion of the land[3].
Alberto Calzada (2013), designed Spatial Decision Support Systems (SDSSs) to solve a specific problem in a given region. This fact makes rather difficult or even impossible to develop comparative analyses and studies among different solutions. This research presents a generic rule-based spatial decision support software tool, able to approach most spatial decision problems within a single framework. To achieve this, the rule-based RIMER+ decision model was embedded in a Geographic Information System (GIS) environment. Such system was named Spatial RIMER+, and is able to consider expert knowledge, data uncertainty and both spatial and non-spatial information during the decision making process. This Such spatial decision support system consists of two main components: (i) the gvSIG software system, to provide GIS capabilities in terms of data storage, management and visualization and (ii) the RIMER+ decision model that is able to consider other essential elements of spatial decision problems, like data similarity, uncertainty, incompleteness and inconsistency within a common framework. RIMER+ also eases the analysis task [1].
III.
S
YSTEMA
RCHITECTUREThe architecture of the developed system is "DS-ES-GIS" made up of five major components: Geolocation Acquisition (GA), Geolocation Determination( GD), Spatial GIS Data ( SGD), GIS layers, and Spatial Decision Support System (SDSS ).
Figure (2) shows the components and the sequence of procedures.
3-1 Geolocation Acquisition (GA).
Copyright © 2015 IJECCE, All right reserved Fig.2. The proposed System "DS-ES-GIS"
3-2 Geolocation Determination( GD).
Fig.3. IP and the corresponding Latitude and Longitude.
The main operation of system "DS-ES-GIS" is to determine both latitude & longitude (Geolocation). this operation accepts user's IP and converting it to the corresponding Geolocation.fig (3) shows that The ( IP) 197.33.82.230 transferred to Geolocation latitude
31.036623600000002 and longitude
31.360296199999997.
3-3 SPATIL GIS DATA ( SGD).
The Geolocation is saved permanently in Excel Sheet (Fig 4-a).This Sheet is imported to spatial Database through Arcgis, it is used as Spatial GIS Data (SGD). Figure 4-b, shows SGD layer, which contains the attributes of: OBJECTID, Country , latitude, longitude and code.
Copyright © 2015 IJECCE, All right reserved
International Journal of Electronics Communication and Computer Engineering Volume 6, Issue 5, ISSN (Online): 2249–071X, ISSN (Print): 2278–4209
(b)
Fig.4. a) Excel Sheet, b) SGD layer
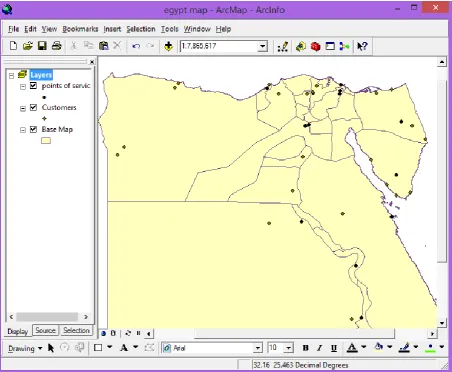
3-4 GIS layers
The Subsystem contains three GIS layers: Base map, customer's location, and point of services use Base map to store data to spatial data Base customers location layer. This layer is used to calculate the number of clients per polygon point of services This layer is used to calculate the number of E-services for each polygon fig(5) shows GIS layers: Base map, customers location, and point of services.
3-5 SDSS
A final step of the system where the data is analyzed and the process of location of the number of customers for each polygon are get on the graph, as well as the number of points of services for each polygon are get on the graph and the comparison is between them and obtain the appropriate decision as shown in fig(6).
Copyright © 2015 IJECCE, All right reserved
Fig.6. (a) Counting the number of customers in each polygon (b) Counting the number point of serves for each polygon
IV.
R
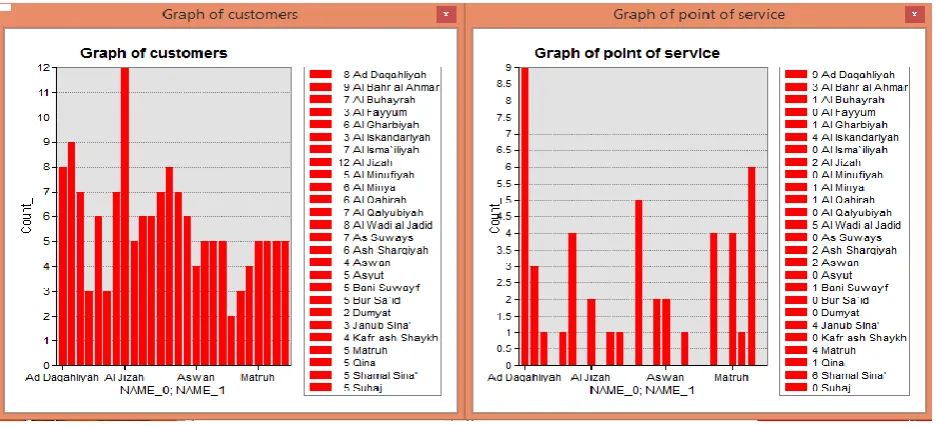
ESULTSAn E-service website was designed and implemented for check The system and the relation between customers and
points of service based on the location. Figure 7, shows the number of customer & points of services charts based on the cities (Geolocation).
Fig.7. (a) Customer Graph Fig.7. (b) Point of service Graph
Table 1, Given the values in the table, calculate the correlation coefficient between each of the two variables and customer service points and. The correlation coefficient (R) is used for measuring the relation between the number of customers and the number of points of service. According to the data in table 1, R=0.2.
V.
C
ONCLUSIONThe description of the geographical information systems on the Internet for e-service systems has been introduced. The aim is to take advantage of location services and decision-making. Test data produced a correlation coefficient = 0.2, which indicates a weak relation of
distributing point of services over polygons (geographical zones) with respect to the number of customers for each zone. This indicator guide the decision maker for distributing resources of service according to the number of customers based on the geographical zones
Table 1: The values of customers and point of service City Customers Point of
Service
1 Ad Daqahliyah 8 9
2 Ai Bahr alAhmar 9 3
3 AL Buhayrah 7 1
4 ALFayyum 3 0
5 ALGharbiyah 6 1
Copyright © 2015 IJECCE, All right reserved
International Journal of Electronics Communication and Computer Engineering Volume 6, Issue 5, ISSN (Online): 2249–071X, ISSN (Print): 2278–4209
7 ALSmaillyah 7 0
8 ALJizah 12 2
9 ALMinufiyah 5 0
10 ALminya 6 1
11 AL Qahirah 6 1
12 AL Qalyubiyah 7 0
13 AL Wadialjadid 8 5
14 AS Suways 7 0
15 ASh sharqiyah 6 2
16 ASwan 4 2
17 ASyut 5 0
18 Bani suwayf 5 1
19 Bur said 5 0
20 Dumyat 2 0
21 Janub sina 3 4
22 Kafr ash shaykh 4 0
23 Matruh 5 4
24 Qina 5 1
25 Shamal sina 5 6
26 Suhaj 5 0
R
EFERENCES[1] Alberto Calzada1, Jun Liu1, Hui Wang1, Anil Kashya, (2013);
"A GIS-based Spatial Decision Support Tool Based on Extended Belief Rule-Based Inference Methodology'' Journal Atlantis Press, p.1
[2] Chen Chen Chuanxiong Guo Yunxin Liu Helen J. Wang, (
2007);'' Mining the Web for IP Address Geolocation'' Journal Microsoft Research-Asia,p.2
[3] CornelGhiţă,(2014).''A Decision Support System for Business
Location Based on open gis Technology and Data'' Managing Global Transitions,vol,12,p.1.
[4] Claudia Pelizaro (2006) ''SPATIAL (GIS-BASED) DECISION
SUPPORT SYSTEM FOR THE WESTERNPORT REGION'', MONASH UNIVERSITY EPRESS, vol 2,NU 3, p.5,6.
[5] Ming-Hsiang Tso and Daniel Lusher,(2015).Mapping Web
Pages by Internet Protocol (IP) addresses: Analyzing Spatial and Temporal Characteristics of Web Search Engine Results'', The International Symposium on Cartography in Internet Ubiquitous Environments, p.2.
[6] Martin Kesselman, (2014) .''Geographic information systems
(GIS) and libraries: concepts, services and resources'', Emerald Group Publishing Limited, NU 8, p.8.
[7] Peyman Javadi,(2011).''Impact of E-Service Quality on
Sustaining Competitive Advantage for Iranian IT firms'',Master program Electronic Commerce,Luleå University of Technology Department of Business Administration, Technology and Social Sciences, p.10.
[8] Rowley, J. (2006), “An analysis of the e-service literature:
Towards a research agenda”, Internet Research, Vol. 16 No. 3, pp 339-359.
[9] Tarik Turka, Olgun Kitapcib, I. Taylan Dortyolb, (2014) .''The Usage of Geographical Information Systems (GIS) in the Marketing Decision Making Process: A Case Study for Determining Supermarket Locations'' Procedia - Social and Behavioral Sciences, p.2.
[10] Thania Rendon Sallard,(2009). Amulti- Agent System
framework to support the decision- ma king in complex real-world domains''. Master’s Thesis, Universitat Politècnica de Catalunya, P.20.
[11] Raid S. Sarhan, Bahaa T. Shabaha and Hazem El Bakry, “Design
of an Efficient Integrated System for Ambulance Management,” International Journal of Electronics Communication and Computer Engineering, vol. 6, issue 4, July 2015, pp. 509-515.
[12] Hesham Ahmed Hassan, Hazem El-Bakry, and Hamada Gaber
Abd Allah, “Design of Multi-Criteria Spatial Decision Support System for Improving Animal Production,” IAES International
Journal of Artificial Intelligence, vol. 2, issue 3, September 2013, pp. 117-124.
[13] Hesham A. Hassan, Hazem M. El-Bakry, and Hamada Gaber
Abd Allah, “A Novel Spatial Decision Support System for
Improving Animal Production,” Proceedings of the 12th
International Conference on Artificial Intelligence, Knowledge Engineering and Data Bases (AIKED '13), Cambridge, UK, February 20-22, 2013, pp. 49-54.
[14] Hesham Ahmed Hassan, Hazem M. El-Bakry, and Hamada
Gaber Abd Allah, “A New Multi-Criteria Spatial Decision
Support System for Improving Animal Production,”
International Journal of Computational Linguistics and Natural Language Processing, vol. 1, issue 12, December 2012, pp. 186-191.
[15] Hesham A. Hassan, Hazem M. El-Bakry, and Hamada Gaber
Abd Allah, “Visualization for Levels of Animals Diseases by Integrating OLAP and GIS,” International Journal of Computer Science and Information Security, vol. 10, no. 7, July, 2012, pp. 44-50.
[16] Hesham A. Hassan, Hazem M. El-Bakry, and Hamada Gaber
Abd Allah, “A New Approach for Computing Levels of Animals
Diseases,” Proceedings of the 6th WSEAS European Computing
Conference (ECC '12), Prague, Czech Republic, September 24-26, 2012, pp. 281-290.
[17] Hazem M. El-Bakry, and Wael A. Awad, “Geographic
Information System for Railway Management,” Proc. of 3rd