Incorporation of Adaptive Mutation based on Subjective Evaluation in
an Interactive Evolution Strategy
Praminda Caleb-Solly, Jim Smith
Faculty of Computing, Engineering and Mathematical Sciences, University of the West of England, Bristol, BS16 1QY, UK
{Praminda.Caleb-Solly, James.Smith}@uwe.ac.uk
Abstract- A rapidly emerging model in the field of adaptive computing is the symbiosis of human expertise with evolutionary algorithms for user controlled and directed search. The two aspects in any EA are the selection of individuals to reproduce based on some measure of their quality or fitness and the application of variation operators to produce new solutions. In the context of interactive evolution these aspects are compounded by the need for rapid convergence to prevent user fatigue and to provide the user some control over the generation of new solutions. Elsewhere [5], we have examined different policies for best incorporating the user into the evaluation and selection process. In this paper we explore the hypothesis that user assigned fitness represents a source of information that can be used to control the variation process: effectively to broaden the search if none of the current solutions is promising, or focus the search and improve convergence speed in the vicinity of a good solution. The main aims of this study, therefore, are to analyse the advantages of using a user directed adaptive mutation strategy over fixed mutation step sizes in terms of time to converge and robustness of the resulting solution. We present results showing a qualitatively different type of search process can be obtained by using the user assigned fitness to control the nature of the mutation process. There is also a synergy between user-based selection and fitness-based mutation control which out performs either system on its own.
1 Introduction
A rapidly emerging model in the field of adaptive computing is the symbiosis of human expertise with evolutionary algorithms for user controlled and directed search. This field of interactive evolution has been expanding into numerous and varied application areas since Dawkins introduced the evolution of “biomorphs” using subjective selection [1]. In reviewing the literature, applications using “interactive evolution” were found to range from generating Jazz solos [2] to personalising hearing aid characteristics [3]. In [4] Takagi divides research based on interactive evolution in three major fields - artistic, engineering and educational and lists 89 references demonstrating the scope of this idea. Human
expertise is exploited in terms of its unparalleled creativity and ability for pattern recognition. Interactive evolution is particularly appropriate for the optimisation of a quality metric which is difficult to mathematically define and possibly subject to change over a period of time, but can be assigned by a human on the basis of tacit expert knowledge. However, by including a human in the loop, a key requirement is consequently introduced: the need for rapid convergence to prevent the interactive process from becoming tedious for the human participant.
The reliance on human guidance and judgement to direct and control the search creates both the potential weaknesses and strengths. On one hand, human assessment tends to have a component of subjectivity and non-linearity of focus over time [5] but at the same time the ability to manoeuvre the search interactively could be exploited as a powerful strategy for adapting an otherwise naive evolutionary algorithm.
The work in this paper stems from the development of an automatic surface inspection system for classifying defects in sheet steel. In the first instance this involves identifying regions of interest (ROI) on the surface of the steel. Delineating regions of interest, and being able to identify them as defects, involves being able to separate them from the background accurately. This segmentation process is crucial, as the next step involves extracting appropriate descriptors, or features, for these regions which are then used for the classification. The main problem associated with segmentation arises from the noisy nature of the surfaces, in terms of amount of debris and an inherently irregular natural texture. Due to the nature of the defects found most commonly on hot rolled steel surfaces, there is often a compromise between segmenting the whole defect accurately and falsely segmenting areas of the noisy background. In these cases, the decision on the location of the segmentation boundaries is a compromise to give an acceptable level of ROI extraction over a whole set of images, using a single set of image processing parameters. This problem may be further complicated by the fact that the end user specifications of the segmentation might vary over time in non-quantitative terms. In such situations, it is not possible for the system to be delivered with a universal set of parameters and therefore the system needs to have the ability to be re-tuned easily and effectively by the user.
Typically in an ES a set of λ offspring are created by mutation from µ parents, with λ/µ in the range 5-10. These are then evaluated, and a new set of parents for the next generation is then selected as the best µ of the offspring (comma strategy) or of the union of the offspring and parents (plus strategy). In a previous paper [5] we showed the advantage of using a plus strategy over a comma in terms of reduced convergence time with comparable accuracy figures for resulting solutions. In addition, the relationship between consistency of user scoring and the progression of the run were analysed. There was a more significant reduction in consistency at the end of a run for the comma strategy than for the plus. All the experiments were conducted using a fixed mutation step-size, which clearly does not exploit the information regarding the quality of the solution that the user supplies, and is inevitably a compromise between exploration and exploitation. In this paper we explore the hypothesis that this information can be used effectively to broaden the search if none of the current solutions is promising, then to focus the search and improve convergence speed in the vicinity of a good solution. By immediately linking mutation parameters to user preferences, we save the time taken to evolve suitable parameters in self-adaptive systems, which is imperative in our time-constrained system. The main aims of this study, therefore, are to analyse the advantages of using a user directed adaptive mutation strategy over fixed mutation step sizes in terms of time to converge and robustness of the resulting solution.
2 Background
The method that was found to perform consistent and robust region detection for the steel images was developed using texture based segmentation. Texture describes the spatial distribution of sub-patterns of grey levels in an image, these sub-patterns are also called texels. Visually, texture can be described as fine, coarse, smooth, speckled etc. Mathematically, one of the ways in which textural information can be extracted is by computing the statistical relationships of the spatial distribution of the texels [6]. This involves the calculation of a set of grey level co-occurrence matrices (GLCMs) from which textural features, that is statistical measures that relate to characteristics such as homogeneity, contrast, correlation, variance and entropy, are calculated.
The segmentation strategy involves the image being simultaneously processed by two texture derivation modules. The two resultant texture images are normalised, low-pass filtered, and thresholded to extract the ROI, then recombined using a logical OR function. The variables that need to be specified for calculating the texture image include the texture measure, the size of the sliding window in which the texture parameter is calculated, sliding window step size, the distance between co-occurrence samples and a threshold value.
Objectively assessing the reliability and speed of the evolution of segmentation parameters necessitates having a standardised and quantified set of images to conduct the experiments. A set of 10 images were created each with an embedded defect of a different irregular shape and size. The edges of the defect were blended with the background texture using a non-linear gradient around the perimeter of the defects. The aim was to create a set of images with a high level of technical complexity, and ambiguity with regards to visual clarity of the boundaries of the defects, which were comparable to the steel images. Unless otherwise stated, all the experiments described here were conducted using the synthetic set of defect images.
An accuracy metric was formulated which gave a standardised measure by which segmentations using the different parameter sets could be compared. This metric gives equal weight to all previously identified ROI, and both under and over segmenting of the ROI are penalised equally. It is only possible to use it with known annotated data. The form is: Accuracy = ( Nc / Ns )* (Nc /Nd )
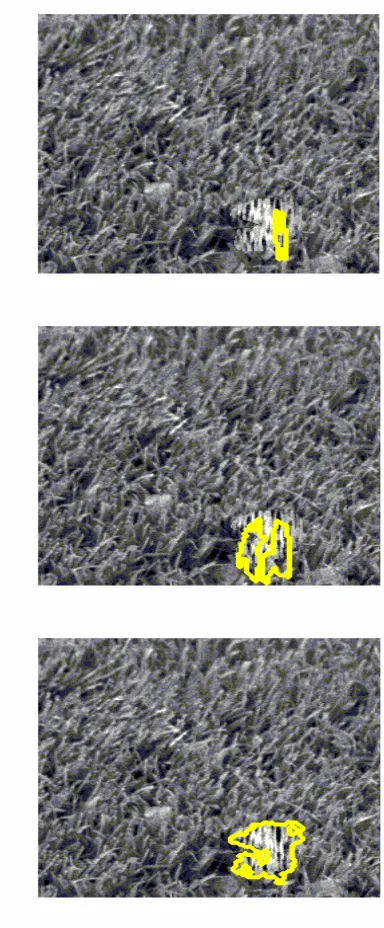
where Nc is the number of correctly segmented pixels, Ns is the total number of segmented pixels, and Nd is the number of ROI pixels in the known defect. Theoretically, using this metric a perfectly segmented image will achieve an accuracy of 1.0. Due to the highly textured nature of the background, and the merging of the defect using a non-linear gradient along the perimeter of the defect with the background, achieving a “perfect” segmentation, is not possible. However, it should be noted, an image segmented to a high standard, and visually discernable as being such, has a correspondingly high accuracy score [5]. As can be seen from figure 1, a parameter set scoring 0.663, calculated using the accuracy metric, results in a near perfect segmentation (for clarity the width of the segmenting line has been increased).
It should be noted that use of equal weighting and penalties is only one possible option in terms of user preference. There might be situations when users might not be interested in identifying a particular category of defect, or were more concerned about failing to segment defects than about falsely segmenting background noise. In this case the metric would have to be recalibrated, which might be non-trivial – hence our interest in interactive evolution.
3 Methodology
Figure 1 System Accuracy scores for segmentations resulting from different parameter sets. System Accuracy = 0.117 (top), 0.242 (middle), 0.663 (bottom).
Two key issues constrained the number of offspring, λ. The first was monitor size and resolution, which coupled with the visual clarity required for segmentation placed a limit on the number of images that could be simultaneously displayed. The second issue was time constraints, namely that the user’s availability and, more importantly, their mental concentration, limits the number of evaluations that can be conducted at each generation. In [5] we examined the use of (1, 8) and (1+7) strategies to select one parent, and used eight images per generation. The plus strategy was found to result in faster convergence time without compromising the solution. In this study each individual is comprised of 2 sets of variables, one for each of the 2 texture modules. Each set of variables includes a texture option, the height and
width of the sliding window and a threshold value, which makes a total of 8 variables in each individual. The increment, orientation and sample distance were fixed at 2, 0 and 1 respectively. A given set of values for each of these variables will collectively be referred to as a parameter set or offspring.
During the user scoring phase, (i.e. the interactive assignment of fitness values to the parameter sets), a screen displays 8 segmented images arising from the application of the parameter sets of the current generation to one of the images. The user then assigns a quality rating, between 0 and 10, to each of these. An option is to evaluate more than one image per generation. In this case the system or the user selects another image which is segmented and scored using the same set of 8 parameter sets. After all images have been segmented and the results scored in this way, the system averages the allotted scores for each offspring over all the images for the corresponding parameter set. An automatic version, without any user intervention, of the above system was also used, where the accuracy metric was used to generate a score for each solution. In both cases the parameter set with the highest score is the parent for the next generation.
Each set of variables within the offspring is created by mutation from the corresponding ones in the parent, and the design of the mutation operator takes into account that there is a linkage that exists between the variables within a parameter set, for example between the texture measure and the size of the window. Maintaining a reasonable level of linkage during mutation ensures the propagation of good solutions, so it is important to maintain this, while still allowing for reasonable levels of perturbation, in any mutation strategy adopted.
The following mutation strategy is designed to take the above limitations into account without compromising efficiency of the search. Each set of variables within the offspring is created by mutation from the corresponding ones in the parent as follows:
- With probability pm, a new random texture option is chosen, also a new threshold is randomly chosen uniformly from (Tmin, Tmax) and the height and width of the sliding window chosen at random uniformly from (Wmin, Wmax). (Tmin, Tmax) being the minimum and maximum logical values for the threshold. (Wmin, Wmax) being the minimum and maximum logical values for the height and width of the sliding window.
4 Review of Results on User-Evaluation
In [5] we reported on experiments evaluating the efficiency of comma or plus strategies in terms of reduced convergence times using the synthetic images. Various training sets comprising of 3 images per generation were used, and a fixed mutation step size (MSS), σ = pm = 15 was found to yield reliable results. Pooling the results from all runs, the median number of generations were 19 and 8 for the comma and plus strategies respectively. Based on the results of the non-parametric Wilcoxon test, we can say that with 92% confidence the plus strategy leads to shorter mean run times.
Human assessment is likely to have a high component of subjectivity and non-linearity of focus. It is important to assess whether, and to what extent, the efficiency of the evolutionary search is compromised by introducing too much noise in the form of human assessment. This implies that in the first instance it is necessary to analyse the nature of the variability of the human assessment. To this effect, user scoring behaviour in terms of consistency over the period of a run was analysed by splitting the number of generations in each run into thirds to define a beginning, middle and end stage for each run and then calculating correlation coefficients between the user score and system accuracy values. These experiments were conducted for both the comma and plus strategy. Median values of user scores for runs conducted using the plus strategy show a more marked increment between stages and are higher than those using the comma strategy indicating a possible loss of good solutions in the latter. In addition, correlation coefficients were calculated to assess the correspondence of user scores with system accuracy. These showed that the plus strategy showed higher correlation in each phase than the comma, the latter in particular falling off in the final stages, suggesting a lowering concentration.
One of the potential disadvantages of interactive evolution is the relatively high commitment and reliance on user time for scoring the images. It is therefore important to determine if adequate levels of accuracy and generalisation can be achieved using a fewer number of training images at each generation. In [5] we presented results for the plus strategy obtained using 3 images per generation and one image per generation, where the single image was held constant, or was randomly selected each generation. It was shown that using just one random image per generation resulted in comparable accuracies as using three images per generation. It is also important to note that the time taken to reach this level of performance is reduced when only one image is used per generation as opposed to three.
5 Results for Different Mutation Policies
As stated earlier, preliminary experiments showed that the system was relatively robust using the initial value of 15% for mutation step size, σ, and probability of
mutation, pm. Having established correlation between the system accuracy and user scores, and robustness of training sets, the effects of different values for σ and pm
were investigated in more depth. An automated version of the system was developed which enabled the finding and verification of appropriate values of parameters controlling the ES algorithm. The automation was in terms of using the accuracy metric, which allowed the scoring of the segmented images in the training set and test sets to be allocated by the system. In the first instance this was used to evaluate different fixed mutation rates in order to select one which resulted in the shortest convergence times. Six different mutation step sizes, σ∈
(5, 10, 15, 20, 25, 30), were tested. At every generation each parameter set had a fitness assigned by scoring a segmentation of a randomly chosen image from the training set. It also had a "test" accuracy calculated by averaging the auto-scores from segmenting images of a separate test set. This was unseen by the algorithm other than as the termination criterion.
The results shown in Figure 2 were obtained using selection based on auto-scoring one random image out of the training set per generation. Ten runs for each mutation step size value were made. The values for the number of generations/run shown in figure 3a were derived by using a off point for the test set accuracy of > 0.6. This cut-off value was judged as being reasonable due to the fact that a system score of 0.6 using the accuracy metric for a set of test images, results in a segmentation that is visually perceived as almost perfect. As can be seen from figure 3a, the box plots show that there is high level of variability between the results of runs obtained using the different mutation step sizes. Comparing the box plots showing the number of generations in each set, it can be seen that a fixed mutation step size of 15 results in relatively lower runs lengths. Using a one way ANOVA, the probability that these results are not significantly different is 0.0147. The p value from the non-parametric Kruskal-Wallis test was 0.0047, confirming that there is a statistically significant difference in the mean number of generations using the different mutation step sizes.
In order to investigate the benefits of user-directed mutation rates, we created four functions with very different profiles for mapping accuracy scores to corresponding mutation step sizes, σ. These profiles were generated on the basis of the experiments using the different fixed mutation step sizes and the range of concave to convex shapes were designed to explore the region of the typical U-shaped curve obtained by graphing the means of the fixed mutation step sizes. Each of these was created by choosing a set of mutation rates for different integer evaluation scores, and then fitting a polynomial curve to these to provide for the cases when averaging produces non-integer scores. The curves used are shown in Figure 3, As can be seen, all vary between random resetting (i.e. mutation probability of 0.5) for segmentations scored at 0, through to no change for perfect segmentations. F2 is near linear, F4 and F1 are concave (thus reducing the mutation probability for low scores), and F3 has the reverse effect, with the probability of substantial change in parameters kept high until the user allots a relatively high score.
[image:5.595.311.537.105.301.2]In the first instance, it was necessary to establish which of the four mutation profiles gave the best results. In order to do this efficiently, the auto-scoring system was used.
Figure 3 Mutation Step Size Function Curves. Starting from bottom for evaluation score 5, order of curves is F4, F1, F2, F3
From previously conducted experiments it was observed that the maximum system accuracy obtained using auto-scoring was 0.75. This prompted a need to scale the accuracy metric score allotted to the training image so that it was in the range 0 to 10, which would result in an equivalent coverage of the range of mutation rates as during the human-scoring. The experiments were performed using one random image from the set of 5 training images at each generation, which has been found to result in robust solutions comparable with those using 3 images per generation and has the advantage of efficiency in terms of utilising less of the user’s time.
Ten runs were conducted for each variable MSS function with auto-scoring using a cut-off point for the test accuracy of 0.6 as before. The results shown in Figure 4 suggest that functions F1 and F4 generate the best results in terms of lower run lengths. Although the difference in mean run length is not statistically
significant, the worse case, as indicated by the upper quartiles is. This is sufficient rationale to favour F1 and F4.
Figure 4 Run length statistics with auto-scoring and different functions for adaptive MSS, termination when test score >0.6.
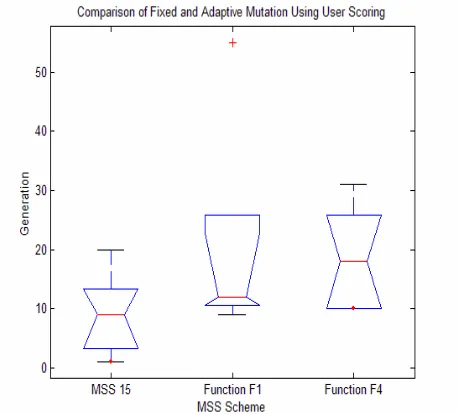
Having established that F1 and F4 were the most promising adaptive mutation strategies using system scoring, they were then compared to a fixed MSS of 15 with user scoring, again using one random image from a set of 5 per generation. These results are shown in Figure 5. As can be seen, a fixed MSS of 15 may be faster for synthetic images but the results using an adaptive mutation strategy based on attenuation curve F1 are not significantly worse. Furthermore, as Figure 2 shows, it was necessary to get the right fixed mutation rate and this will of course be problem dependant.
Figure 5 Comparison of Fixed and Adaptive Mutation Using User Scoring
[image:5.595.312.541.490.697.2]the user’s choice of scores to allot, in order to implicitly control the rate of exploitation vs. exploration. Figure 6 shows a side by side comparison of the run-lengths using adaptive mutation strategies with system and user scoring for F1 and F4, it can be seen that these are considerably lower in the user scoring scenario. For F1 we can say with 73% confidence that user scoring results in reduced mean run times, and for F4 we can say the same with 98% confidence. This certainly suggests that there is some kind of synergy, whereby the user allocates scores to “promising” segmentations in order to fine-tune the search around that set of parameter values.
Figure 6 Comparison of System and User Scoring Using Adaptive Mutation
[image:6.595.57.275.216.379.2]In order to analyse and visualise the convergence curves using the fixed and adaptive mutation strategies we created plots of the percentage of time in a run spent at different score levels relative to the run length and then aggregated over all the runs for each set of experiments. These reveal the adaptive strategy showing rapid progress to the maximum user score (i.e. high exploitation with lower mutation rates) once a good region has been identified, but before that there are proportionally longer periods of low scores indicating widespread search (exploration via higher mutation) (see Figure 8).
Figure 7 Percentage of time spent at different scoring levels with user scoring and fixed MSS.
In contrast the fixed mutation strategy is often seen to have a drawn out end-game, taking time to fine tune
because the fixed mutation rate has to be high to balance exploration with exploitation, as can be seen in Figure 7.
Figure 8 Percentage of time spent at different scoring levels with system scoring and adaptive MSS.
[image:6.595.311.510.395.725.2]To explore whether this is just a characteristic of user scoring or a trait of using the adaptive mutation strategy, the convergence curves of the fixed and adaptive mutation strategies using system autoscoring were compared, the run-length being taken as the point at which the score on the test set went above a threshold of 0.6. The system-allotted fitness vs. time for each run in shown in Figures 9a and 9b, median filtered for clarity.
Figure 9 Run progression with system scoring. (a
[image:6.595.67.285.547.708.2]As can be seen the same effect is noticeable, albeit slightly obscured by that fact that in one run with adaptive scoring (9b) the system finds a good quality solutions, and then apparently abandons it to do more exploration. This would not be possible with a plus selection strategy, but does illustrate escape from a local optimum. The pattern is more clearly evident by viewing the results aggregated as a percentage of time in a run spent at different score levels relative to the run length (Figure 10).
Figure 10 Comparison of System scoring profiles between fixed and adaptive MSS as percentage of time spent at different scoring levels.
The final test of the interactive evolution strategy using adaptive mutation was the segmentation of the steel images. Assessments were on the basis of convergence, mean number of generations to achieve convergence, and generalisability of the solutions. Initial results showed that using one random image per generation took too long to generalise over different defect classes for the user to maintain concentration. So for this experiment 3 representative images were selected for training. The images had varying intensity backgrounds with bruises of different forms. Figure 11 shows the application of one of the successful parameter sets on two test images. It is significant to note that the “rolled in scale” in figure 11a
has been identified as one entity, and the bruise in figure 11b includes the concave depressions on either side of the central depression. The inclusion of both these characteristics in the segmentation will enhance the reliability of the classification of the defect types.
[image:7.595.314.505.249.410.2]The median number of generations to reach a maximum user score of 10 using 3 training images per generation for five runs was 11. This took about 1 hour on a 3GHz PC. Future work will consider other means to reduce this to a practical timescale such as seeding the search with good solutions and using fewer images per generation.
6 Conclusions
The two aspects in any EA is the selection of individuals to reproduce based on some measure of their quality or fitness and the application of variation operators to produce new solutions. In the context of interactive evolution these aspects are compounded by the need for rapid convergence to prevent user fatigue and inconsistency and to provide the user some control over the generation of new solutions. Elsewhere [5], we have examined different policies for best incorporating the user into the evaluation and selection process.
When using a fixed mutation rate there is a trade-off between having a value which is sufficiently high to permit rapid exploration of the space of possible solutions early in the run, and also escape from local optima, whilst at the same time not being so high that it is difficult to achieve fine-tuning (exploitation) at the end of the run. Reviewing the literature on EA research it can be seen there has been significant effort expended into solving this problem by varying the mutation rate according to some schedule or algorithm. In “self adaptation”, the method most widely accepted, the space of possible mutation rates is searched in parallel to the space of possible problem solutions by the same EA by adding to each member of the population an extra variable which encodes for the mutation rate to be applied. The idea is to exploit a correspondence between the quality of the search operator (in this case the mutation rate), and the quality of the resultant solution when that search operator is applied to a parent. These methods have been shown in many papers to work very well in practice, resulting in robust search with the added benefit of reducing the number of algorithm parameters that the designer should choose. However the added variable does of course increase the search space size, which can cause a slight increase in mean run-times.
This research demonstrates an alternative means of adapting the mutation rate which directly exploits the implicit knowledge of the user’s perception of where they are in the search process. Further, it provides the user with an immediate means of broadening the search, when they feel that the region of the search space that they are exploring is not of sufficient quality. This is achieved by directly linking the mutation rate applied to a parent to the score allotted by the user. Thus low scores lead to a higher mutation rate, and hence higher probability of creating offspring which are very different from the parent. In contrast a high-scoring parent has a low mutation rate assigned to it, and therefore offspring are more likely to be similar, permitting fine tuning in the region of the search space close to the parent.
Here we have presented results showing a qualitatively different type of search process can be obtained by using the user assigned fitness to control the nature of the mutation process. The results show that the adaptive strategy shows rapid progress to the maximum user score (i.e. high exploitation with lower mutation rates) once a good region has been identified, but before that there are
proportionally longer periods of low scores indicating widespread search (exploration via higher mutation).
There is also a synergy between user-based selection and fitness-based mutation control which out performs either system on its own. Examining the single runs it can be seen that by downgrading the score to a previously favoured solution the system can be made to abandon its focus on a localised area of the parameter space and re-direct its attention elsewhere. This is of particular significance in an environment where rapid system re-configurability can mean a large saving in terms of costs.
This would not be possible using autoscoring methods, and the immediate change of mutation parameters provides vital time saving compared with other methods such as self-adaptation.
References
1. Dawkins, R., (1986) The Blind Watchmaker. Longman Scientific & Technical, UK. ISBN: 0582446945
2. Biles, J. A. (1994). GenJam: A genetic algorithm for generating jazz solos. In ICMC Proceedings 1994. The Computer Music Association.
3. Takagi, H., Ohsaki M. (1999): IEC- based Hearing Aid Fitting. Proceedings of Int’l Conf. On System, Man and Cybernetics (SMC’99), Vol 3, 657-662 IEEE.
4. Takagi, H. (1998) Interactive Evolutionary Computation: System Optimization Based on Human Subjective Evaluation. The IEEE International Conference on Intelligent Engineering Systems (INES'98) Vienna, Austria, September 17-19, 1998, (INES 98)
5. Caleb-Solly, P., Smith, J. (2004) Interactive Evolutionary Strategy Based Discovery of Image Segmentation Parameters, Procs of the 6th Int. Conf on Adaptive Computing in Design and Manufacture, UK, April 2004, Springer.
6. Haralick, R.M., Shanmugam, K., Dinstein, I. (1973) Texture Feature for Image Classification. IEEE Transactions on Systems, Man and Cybernetics, Vol. SMC-3, No 6, November, pp 610-620.


![Poly[tetrakis(μ4 4,6 dimethyl 5 nitrobenzene 1,3 dicarboxylato κ2O1:O1′:O3:O3′)bis(pyridine κN)dizinc]](data:image/gif;base64,R0lGODlhAQABAIAAAP///wAAACH5BAEAAAAALAAAAAABAAEAAAICRAEAOw==)