Quantum pathogen evolution by
integron-mediated effector capture
Joseph D. Payne
A thesis submitted in partial fulfilment of the requirements of the
University of the West of England, Bristol for the degree of Doctor of
Philosophy.
Faculty of Health and Applied Sciences, University of the West of
England, Coldharbour Lane, Bristol, BS16 1QY.
This copy has been supplied with the understanding that it is copyright material
and that no quotation from this thesis may be published without proper
Abstract
Plant pathogenic Pseudomonads are responsible for the loss of millions of pounds in crop revenue each year. They export effector molecules via the type three secretion system into the plants’ cells in order to elicit disease. If the plant has the corresponding resistance genes to detect the type three effector molecule then the plant will mount an immune response called the plant hypersensitive response (HR). Type three effector molecules can also supress the plants’ immune response including pathogen associated molecular pattern triggered immunity and effector triggered immunity.
Pseudomonads can evade HR by potentially gaining different effector molecules using mobile DNA elements. Integrons are one such type of element. Integrons are elements that allow bacteria to acquire and store genes from the environment particularly during times of stress. They also allow differential expression of the captured genes dependent on the environmental conditions.
Integron-like elements (ILEs) within Pseudomonas syringae pathovars and other Pseudomonads can be identified by using conserved genes such as the xerC integrase and the UV damage repair gene rulB. RulB encodes a DNA polymerase V which appears to be a hotspot for ILE insertion. Using the rulAB operon, the xerC gene and the ILE insertion junction, rulB-xerC, it was possible to identify a number of ILEs. The screening of 164 plant pathogenic Pseudomonas strains revealed new ILEs from 21 strains all containing at least one type three effector molecule. The screening also revealed that the xerC integrase was conserved across multiple ILEs within plant pathogens.
Expression studies of the ILE integrase genes, type three effector genes and the disrupted rulB gene showed that the genes on both ILEs present in P. syringae pv. pisi 203and pv. syringae 3023 are upregulated in times of cellular stress and DNA damage. This led to the conclusion that ILEs may be more active when the bacteria was in need of exogenous genes to overcome the cellular stress. The ILE may also be excised following DNA damage to restore full rulB functionality.
It was identified that rulB was a hotspot for ILE insertion but it was not known why the ILEs choose this site or if any other genes were required for ILE insertion. Cloned versions of the rulAB operon from the pWW0 plasmid found in Pseudomonas putida PaW340 showed that only rulAB was required for P. fluorescens ILE insertion but rulAB must be intact. P. syringae ILEs were also tested but did not show any insertion.
Due to ILEs inserting into and disrupting rulB their effect on UV tolerance was tested. A range of strains containing an intact rulB gene were tested alongside the ILE containing strains with increasing amounts of UVB irradiation applied. The results showed very minor differences in growth rates between the two groups with only 60 seconds UVB exposure causing a significant difference in growth rate at the 95% confidence interval between the two groups of strains.
Acknowledgements
The past four years at UWE have encompassed some of the best times in my life
so far along with some of the hardest. I have thoroughly enjoyed my time here
and have learnt a lot about my subject area and myself. I have many friends,
colleagues and family members to thank for making this a great experience.
Firstly I would like to thank my amazing family for always being there for me. In
particular my mother and father for all their love, support and hard work during
my studies. I would also like to thank my sister, Victoria, for always being there
for a moan, gossip or just a simple chat. Finally a special thank you to my
grandparents and great uncle for all their help.
The most important person throughout my PhD was Professor Dawn Arnold.
Without Dawn all of this work would not have been achieved. Dawn was a
fantastic supervisor and was always pushing me forward and developing me as
a researcher. Her years of experience are invaluable and helped me to generate
new ideas for my research. Dawn was not only my supervisor but she also
became a great friend, I hope to continue working with her and remain in contact
for many years.
I also need to thank Dr Helen Neale and Dr Carrie Brady for all of their help and
support in the lab which really aided me in my work. Without Helen and Carrie
lab work would have been much slower and nowhere near as fun!
My other supervisors, Professor John Hancock and Professor Robert Jackson
were a real help in terms of new ideas and developing my final thesis. Their
insight and experience was really appreciated and without them the process
would not have been as smooth. I also want to thank all of the technical team at
UWE especially Alison Halliday and Paul Deane. I also need to thank Professor
Roger Pickup from Lancaster University and Dr Glenn Rhodes from the Centre
for Ecology and Hydrology for their continued help and support.
A final thank you needs to go to all of my great friends who have really helped
me forget about work at stressful times and helped me relax. Two friends deserve
a really special thank you. Becky and Kieran without your help and friendship I
Contents
Abstract
Acknowledgements Contents
List of Tables List of Figures Abbreviations
Chapter 1. Introduction
1.1 Plant pathogenic bacteria.
1.2 Pseudomonads.
1.3 Pseudomonas syringae.
1.4 Pathogenicity factors.
1.5 Plant immunity and pathogen recognition.
1.5.1 Pathogen associated molecular patterns.
1.6 Effectors.
1.7 Type three secretion system (TTSS).
1.8 Effector evolution.
1.9 Integrons.
1.9.1 Integron-like elements present in the plant pathogen Pseudomonassyringae.
1.10Pseudomonas fluorescens.
1.10.1 An integron-like element moving from P. fluorescens chromosomes to plasmid pWW0 and rulAB as a hotspot for insertion.
1.11 Aims.
Chapter 2. Materials and Methods
2.1 Bacterial strains.
2.2 Media and culture conditions. 2.2.1 Making rifampicin mutants.
2.3 DNA extraction.
2.3.1 Genomic DNA extraction. 2.3.2 Plasmid DNA extraction.
2.4 Polymerase chain reaction (PCR). 2.4.1 Semi-degenerate primer PCR. 2.4.2 Primer design.
2.5 Agarose gel electrophoresis.
2.6 Clean-up of PCR products or PCR products from an agarose gel.
2.7 Quantifying DNA purity with a Nanodrop 1000.
2.8 DNA hybridisation via vacuum dot blotting.
2.8.1 Producing chemiluminescent labelled probes. 2.8.2 Transferring DNA onto a nylon membrane.
2.9 Hybridisation of DIG-labelled probe to DNA. 2.9.1 Prehybridisation of blot with DIG easy hyb.
2.9.2 Hybridisation of DIG labelled probe to DNA on the blot.
2.10 Detection of hybridised probes.
2.11 DNA sequencing.
2.11.1 Sequencing of PCR products.
2.11.2 Preparation for whole bacterial genome sequencing.
2.12 Bacterial mating. 2.12.1 Filter matings.
2.12.2 Eppendorf tube matings.
2.12.3 Electroporation of plasmid DNA into recipient cells.
2.13 Apoplastic fluid extraction.
2.14 Quantitative reverse transcription PCR (RT-qPCR).
2.14.1 Preparation of bacteria for gene expression studies in plant apoplastic fluid.
2.14.2 Preparation of bacteria for gene expression studies in planta.
2.14.3 Preparation of bacteria for gene expression studies following bacterial conjugation.
2.14.4 Preparation of bacteria for gene expression studies following exposure to sub-optimal temperatures.
2.14.5 Preparation of bacteria for gene expression studies following exposure to mitomycin C.
2.14.6 RNA protect. 2.14.7 RNA purification.
2.14.8 Complementary DNA (cDNA) synthesis.
2.14.9 Reverse transcription quantitative PCR (RT-qPCR). 2.14.10 Statistics and heat map analysis of gene expression.
2.15 Ultra-violet tolerance tests.
2.16 Creation of artificial rulAB containing vector. 2.16.1 Ligation of gene into pCR2.1 vector. 2.16.2 Transformation.
2.16.3 DNA digest of cloned fragments.
2.16.4 Digesting and dephosphorylating the broad host range vectors.
2.16.5 Purification of broad host range vectors.
2.16.6 Electroporation of construct into desired strains. 2.16.7 Producing chemically competent E. coli DH5α cells. 2.16.8 Heat shock transformation of E. coli cells.
2.17 ILE circular intermediate tests.
2.18 Frequency of ILE movement into rulB.
Chapter 3. Screening for integron-like elements and associated regions in Pseudomonas bacteria.
3.1 Introduction.
3.2 Results.
3.2.1 Confirming that P.putida PaW340 has no rulAB gene. 3.2.2 Strain confirmation for DNA hybridisation probe construction.
3.2.3 DNA hybridisation screening for ILEs and associated regions.
3.2.4 Producing DIG labelled probes.
3.2.5 Control hybridisations to ensure rulAB, xerC and rulAB- xerC probes hybridise.
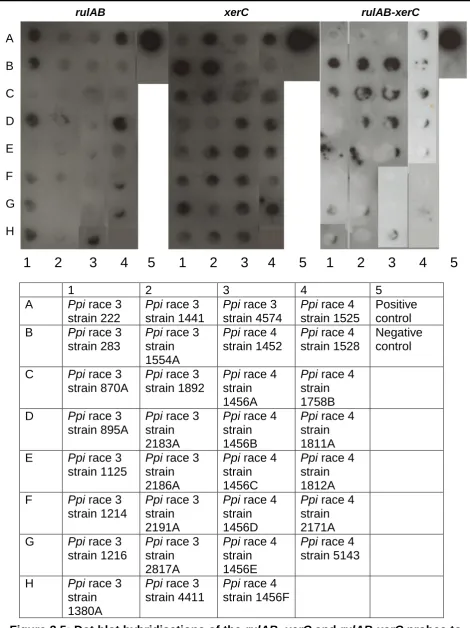
3.2.6 Hybridisation of rulAB, xerC and rulAB-xerC probes to Pseudomonas syringae pv. pisi strains.
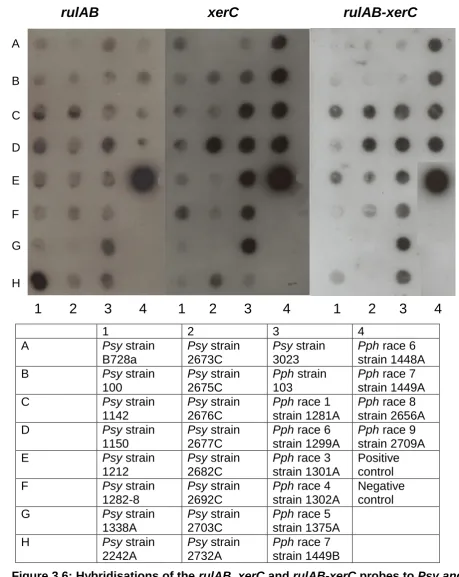
3.2.7 Hybridisation of rulAB and xerC probes to P. syringae pv. syringae and P. syringae pv. phaseolicola strains.
3.2.8 Hybridisations of rulAB, xerC and rulAB-xerC probes to P. syringae pathovars maculicola, tomato, antirrhini,
lachrymans and glycinea.
3.2.9 Hybridisation of rulAB, xerC and rulAB-xerC probes to different Pseudomonas species.
3.2.10 PCR screening for ILEs and associated regions in P. syringae pathovars and Pseudomonas species. 3.2.11 PCR screening of rulAB genes in P. syringae pathovars.
3.2.12 PCR screening of xerC genes in P. syringae pathovars.
3.2.13 PCR screening of the rulAB-xerC junction region in P. syringae pathovars and other Pseudomonas species.
3.2.14 Comparison of hybridisation versus PCR results.
3.3 Discussion.
Chapter 4. Sequence analysis of previously unidentified integron-like elements from Pseudomonas syringae pathovars.
4.1 Introduction.
4.2 Results.
4.2.1 Sequence analysis of rulAB-xerC region indicative of ILE insertion.
4.2.2 Sequence analysis of the intergenic region between the end of rulB’ and the ILE start.
4.2.3 PCR tests of the ILE variable end to observe if variation occurs.
4.2.4 Analysis of bacterial genomes to assess ILE content and variability.
4.3 Discussion.
Chapter 5. Expression studies of integrase and type three effector genes from two integron-like elements identified in
Pseudomonas syringae.
5.1 Introduction.
5.2 Results.
5.2.1 Checking apoplastic fluid preparations.
5.2.2 Expression of P. syringae pv. pisi 203 ILE genes.
5.2.3 Expression of P. syringae pv. syringae 3023 ILE genes.
5.3 Discussion.
Chapter 6. Movement of integron-like elements between different
rulAB systems.
6.1 Introduction.
6.2 Results.
6.2.1 ILE movement using pWW0 as a basis for rulB.
6.2.2 Cloning two different rulAB operons into pBBR1MCS-2. 6.2.3 Cloning different versions of the pWW0 rulAB operon looking for a specific ILE insertion target.
6.2.4 Comparison of the frequency of FH1 ILE movement into native rulAB on pWW0 and the cloned version on
pBBR1MCS-2.
6.2.5 Testing if ILEs circularise during movement to different rulB genes.
6.3 Discussion.
Chapter 7. What effect does disruption of the rulB gene have on bacterial growth under ultra-violet radiation stress?
7.1 Introduction.
7.2 Results.
7.2.1 Assessing the impact of UVB irradiation on Pseudomonas strains that contain an intact rulB gene.
7.2.2 Assessing the impact of UVB radiation on bacterial strains that contain an ILE disrupted rulB gene.
7.2.3 Analysing the growth rates of Pseudomonas strains following UVB exposure.
7.2.4 End point bacterial growth analysis following UVB exposure on strains containing either an intact or disrupted rulB gene.
7.3 Discussion.
Chapter 8. General discussion and conclusions.
8.1 Discussion.
8.2 Conclusions from research.
8.3 Future research.
References
Appendix I: Bacterial strains and plasmids used during research.
Appendix II: Chemical composition of media, buffers and solutions.
Appendix III: Sequence alignment of conserved ILE junction.
Appendix IV: Mean X-fold values of gene expression.
212
217
217 222 223
225
253
257
260
1.1 1.2 2.1 2.2 2.3 2.4 2.5 2.6 3.1 3.2 3.3 3.4 3.5 3.6 3.7 3.8 3.9 3.10
Representatives of plant pathogenic bacteria.
Host and habitats of four different Pseudomonas
species.
Bacterial strains used in this study.
Primers used for PCR and hybridisation probes.
Primers and fluorescent probes used for RT-qPCR.
Primers used to clone various versions of rulAB.
Primers used to confirm ILE movement into cloned rulAB
versions in pBBR1MCS-2.
Primers used to identify any ILEs that had formed a
circular intermediate during movement between rulB
genes.
List of strains, including isolation information, used
throughout the screening tests.
Differentiation of strains used to make hybridisation
probes on selective media.
Hybridisation result with rulAB, xerC and rulAB-xerC
probes from P. syringae pv. pisi. strains.
Hybridisation results with rulAB, xerC and rulAB-xerC
probes from P. syringae pv. syringae and phaseolicola
strains.
Hybridisation results with rulAB, xerC and rulAB-xerC
probes from various P. syringae pathovars.
Hybridisation results with rulAB, xerC and rulAB-xerC
probes from various Pseudomonas strains.
PCR screening of the rulAB’ region for P. syringae
pathovars.
PCR screening of the xerC gene in P. syringae pathovars
and Pseudomonas species.
PCR screening of the rulAB-xerC junction region in P.
syringae pathovars.
Comparison of hybridisation and PCR amplification screening results from P. syringae strains.
2 3 29 33 46 48 50 52 57 61 66 70 72 73 76 79 82 83
4.1
4.2
4.3
5.1
5.2
6.1
7.1
7.2 7.3
7.4
The 22 ILE containing strains from Pseudomonas
syringae.
QUAST output following Pseudomonas syringae
pathovar genome sequencing.
QUAST output following assembly of two read libraries
of two Pma strains,1852A and 5422, into one
assembled genome sequence.
Malate dehydrogenase assay on prepared plant
apoplastic fluids and plant cell lysate preparations.
Relative concentrations of different apoplastic fluid
preparations and normalisation data.
Breakdown of ILE insertion frequency PCR test results
into both pBBR1MCS-2 (pWW0rulAB) and pWW0.
List of Pseudomonas strains used for the UVB stress
growth assay along with their rulB determinant.
Growth rate values from linear regression analysis.
Comparison of normalised OD600 data for intact and
disrupted rulB genes at eight hours after UVB exposure.
Two-factor ANOVA of all strains tested for UVB
tolerance with replication.
94
106
107
122
123
174
190
205 207
1.1 1.2 1.3 1.4 1.5 1.6 1.7 1.8 1.9 1.10 2.1 3.1 3.2 3.3 3.4 3.5 3.6 3.7 3.8
Symptoms caused by Pseudomonas syringae.
Diagram showing the various secretion systems used by
P. syringae.
Outline of Plant Immune System.
Outline Model of Plant Immune Response.
The arrangement of the conserved hrp/ hrc genes within
the pathogenicity island bounded by the exchangeable
effector locus and the conserved effector locus.
The type three secretion system in action, how effector
proteins are exported into host cytoplasm.
The different ways in which effector genes’ functions can
be changed, lost or suppressed.
Capture of a gene cassette by an integron.
How integrons use integrase genes to capture novel
gene cassettes and how they are regulated.
Identified ILE within Pseudomonas syringae pv. pisi 203.
Outline of semi-degenerate amplification of
chromosomally inserted targets.
Identification of the four ILE related regions.
PCR confirmation that P. putida PaW340 contains no
rulAB gene.
PCR amplification of rulAB, rulAB-xerC and xerC regions
from P. putida (pWW0::kmr) and P. fluorescens
(pWW0::kmr::ILE FH1).
Hybridisation of the three ILE probes on control P. putida
and P. fluorescens strains.
Dot blot hybridisations of the rulAB, xerC and rulAB-xerC
probes to Ppi strains belonging to races three and four.
Hybridisations of the rulAB, xerC and rulAB-xerC probes
to Psy and Pph strains.
PCR Amplification of the rulAB’ region before the ILE
insertion point from P. syringae pv. pisi races 1, 2 and 3.
PCR Amplification of the xerC gene from P. syringae pv.
pisi races 1, 2 and 3.
5 6 9 10 15 17 19 21 22 24 32 55 60 61 63 65 69 75 78
3.9 4.1 4.2 4.3 4.4 4.5 4.6 4.7 4.8 5.1 5.2 5.3 5.4 5.5 5.6 5.7 5.8
PCR amplification of the rulAB-xerC junction region from
P. syringae pv. pisi races 1, 2 and 3.
The genetic structure of typical integrons.
Basic outline of an ILE along with the disrupted rulAB
operon.
Molecular Phylogenetic analysis by Maximum Likelihood
method looking at the ILE xerC.
Sequence alignment of the intergenic region between rulB’ and the ILE and its location between rulB’ and
xerC.
Position of variable end primers and the amplicon
produced.
Identifying if all of the potential ILEs have the same
variable end via PCR.
Sequence analysis of ILEs from P. syringae pathovars.
Partial ILE interpretation of genome sequence from Pma
1852A and 5422.
Promoter regions in integrons belonging to classes 1, 2
and 3.
Comparison of RT-qPCR technologies; SYBR Green
and TaqMan.
P. syrinage pv. pisi 203 ILE genetic makeup.
ILE gene expression heat map from P. syrinage pv. pisi
203 when tested in plant apoplastic fluid.
Gene expression of avrPpiA1 from P. syringae pv. pisi
203 ILE in plant apoplast.
Gene expression of avrPpiA1 from ILE P. syringae pv.
pisi 203 in planta.
ILE gene expression from P. syringae pv. pisi 203 when
tested in planta.
Gene expression of P. syrinae pv. pisi ILE genes
following 6 hours of conjugation with E. coli DH5α and E.
coli DH5α (pRK2013).
5.9 5.10 5.11 5.12 5.13 5.14 5.15 5.16 5.17 5.18 5.19 5.20 5.21 5.22
Viable counts of Pseudomonas syringae pv. pisi 203 and
pv. syringae 3023 following growth in media containing
mitomycin C for six hours.
ILE gene expression from P. syringae pv. pisi 203 when
incubated for six hours with the addition of mitomycin C.
Gene expression of ILE P. syringae pv. pisi 203
avrPpiA1 following UVB irradiation (302nm) for different
exposure times.
ILE gene expression from P. syrinage pv. pisi 203
following exposure to UVB irradiation for 15, 30, 45 and
60 seconds.
ILE gene expression from P. syringae pv. pisi 203
following growth at different sub-optimal temperatures.
Heat map matrix of ILE Ppi 203 gene expression
following various bacterial stresses.
Genetic makeup of ILE from P. syringae pv. syringae
3023.
ILE gene expression heat map from P. syringae pv.
syringae 3023 when grown in plant apoplastic fluid.
ILE gene expression from P. syringae pv. syringae 3023
when tested in planta.
Gene expression of ILE P. syrinage pv. syringae 3023
genes following 6 hours of conjugation with E. coli DH5α
and E. coli DH5α (pRK2013) together.
ILE gene expression from Psy 3023 when incubated for
six hours with the addition of MMC.
Type three effector, hopH1, expression from Psy 3023
when grown in media supplemented with increasing
concentrations of mitomycin C.
ILE gene expression from P. syringae pv. syrinage 3023
following exposure to UVB irradiation for 15, 30, 45 and
60 seconds.
Gene expression of P. syringae pv. syringae 3023 ILE
hopH1 following growth at sub-optimal temperatures.
5.23 5.24 6.1 6.2 6.3 6.4 6.5 6.6 6.7 6.8 6.9 6.10 6.11 6.12 6.13 6.14
ILE gene expression from P. syringae pv. syringae 3023
following growth at different sub-optimal temperatures.
Heat map matrix of P. syrinage pv. syringae 3023 ILE
gene expression following various bacterial stresses.
Versions of rulAB from pWW0 cloned into pBBR1MCS-2
to test ILE movement.
PCR of rulAB-xerC confirming ILE movement from FH1
chromosome into rulB on pWW0.
Midi plasmid preparation of pWW0 from P. putida
PaW340.
Empty vector controls with pBBR1MCS-2.
Cloning of pWW0 rulAB and PPHGI-1 rulAB.
PCR amplification of extracted pWW0 and PPHGI-1
rulAB operons from P. fluorescens FH1, Ppi 203 and Psy
3023.
ILE movement from P. fluorescens FH1, Ppi 203 and
Psy 3023 into cloned versions of rulAB from pWW0 and
PPHGI-1.
PCR amplification of three different pWW0 rulAB
versions.
Restriction digest of pWW0 rulAB, rulB and rulAB’-IP
regions from pCR2.1.
Amplified pWW0 rulAB regions from transformed P.
fluorescens FH1 cells.
Identification of FH1 ILE movement into cloned versions
of rulAB, rulB or rulAB’-IP present on pBBR1MCS-2.
Examples of ILE movement frequency gels for both
pBBR1MCS-2 (pWW0rulAB) and pWW0.
ILE circular intermediate PCR following conjugation of
either P. fluorescens FH1, Ppi. 203 and Psy. 3023 with
E. coli DH5α and E. coli DH5α (pRK2013).
ILE circular intermediate PCR of P. fluorescens FH1, P.
fluorescens FH4, Ppi. 203, Psy. 3023, Psy. B728a and
Pgy. 2411 following cold stress and UV irradiation stress.
6.15 7.1 7.2 7.3 7.4 7.5 7.6 7.7 7.8 7.9 7.10 7.11 7.12 7.13 7.14
Generic outline of how ILE circularisation PCR tests
work.
Direct reversal of pyrimidine dimers caused by UVB DNA
damage.
The Mut complex and DNA repair interaction.
How DNA polymerase V works.
Growth of Pseudomonas strains containing an intact rulB
gene without UVB (302nm) exposure.
Growth of Pseudomonas strains containing an intact rulB
gene following 30 seconds of UVB (302nm) exposure.
Growth of Pseudomonas strains containing an intact rulB
gene following 60 seconds of UVB (302nm) exposure.
Growth of Pseudomonas strains containing an intact rulB
gene following 120 seconds of UVB (302nm) exposure.
Growth of Pseudomonas strains containing a disrupted
rulB gene without UVB (302nm) exposure.
Growth of Pseudomonas strains containing a disrupted
rulB gene following 30 seconds of UVB (302nm)
exposure.
Growth of Pseudomonas strains containing a disrupted
rulB gene following 60 seconds of UVB (302nm)
exposure.
Growth of Pseudomonas strains containing a disrupted
rulB gene following 120 seconds of UVB (302nm)
exposure.
Linear regressions of bacterial growth over an eight hour
time period following UVB irradiation.
Linear regressions of normalised bacterial growth OD600
in Ln with intact and disrupted rulB plots overlaid.
Normalised growth curve of combined Pseudomonas
strains with an intact rulB gene following UVB exposure.
7.15
7.16
Normalised growth curve of combined Pseudomonas
strains with a disrupted rulB gene following UVB
exposure.
Nonhomologous and homologous end-joining to repair
DNA lesions.
209
Abbreviations and units
µF µg µL µm µM ADP Ap. ATP AWF bp CFU cm cv CW DNA DNase I dNTP EDTA eg. et al. ETI g GI GInts Gm HR hr(s) hrc hrp HSB IC IPTG kb KB kg Km KW L LB LSB M MDH mg MGE(s) microfarad(s) microgram(s) microliter(s) micrometre(s) micromole(s) adenosine diphosphate appendix adenosine triphosphateapoplastic wash fluid base pair(s)
colony forming unit(s) centimetre(s)
cultivar
Canadian Wonder (bean) deoxyribonucleic acid deoxyribonuclease I
deoxynucleotide triphosphate ethylenediaminetetraacetic acid exempli gratia (for example) et alia (and others)
effector triggered immunity gram(s)
genomic island
genomic island with three integrases gentamycin
hypersensitive response hour(s)
hypersensitive response and conserved hypersensitive response and pathogenicity high stringency buffer (see Ap. II)
Indigo carmine
Isopropyl β-D-1-thiogalactopyranoside kilo base(s)
Kings B media (see Ap. II) kilogram(s)
kanamycin (see Ap. II) Kelvedon Wonder (Pea) litre(s)
Luria-Bertani media (see Ap. II) low stringency buffer (see Ap. II) Mole(s)
malate dehydrogenase milligram(s)
min(s) mL mM mm MM NA NB-LRR ng oC OD ORF(s) PCR PAMP(s) PTI PRR pv. RE RM RNase rpm s/sec SD SDS SEM SSC Stm TAE TE TG U UV V w/v w/w xg x-Gal Ω minute(s) millilitre(s) millimolar millimetre(s)
M9 minimal media (see Ap. II) nutrient agar (see Ap. II)
nucleotide binding leucine rich repeat nanogram(s)
degrees Celsius optical density
open reading frame(s) polymerase chain reaction
pathogen associated molecular pattern(s) PAMP triggered immunity
pattern recognition receptor pathovar(s)
restriction enzyme Red Mexican (bean) ribonuclease
revolutions per minute second(s)
standard deviation
sodium dodecyl sulphate standard error of the mean
saline-sodium citrate buffer (see Ap. II) streptomycin (see Ap. II)
Tris base, acetic acid and EDTA (see Ap. II) Tris base and EDTA (see Ap. II)
Tendergreen (bean) Units
ultraviolet volt(s)
weight per volume weight per weight times gravity
Chapter 1. Introduction
1.1: Plant pathogenic bacteria.
Plant pathogens have been responsible for severe crop losses throughout
history and often result in human loss. The most famous human loss due to crop
failure was the mass starvation in Ireland during the potato famine of 1845-49
caused by Phytophthora infestans (Maloy, 2005).
Plant pathogenic bacteria have a tremendous impact on a wide variety of
agricultural crops ranging from fruit trees to garden ornamentals (Stavrinides,
2009) and are responsible for the loss of millions of pounds in crop revenue due
to crop damage each year. Understanding how these pathogenic bacteria interact
and evolve with their host plant species is of vital importance, not only to the
global agricultural market but also to smaller individual farmers, suppliers and
processers. Understanding this relationship between pathogenic bacteria and
their host is paramount to establishing effective and efficient disease
management programs around the world (Fry, 1982; Maloy, 2005).
Bacterial plant pathogens are largely confined to the Gram-negative
Proteobacteria. The most observed pathogens are represented in either the α, β
or γ subclasses (Table 1.1). Agrobacterium tumefaciens belongs to the
α-subclass and is the causative agent of crown gall in over 140 plant species
(Escobar and Dandekar, 2003). Within the β-subclass is Ralstonia solanacearum
which is responsible for bacteria wilts in plants, by colonising the xylem. Erwin
Frink Smith (1905) proved that bacterial wilts of tomato, pepper, eggplant and
Irish potatoes were caused by Ralstonia solanacearum (Li et al., 2005). Finally
the γ-subclass contains the largest number of plant pathogenic bacteria which
(Stavrinides, 2009). Pseudomonas syringae pathovars (pv.) cause many plant
diseases including bacterial speck on tomatoes and halo blight on beans (P.
syringae will be discussed further in Section 1.3). In order to better prevent plant
disease and crop damage it is essential to understand how plant pathogenic
bacteria behave and interact on a molecular basis.
Table 1.1: Representatives of plant pathogenic bacteria from the three subclasses of Proteobacteria, alpha (α), beta (β) and gamma (γ). (adapted from Garnier et al. 2000; Coenye and Vanadamme, 2003; Stavrinides, 2009; Madigan et al., 2012).
1.2: Pseudomonads.
The Pseudomonads are a diverse genera containing over one hundred
species, many of which are pathogenic species on either plants or animals (Özen
and Ussery, 2012). Pseudomonads have remarkable metabolic and physiologic
variability enabling them to colonise a diverse range of habitats and hosts ranging
from soil and plant environments to human and aquatic environments (Palleroni,
1992; Silby et al., 2011). Due to their variability Pseudomonadsare responsible
for many plant and human diseases across the globe (Table 1.2). Pseudomonas
infections in humans can be fatal if not treated quickly and with targeted
antimicrobial treatment. For example, P. aeruginosa can quickly colonise patients
Subclass of Proteobacteria
Example of Bacterial Species
Example Disease
Example Host
α Agrobacterium tumefaciens
Rhizobium leguminosarum
Crown Gall
Root Nodules
Rhubarb, Walnuts
Legumes
β Burkholderia cenocepacia
Ralstonia solanacearum
Sour skin
Bacterial Wilt
Onions
Tomato, Peppers
γ Pseudomonas syringae
Xanthomonas campestris
Bacterial Speck
Leaf Spot
Broad Range
who are in hospital for prolonged periods and can lead to meningitis, pneumonia,
and septicaemia (Pai et al., 2016; Bodey et al., 1983).
Table 1.2: Host and habitats of four different Pseudomonas species
(adapted from Silby et al., 2011).
Pseudomonad Host Habitat
P. syringae Plants (tomato, bean,
olive, tobacco, chestnut, soybean)
Soil
P. fluorescens Mostly non-pathogenic,
Plants
Soil, Water
P. putida Mostly non-pathogenic,
Plants
Soil, Plants
P. aeruginosa Animals, Humans, Plants
(Arabidopsis thaliana [Thale cress] and Lactuca sativa [lettuce])
Soil, Water, Skin Flora and most man-made environments
Pseudomonas bacteria are Gram negative and are generally aerobic with
a few exceptions being denitrifying (Palleroni, 1984). They can be either straight
or curved rods that are between 0.5-1 x 1.5-4 μm in size and are non-spore
forming with one or multiple polar flagella that assist in the bacteria's motility
(Madigan et al., 2012).
Phytopathogenic Pseudomonads have the ability to cause many different
plant diseases with various symptoms. These symptoms include cankers,
blossom, kernel, leaf or twig blight, dieback, leaf spots, soft or brown rot, galls
and mushroom blights (Schaad et al., 2001). Many of these bacterial species are
either foliar epiphytes or rhizosphere inhabitants. The most economically
important phytopathogenic Pseudomonas is P. syringae with over 50 pathovars
[image:22.595.116.556.159.404.2]1.3: Pseudomonas syringae.
P. syringae was first isolated from a diseased lilac in 1902 (Hirano and
Upper, 2000). P. syringae is of interest due to its importance as a plant
pathogenic bacterium and was ranked the number one plant pathogenic bacteria
by Mansfield et al. (2012) based on agricultural and economic impact. P. syringae
is particularly important to plant pathogenesis studies due to the species having
a wide host range that includes many commercially important crops (eg. tobacco
and soybean) and its ability to cause damage. P. syringae typically attacks plant
foliage causing the onset of chlorosis and eventually necrotic lesions on leaves
(Madigan et al., 2012). P. syringae causes a wide variety of plant symptoms
ranging from bacterial speck, fleck, cankers, halo blight, galls and brown spot
(Figure 1.1). For example, P. syringae pv. syringae strain B728A causes brown
spot disease of bean leaves (Silby et al., 2011), whereas P. syringae pv. pisi (Ppi)
causes water-soaked lesions on pea plants (Suzuki and Takikawa, 2004).
The P. syringae species contains many different pathovars. The term
pathovar relates to a group of bacterial strains which exhibit distinctive
pathogenicity towards one or more hosts and can include different symptoms.
The term pathovar is very useful when referring to relatedness between strains
due to their phenotypic properties, but cannot reveal how related two strains are
based on their genetic properties (Denny et al., 1988). Pathovars can be further
divided into different races (Young, 2008). Races are identified through the use
of plant host differentials.
The occurrence of P. syringae pathovars is on the increase with a
resurgence of old diseases such as bacterial speck on tomatoes caused by P.
infections such as bleeding canker of horse-chestnut caused by P. syringae pv.
aesculi (Green et al., 2010).
It is the many different pathovars of P. syringae that allow the species to
infect a variety of host organisms. Strains within most of the pathovars have
narrow host ranges with the exception being P. syringae pv. syringae which has
more than 80 plant hosts listed (Bradbury, 1986). There has recently been
genomic (Multi Locus Sequence Typing (MLST)) and phenotypic analysis of 216
strains of P. syringae which identified more than 50 different pathovars of P.
syringae (Berge et al., 2014). Each pathovar may only have a narrow host range,
but due to the high diversity of pathovars multiple plant species can be infected
by P. syringae leading to its high pathogenicity status (Hirano and Upper, 2000).
Figure 1.1 Symptoms caused by Pseudomonas syringae. 1) Bacterial speck of tomato leaves (Solanum lycopersicum) caused by P. syringae pv. tomato. 2) Crown galls caused by P. syringae pathovars. 3) Bleeding canker of horse chestnut tree (Aesculus hippocastanum) caused by P. syringae pv. aesculi. 4) Bacterial blight caused by multiple P. syringae pathovars. (Images adapted from commons.wikimedia.org and used under the creative commons licence 3.0; https://creativecommons.org/licenses/by-sa/3.0/ or from flickr.com and used
under the creative commons licence 2.0;
1.4: Pathogenicity factors.
P. syringae produce a range of proteins to facilitate plant colonisation
including enzymes to degrade the plant cell walls, proteins to allow adherence to
the plant and other enzymes such as proteases, lipases and haemolysins
(Preston et al., 2005). Many of these secreted molecules are commonly secreted
by the type one (proteases, nucleases), two (virulence factors and toxins such as
phospholipases) or three (effector molecules) secretion systems and these
molecules promote virulence and enhanced fitness during colonisation. There are
also type four, five and six secretion systems which facilitate translocation and
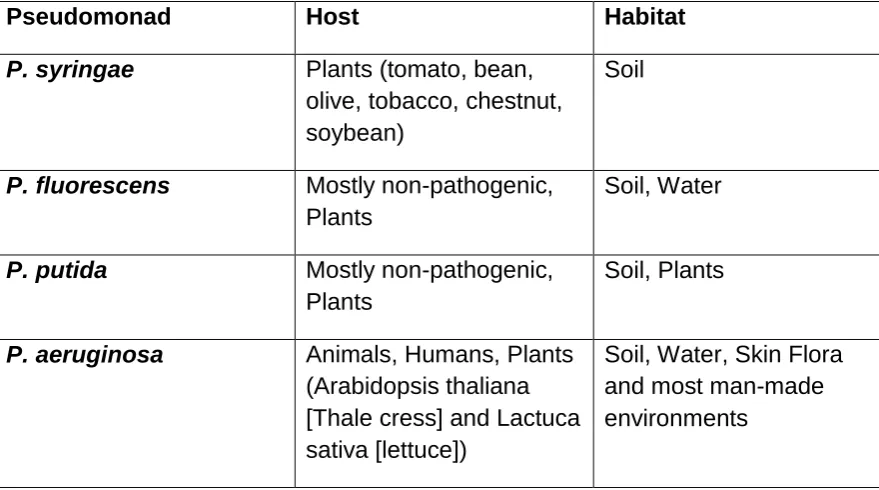
autotransportation of proteins and single-stranded DNA (Figure 1.2) (Jackson,
2009).
Figure 1.2: Diagram showing the various secretion systems used by P.
[image:25.595.120.441.362.693.2]P. syringae produces four primary toxins: coronatine; phaseolotoxin;
syringomycin; and tabtoxin. It is probable that many toxins cause a change in
plant metabolism as all of these toxins promote chlorosis (Bender et al., 1999).
Coronatine is a molecule that mimics methyl-jasmonate, a key host signalling
molecule within the plant, therefore disrupting normal signalling patterns (Bender
et al., 1999). Phaseolotoxin has been shown to promote bacterial growth and
bacterial spread once inside the plant by altering the membrane permeability to
allow sugars and other organic compounds to move more freely (Hutchison et al.,
1995). Phaseolotoxin has also been shown to disrupt the urea cycle causing
arginine deficiencies within the plant (Hwang et al., 2005). Phaseolotoxin is
secreted via the type one secretion system via an oligopeptide permease
(Staskawicz and Panopoulos, 1980). Syringomycin is also secreted by the type
one secretion system. Syringomycin is a pore-forming toxin which causes
electrolytes to leave the host cell and alters the permeability of the membrane
allowing sugars and organic compounds to ‘leak’ out. These compounds favour
bacterial growth (Rico et al., 2009). Tabtoxin inhibits glutamine synthetase which
leads to ammonia accumulation and visible chlorosis (Turner, 1989).
Not all P. syringae strains are pathogenic. When the link between frost
injury in plants and ice nucleating bacteria was discovered P. syringae was the
most frequently found bacteria (Lindow et al., 1978), but the plants did not always
have disease symptoms depending on the pathovar and the host plant.
Non-pathogenic isolates have also been identified in the field. Pseudomonas syringae
pv. syringae (Psy)508 was isolated from a fallen apple tree leaf and was unable
to cause disease on any of the plants tested (Mohr et al., 2008). It is thought that
this isolate belongs to a monophyletic group that evolved from a pathogenic P.
1.5: Plant immunity and pathogen recognition.
Plants react to a bacterial infection using a two pronged immune approach.
The first approach is responsible for detecting common molecules that many
bacterial species express (Jones and Dangl, 2006). This includes both pathogens
and non-pathogens. For pathogens this recognition occurs on the external
surface of the plant cells before the bacteria have entered the cell. These
common microbial molecules, called Pathogen Associated Molecular Patterns
(PAMPs), are recognised on the cells surfaces by Pattern Recognition Receptors
(PRRs) and elicit PAMP-Triggered Immunity (PTI) (Jones and Dangl, 2006). This
causes the deposition of callose to the cell wall to act as a physical barrier
(Nicaise et al., 2009), stomatal closure to prevent entry, restriction of nutrient
transfer from the cytosol to the apoplast to limit bacterial growth and the
production of antimicrobials (Bigeard et al., 2015).
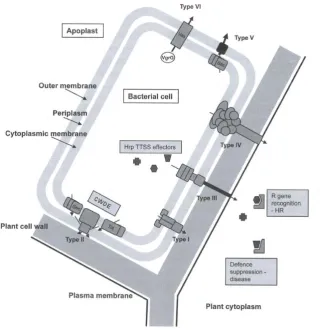
The second immune response the plant has is Effector Triggered Immunity
(ETI). This occurs in response to the pathogen exuding virulence proteins, called
effectors, into the plant cell. ETI is commonly induced by nucleotide-binding
leucine-rich repeat (NB-LRR) receptors recognising effector molecules either
directly or indirectly through their effects on host targets once they are inside the
plant cell (Dodds and Rathjen, 2010), (Figure 1.3). ETI results in the induction of
the hypersensitive response (HR). The HR is characterised by localised cell death
at the infection site. The cell death is triggered by gene-for-gene resistance in
plants caused by invading pathogens carrying effector proteins encoded by
certain avirulence (avr) genes. The Avr proteins are recognised by corresponding
R proteins in the plant (Erbs and Newman, 2009). If the plant lacks the
Many plant-pathogenic bacteria secrete a large number of different
effector proteins into host cells to increase the chances of successful infection
and evasion of ETI (Zhou and Chai, 2008). It is the constant battle between plant
and pathogen that leads to the evolution of new effector molecules and new
receptors to recognise them, the problem is that bacteria can evolve much
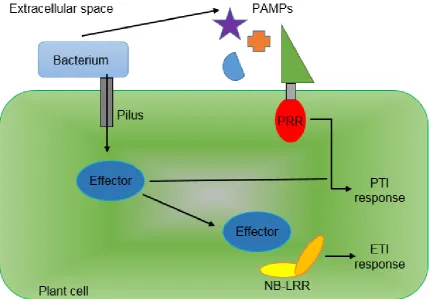
quicker than the plant. In 2006 Jones and Dangl theorised the ‘zig-zag’ model for
plant-pathogen interaction and co-evolution (Figure 1.4). Effector DNA can be
[image:28.595.122.552.64.363.2]shuffled which leads to the NB-LRR receptor no longer being able to recognise
[image:29.595.113.552.149.438.2]the effector preventing ETI.
Figure 1.4 Outline Model of Plant Immune Response. In section 1, plants detect PAMPs (red diamonds) via PRRs to trigger PTI. In section 2, successful pathogens that evaded PTI deliver effectors that interfere with PTI, or otherwise enable pathogen nutrition and dispersal, resulting in effector-triggered susceptibility (ETS). In section 3, one effector (indicated in red) is recognized by an NB-LRR protein, activating ETI, an amplified version of PTI that often passes a threshold for induction of hypersensitive cell death (HR). In section 4, pathogen isolates are selected that have lost the red effector, and perhaps gained new effectors through horizontal gene flow (in blue). These effectors can help pathogens to suppress ETI. Natural selection favours both new pathogen effectors and new plant NB-LRR alleles that can recognize one of the newly acquired effectors, resulting again in ETI. The cycle continues with new effectors and new NB-LRR receptors co-evolving. (Image adapted from Jones and Dangl (2006) and used under Agreement with Nature Publishing Group no.
4052991072647). 1
2 3
1.5.1: Pathogen Associated Molecular Patterns.
Innate immunity consists of molecules designed to prevent pathogen
growth and facilitate removal of the pathogen from the tissue. Plants only have
innate immunity as a line of defence against infection, unlike animals (van
Baarlen et al., 2007). Animals also have innate immunity which is split into two
parts. The first, humoral innate immunity, involves a variety of substances found
in bodily fluids which interfere with the growth of pathogens. The second innate
response is called cellular innate immunity which is carried out by cells called
phagocytes that degrade pathogens. The difference between plants and animals
is that animals (vertebrates) also have adaptive immunity that can recognise
certain substances via antigens on the pathogen and remove the target. This
response also allows the host to remember the pathogen and deliver a quicker
response if the pathogen infects the host again
.
Innate immunity is nonspecific;it is not directed against specific invaders, but against any pathogens. Whereas
animal adaptive immunity can recognize and destroy specific substances
(Nürnberger et al., 2004).
PAMPs trigger the innate immune response and are molecules that are
presented on the surface of the pathogen. The plant recognises these molecules
before the pathogen has invaded the cell. The four most studied bacterial elicitors
that act as PAMPs are flagellin (Flg), elongation factor Tu (EF-Tu),
lipopolysaccharides (LPS) and cold shock protein (CSP) (Jackson, 2009). These
molecules all initiate the plant’s immune system (Erbs and Newman, 2009).
Recognition of PAMPs induces plant defence systems that may include: oxidative
burst - the rapid release of reactive oxygen species which degrade bacteria, nitric
oxide generation – secreted as free radicals in an immune response and is toxic
physical barrier to prevent effector molecules entering the cell,
pathogenesis-related (PR) protein accumulation – some are antimicrobial and attack the
bacteria whereas others send signals to other areas of the plant (Ebrahim et al.,
2011).
The most defined PAMP is flagellin. Flagellin is a globular protein that
arranges itself as a hollow cylinder to form the filament in bacterial flagellum. The
role of flagellin is essential to pathogens for mobility and increased adhesion of
the bacterial cell to the cell wall of the plant. Flagellin is a major activator of PTI
as the majority of plant pathogens have flagella containing flagellin which makes
it the ideal molecule for the immune system to detect (Erbs and Newman, 2009).
The PTI response is not triggered by the entire flagellin molecule but rather a
highly conserved domain at the N-terminal, a 22 amino acid peptide named flg22
(Felix et al., 1999). Flagellin has its own unique PRR that allows the plant to
trigger an immune response. The PRR was discovered by Gómez-Gómez and
Boller (2002) and named flagellin sensing 2 (FLS2) due to it recognising the
conserved N-terminal domain of flagellin.
1.6: Effectors.
P. syringae uses many virulence associated systems to infect its host. The
most studied is the type three secretion system (TTSS) which exudes an array of
effector proteins into the host primarily to suppress plant immune systems (Arnold
et al., 2009). Effector proteins are delivered into the plant’s cytoplasm by the
TTSS (see section 1.7). Effectors disrupt the plants’ cellular and signalling
pathways to prevent defence mechanisms being triggered such as PTI, ETI and
HR (Arnold et al., 2009). Effectors used to be split into two categories, avirulent
terminology was confusing though as the same protein can function as virulent
or avirulent depending on host, therefore the term effector is now used. The
effectors that are specifically recognized by ‘matching’ resistance proteins
(termed R proteins) are termed avirulence (AVR) proteins (Rouxel and Balesdent,
2010). This formed the basis of the ‘gene-for-gene’ concept which shows that a
plant encoding an R gene specific to an effector is resistant to the pathogen that
produces it (Keen, 1990; Crute, 1994).
The first effector protein to be discovered was avirulence gene A (avrA) in
P. syringae pv. glycinea by Staskawicz et al. (1984). In 2000 a review by Vivian
and Arnold (2000) estimated that 30 effector genes had been identified in different
P. syringae pathovars using ‘gain-of-function’ assays (Cunnac et al., 2009).
Effector genes can also be identified via PCR as the DNA sequences flanking
effector genes in Ppi show high degrees of similarity and primers could be
designed from these conserved regions (Arnold et al., 2001).
Effector proteins have many functions, one function is to suppress host
defences allowing the pathogen to infect and spread inside the plant. The first
type three secreted effector (TTSE) shown to suppress basal defence was AvrPto
from Pto DC3000 (Nomura et al., 2005). AvrPto prevents the deposition of callose
to the cell wall in response to the TTSE. The prevention of callose deposition
means that the bacteria can invade the plant more easily. This is because
callose-containing cell-wall appositions act as effective physical barriers to prevent
bacterial invasion. These appositions are induced at the sites of attack during the
relatively early stages of pathogen invasion (Luna et al., 2010). Effector proteins
can also suppress advanced plant defences including gene-for-gene and HR
resistance. Effectors can also be enzymes, AvrRpt2 is a cysteine protease that
down so cannot activate the HR (Luna et al., 2010). These enzymes contain
active sites of mono-ADP ribosyltranferases that cause RNA-binding proteins to
change, therefore altering RNA metabolism and reducing the amount of immunity
related mRNA’s available favouring pathogen establishment (Fu et al., 2007).
Effectors can also block the recognition of other effectors by suppressing host
genes responsible for receptor expression.
Finally effector proteins can alter host pathways. For example, de
Torres-Zabala et al., (2007) demonstrated that Pto effectors can ‘hijack’ the abscisic acid
(ABA) pathway in Arabidopsis thaliana leading to disease.
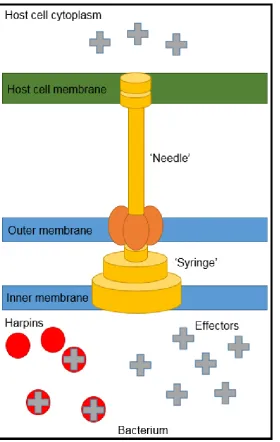
1.7: The type three secretion system (TTSS).
The phytopathogenic bacteria never enter the plant cells’ so a delivery
mechanism is required to get the effector molecules into the cell. An essential
part of bacterial pathogens is their ability to secrete proteins that facilitate
infection and bacterial proliferation and survival. There are a total of six secretion
systems that have either been identified or predicted to be utilised by P. syringae
with the most emphasis being on the TTSS and the effector proteins it delivers
(Arnold et al., 2009). The TTSS allows infection to occur by directly ‘injecting’
effector proteins into the cytoplasm that can suppress plant immune responses
and block signalling pathways (Preston et al., 2005).
Once the bacteria have entered the extracellular space of their host
environmental changes lead to the activation of a specific gene cluster hrp-hrc,
responsible for encoding the TTSS (Jin et al., 2003; Kvitko et al., 2007). There is
strict regulation of TTSS expression and it is only induced in plant tissue,
apoplastic fluid and hrp inducing media. This results in the transcription and
structure with the distinctive syringe and needle-like TTSS (Figure 1.6) which has
the ability to ‘pierce’ the host’s cell wall exporting effector proteins (Gerlach and
Hensal, 2007). Molecular chaperones, called harpins, are required to aid the
transport of effector molecules from the pathogen into the host cell via the TTSS.
Harpins are a subset of TTSS substrates found in all phytopathogenic bacteria
that utilize a TTSS (Kvitko et al., 2007).
In P. syringae, hypersensitive response and pathogenicity (hrp) and
hypersensitive response conserved (hrc) genes encode the TTSS pathway
(Alfano and Collmer, 1997), and avirulence (avr) and Hrp-dependent outer
protein (hop) genes encode effector proteins (Schechter et al., 2004). The hrp/
hrc genes are required for the development of the HR in non-host and resistant
hosts and the onset of pathogenesis in susceptible plants. The hrp/ hrc gene
cluster for the TTSS is on a pathogenicity island and is bounded by two effector
loci, an exchangeable effector locus and a conversed effector locus (Alfano et al.,
2000). Typically in P. syringae strains the hrp/ hrc genes are clustered in a 25kb
region organised into seven operons which can encode either regulatory,
secretory or effector proteins. (Figure 1.5).
Within the hrp/ hrc locus there are at least three classes of hrp genes. One
class encodes both positive, HrpL, and negative, HrpV, regulatory proteins in P.
syringae, these are responsible for the regulation of the TTSS associated genes
(Ortiz-Martin et al., 2010). Another hrp class encodes core structural components
of the TTSS including genes that have a high similarity to flagellum assembly
genes and proteins that are involved in the breakdown of peptidoglycan in the
cell wall allowing the TTSS apparatus to form into the plant cell (Alfano and
Collmer, 1997). The final class encodes secreted proteins.
This suggests that the PAI containing the TTSS in P. syringae was
inherited via horizontal gene transfer (HGT) as it is also present in distantly
related bacteria. It has also been suggested that acquisition of the PAI led in part
1.8: Effector evolution.
Mutations in effector genes can result in evasion of host recognition. The
mutation can be in a gene itself or the loss/gain of larger pieces of DNA. The
antimicrobial environment created during the HR presents a strong selection
pressure for mutants that can avoid triggering the HR. The effector could be lost
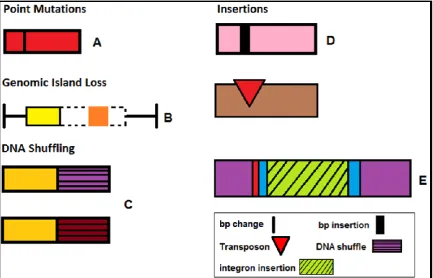
[image:36.595.119.400.57.500.2]by mutational insertions, deletions or rearrangements, even a single base pair
change can lead to a non-functional effector (Arnold et al., 2009) (Figure 1.7). A
classic example of this is the case of avrPphE. All 9 races of P. syringae pv.
phaseolicola (Pph) have avrPphE but only races 2,4,5 and 7 have an active
version. The remaining races have an inactivated version of avrPphE due to a
single base pair change which confers an amino acid change (Stevens et al.,
1998). The function of avrPphE is not yet fully understood but it is a modular
protein that acts as a virulence determinant (Nimchuk et al., 2007).
Effector genes can also be disrupted by the insertion of mobile genetic
elements (MGEs). The disruption can be caused by insertion sequences,
transposons and integrons. As more genome sequences are being analysed
more disrupted genes are being identified. The effector genes are disrupted in
some strains but not others leading to a variation of functional effectors across
different strains of the same species. This variation has been shown in the
complete genome of Pto DC3000 which revealed a total of 31 effectors secreted
by the TTSS (Buell et al., 2003). When compared to the Psy B728A genome four
effectors appeared to be disrupted by MGE insertion. This variation prompted
Greenburg and Vinatzer (2003) to propose that different effector profiles are the
reason why highly related phytopathogenic strains have different host range and
disease characteristics depending on their effector repertoire.
Certain phytopathogenic strains, such as Pto DC3000, contain a lot more
transposons than other strains. The high level of transposons could be driving a
high level of DNA shuffling in these strains resulting in novel effectors that the
plant cannot recognise. The DNA can also be shuffled so there is a TTSS signal
included, allowing the protein to be transported into the plant whereas before it
Figure 1.7 The different ways in which effector genes’ functions can be changed, lost or suppressed. A) A simple base pair (bp) mutation can cause an effector to lose its avirulence (avrPphE). B) The loss of a genomic island (hashed lines) which contained an effector (orange box) the plant could detect, strain is now pathogenic on host. C) The shuffling of DNA regions, in this case the different ends of an effector gene leading to acquisition of TTSS signals. D)
The insertion of base pairs (1) or transposons (2) leads to the gene no longer forming a correct and functional effector protein, meaning there is no effector for the plant to recognise. E) Integron insertion can also disrupt genes leading to dysfunctional proteins, but integrons can also pick-up and harbour different effector genes from totally different bacterial species, meaning the plant will not recognise the effector.
Effector genes can also be lost. The entire coding region could be lost
during cell replication if the effector gene is carried on a MGE (Arnold et al., 2007).
This was shown when the genomic island (GI), PPHGI-1, was lost from Pph race
4 strain 1302A. The loss of the GI resulted in the loss of the effector gene,
avrPphB (Pitman et al., 2005). The loss of the GI and subsequent effector causes
the bacterial strain to become virulent on beans carrying the R3 resistance gene
1.9: Integrons.
Integrons are sections of mobile DNA characterized by their ability to
capture and incorporate gene cassettes by site-specific recombination. Integrons
were first discovered in the late 1980’s (Stoke and Hall, 1989) and were primarily
thought to be unique to human clinical settings. However, integrons have now
been isolated from bacteria in non-clinical environments including soil and water
(Domingues et al., 2012). Integrons have been identified as major determinants
in a bacteria’s ability to become resistant to multiple antibiotics by ‘sharing’
resistance genes between bacterial populations and species (Gillings et al.,
2014). This ‘sharing’ of genes is not limited to antibiotic resistance and includes
genes that encode effector proteins responsible for plant disease (Arnold et al.,
2001). This sudden uptake of new genes could result in a quantum evolutionary
jump for the bacteria. This evolution could result in the bacteria being able to
potentially survive and infect new host organisms, and if successful the new strain
will thrive.
Integrons have been identified in approximately 17% of bacterial genome
sequences stored on the NCBI database (Gillings, 2014). Integrons are
commonly linked to MGEs to allow mobility between chromosomes and plasmids
(Domingues et al., 2012). Integrons can move independent of MGEs but only as
a result of captured genes providing and facilitating self-mobility mechanisms.
The heritability of an integron via horizontal gene transfer (HGT), and therefore
its spread throughout the bacterial population is reliant on two aspects, the first
being the genetic stability of the integron and the second is the fitness cost to the
Integrons fundamentally contain three main elements that work together
to capture and express exogenous genes cassettes (Jackson et al., 2011). The
main elements are a tyrosine recombinase (intI) gene with its own promoter (Pint),
an adjacent recombination site (attI) and a promoter (Pc) (Gillings, 2014) (Figure
1.8). The integrase protein encoded by intI belongs to the tyrosine recombinase
family and is responsible for catalysing site-specific integration and excision of
specific gene cassettes into the attI site. The attI site is a recombination site
recognised by the integrase and the site where the gene cassette is inserted. The
final element of an integron is the outward facing promoter (Pc) which is required
for expressing captured gene cassettes (Gillings, 2014; Jackson et al., 2011; Hall
and Collis, 1995).
Figure 1.8 Capture of a gene cassette by an integron. A) The core integron assembly comprising of the integrase gene (intI), the integrase promoter (Pint),
the gene cassette promoter (Pc) and the integration site (attI). B) The
Integron activity is regulated by the transcriptional repressor LexA and the
SOS response upstream of the tyrosine recombinase gene (Guerin et al., 2009).
The integrase promoter (Pint) contains LexA binding sites that cause the
expression of integrase to be down-regulated when LexA is bound. The SOS
response causes the release and degradation of LexA from the promoter and
therefore activates integrase expression allowing gene cassettes to be captured
(Jackson et al., 2011). Plasmid conjugation activates the SOS response meaning
integrase is at its highest levels when new gene cassettes are potentially more
common. Environmental stress and DNA damage causes the formation of ssDNA
molecules which bind non-specifically to the universal recombination protein
RecA which in turn promotes LexA inactivation by autoproteolytic cleavage, the
inactivation of LexA induces the SOS response and activates the integron
integrase (Figure 1.9) (Cambray et al., 2011). It is cell stress and damage that
activates the SOS response and allows capture and expression of new genes
that may benefit the bacterium in stressful environments.
1.9.1: Integron-like elements present in the plant pathogen Pseudomonas
syringae.
Previous work had shown integrons to be abundant in bacterial species
that had antibiotic resistance such as Vibrio species (Clark et al., 2000). Integrons
however are not exclusive to clinical isolates showing antibiotic resistance and
integron-like elements have been identified in environmental isolates (Gillings et
al., 2008). Integron-like elements (ILEs) may be like integrons and be able to
capture, express and help spread genes within bacterial populations. However
the term integron-like element is used because the integrase genes are forward
facing with respect to the ILE (unlike true integrons) and because in true integrons
the integrase gene has its own forward facing promoter and a reverse facing
promoter for expression of cassette genes in the variable end (Gillings et al.,
2008). ILEs in P. syringae and P. fluorescens have neither of these and may be
under the control of LexA found upstream of rulA (Rhodes et al., 2014). ILEs may
also be more independently mobile that other integrons, such as class one
integrons which require genetic linkage to other MGEs (Domingues et al., 2012).
Prof. Dawn Arnold and her research group identified an integron-like
element within the chromosome of the pea pathogen, Ppi race 2 strain 203
(Arnold et al., 1999; 2000). An 8.5kb region of DNA was identified that was
present in strain Ppi 203 but not in any other Ppi strains tested. The DNA was
flanked by direct repeat sequences. The 8.5kb fragment contained a rulAB
operon (responsible for UV tolerance and DNA repair) and the rulB gene was
disrupted by a 4.3kb insertion of DNA which contained the avirulence gene,
avrPpiA1, and genes with high similarity to transposase genes which may confer
mobility (Figure 1.10) (Arnold et al., 2000). The rulAB encodes the error-prone
and genotoxic compounds, resulting in bacterial survival but at the cost of genetic
mutations in the DNA (Stockwell et al., 2013).
Figure 1.10: Identified ILE within Pseudomonas syringae pv. pisi 203. The 4.3kb ILE is present with a larger 8.3kb insertion, the ILE is inserted with the rulB gene (B1,2). The rulA gene is also present (G) and the ILE contains three
integrase genes (D,E,F) along with the type three effector gene, avrPpiA1 (C). Image adapte