STOCK MARKET VOLATILITY IN SOME SELECTED COUNTRIES –
A THERMODYNAMIC APPROACH
Amit KUNDU∗
Abstract. Volatility is an important concept in the theory of finance.
Substantial changes in volatility of financial market returns are capable of having significant negative effects on risk averse investors. Volatility can also have effect on consumption patterns, macroeconomic variables, etc.
Traditionally the volatility has been addressed based on the concept of standard deviation approach and on the basis of the standard deviation approach ARCH, GARCH, EGARCH have been developed. Volatility is often used to describe dispersion from an expected value. As a measure of uncertainty and risk standard-deviation is very popular since it is simple and easy to calculate. But it is not fully satisfactory. It is severely affected by extreme values.
In this paper the concept of entropy basically developed in Physics by Clausius in 1855 will be used as an effective alternative. There is several measures of entropy. In this article we focused on the potentialities of Shannon entropy and Tsallis entropy. In this article the volatility of ten indexes has been examined. From the investigation it has found that KOSPI Composite Index (South Korea) attained the highest level of volatility and the immediate next one is TSEC weighted index (Taiwan).
Keywords: Entropy, Shannon entropy, Tsallis entropy, Volatility.
Introduction
The concept of volatility in financial markets refers to the degree of unpredictable fluctuations of a process over time. Volatility can be used as a criterion to study the risk associated with a financial asset. Different statistical approaches used to measure volatility are summarized in the paper written by Henning, B.; Sloane, M.; de Leon, M. In that paper, the authors state that “price volatility is not a precisely or easily defined term.
One consequence is that there are a variety of ways of measuring price volatility, depending on the elements of volatility that are considered critical”.
∗ Assistant Professor, Department of Economics, Mathabhanga College, Cooch Behar,
In literature, several historical volatility studies have been carried out on various markets. For instance, in the article written by Benini, M.;
Marracci, M.; Pelacchi, P.; Venturini, A. showed that volatility analysis was included for the Spanish, Californian, UK and PJM electricity markets. Li, Y.; Flynn, P.C. examined and compared the volatility of 14 deregulated markets through the “price velocity” measure (the daily average of the absolute value of price change per hour). Simonsen, I. studied some volatility features (volatility clustering, log-normal distribution and long-range correlations) of the Nordic day ahead power spot market, and it also pointed out that power markets have greater volatility levels than other financial markets (stock indices, crude oil, natural gas...).
These studies were carried out using different measures of volatility.
Most of them involve computing the standard deviation of: (1) the price series, (2) the arithmetic return over a time period h, or (3) the logarithmic return over a time period h. The value h = 1 is the commonly used time period.
The main contribution of this paper is to compare two different approaches: one based on the statistical measure of the standard deviation or variance and the other one centered on the concept of entropy. In this regard, we particularly focus on the concept of Tsallis entropy which constitutes a possible generalization of the Boltzmann-Gibbs or Shannon entropy. These measures were both generated in the domain of physics, although the latter is also attributed to the Information Theory, and their application to financial phenomena falls in the domain of the so-called econophysics. As Mantegna R N and Stanley H E pointed out an active domain of research in physics is the characterization of the process of prices changes, i.e., volatility. In our particular investigation we apply the concept of entropy to capture the presence of nonlinear dynamics in stock market indexes since the standard deviation evidence some limitations. The empirical analysis is conducted with data from different countries for comparative purposes.
The article is organized as follows: Section 2 describes the most commonly used measure of volatility – the standard deviation. Section 3 presents two different measures of entropy: the Shannon entropy and a possible generalization of it – the Tsallis entropy. Section 4 exhibits the empirical findings and Section 5 draws the conclusions.
About Thermodynamics
Thermodynamics is a branch of natural science that studies the effects of changes in temperature, pressure, and volume on physical systems at a macroscopic level and, most importantly, the relation of heat with energy and work. Lord Kelvin, one of the fathers of thermodynamics, defined it in 1854. The keystones of thermodynamics are its four universal laws:
Zero Law of Thermodynamics: If two systems (A and B) are each in thermal equilibrium with a third one (C), they are also in thermal equilibrium with each other. Mathematically, the law relates systems A, B and C as follows
if T(A) = T(B), and if T(B) = T(C), then T(A) = T(C)
where T is the temperature of the systems.
First Law of Thermodynamics: The increase in internal energy (∆U) of a closed system is equal to the difference of the heat (Q) supplied to the system and the work (W) done by it:
. W Q U = − Δ
Heat may be absorbed by the system from a source at a higher temperature or transferred to a system at a lower temperature; conversely, work may be performed by the system or its surroundings. The differential expression
W Q dU =δ −δ
where d and δ denote infinitesimal change in the variables
Second Law of Thermodynamics: Heat cannot spontaneously flow from a colder location to a hotter location. Alternatively, it is not possible to change heat completely into work.
Third Law of Thermodynamics: As a system approaches absolute zero (0K, or -273.150C), the entropy of the system approaches a minimum value.
Second law of Thermodynamics states that nature tends to move towards most probable state. It is nothing but a statistical law.
Maximum internal states possible without any apparent change in external state.
Entropy = S = K logW [Entropy is a macroscopic variable]
Where, K => Boltzmann’s constant
W=> number of ways internal states possible without any apparent change in external state.
Entropy will be maximum when W will be maximum. W will be maximum at most probable state.
Entropy always increases. It means that nature moves towards most probable state.
Various measures of Volatility
At first we will keep some light on the standard deviation and then analyze the Tsallis entropy and a special case of it - the Shannon entropy. It is well known to us that volatility is popular as a synonymous of risk and uncertainty. Volatility could be not constant over time.
A traditional way of measuring volatility is to compute the returns rt of an asset:
log − −1
= t t
t P P
r
where P denotes the prices at time t and t Pt−1 denotes the prices at time .
−1 t
Formula for standard deviation is as follows:
1 )
ˆ 1(
−
= −
σ
∑
=T r
T r
t t
where r (sample average return) = . T
rt
∑
This gauge is simple to estimate but it has some drawbacks. It could lead to an unexpected change in volatility once shocks fall out of the measurement sample. It only captures linear relationships; it ignores all kind of nonlinear dynamics among data. So to understand the concept of volatility more sophisticated measures are needed. The concept of entropy is a new measure to capture nonlinear dynamics among data. The main focus of this paper is to capture the volatility in some stock markets by using entropy.
Though there are number of imperfections or disadvantages in the standard deviation still it is a accepted measure of volatility for forecasting of more complex model.
The Concept of Entropy:
An alternative way to study stock market volatility is by applying concept of entropy of physics. In a subsequent investigation Shannon provided a new insight into this matter showing that entropy wasn't only
restricted to thermodynamics but could instead be applied in any context where probabilities can be defined.
For a given a probability distribution pi equivalentto p(X =i), )
,.., 1
(i= n of a given random variable X, ( ) log .
1
i n
i
i p
p X
S
∑
=
−
=
Shannon entropy has been most successful in the treatment of equilibrium systems in which short or temporal interactions with ergodicity and independence dominate. However, there are many irregular systems in nature that do not verify the simplifying assumption of ergodicity and independence. To overcome this kind of weakness Tsallis drawn a new measure of entropy and that is Tsallis entropy.
Following is the Tsallis entropy:
).
1 1( )
(
∑
1−
− −
= w
i q i
q p
q X k S
Given a discrete set of probabilities p with the condition i ∑i pi =1 and q any non-negative real number considering the probability distribution pi equivalentto p(X =i), (i=1,..,n) of a given random variable X, Tsallis entropy Sq(X) is shown above. Here q is a real parameter sometimes called entropic-index. In the limit as q → 1, the usual Boltzmann-Gibbs entropy is recovered. The number of q∈ is an entropic R index that characterizes the degree of non-extensivity of the system. It is used to describe system with non-extensive properties, and it is also used to characterize the non-extensivity degree of particular system.
Given two independent systems A and B, for which the joint probability density satisfies
, ) ( ) ( ) ,
(A B p A p B A
p =
the Tsallis entropy of this system satisfies
).
( ) ( ) 1 ( ) ( ) ( ) ,
(A B S A S B q S A S B
Sq = q + q + − q q
From this result, it is evident that the parameter |1− is a measure q| of the departure from additivity. In the limit when q = 1
) ( ) ( ) ,
(A B S A S B
Sq = q + q
which is what is expected for an additive system. This property is sometimes referred to as "pseudo-additivity".
Objective:
The objective of my paper is to detect the variation of volatility among different countries using entropy. It is relevant in the context of globalization.
Data:
Daily returns of Dhaka Stock Exchange (Bangladesh), JPX-Nikkei 400 (Japan), Shenzhen Stock Exchange (China), Jakarta Composite Index (Indonesia), FTSE Malaysia KLCI (Malaysia), KOSPI Composite Index (South Korea), S&P BSE SENSEX (India), TSEC weighted index (Taiwan), Karachi 100(Pakistan) and S&P/ASX 200 (AXJO (Australia) over the period of study (5th August, 2014 to 29th December, 2016) are considered for the empirical research. These data were collected on daily basis. Official website is http://www.site-by-site.com/ asia/indo/
stocksin.htm. Closing price were the inputs.
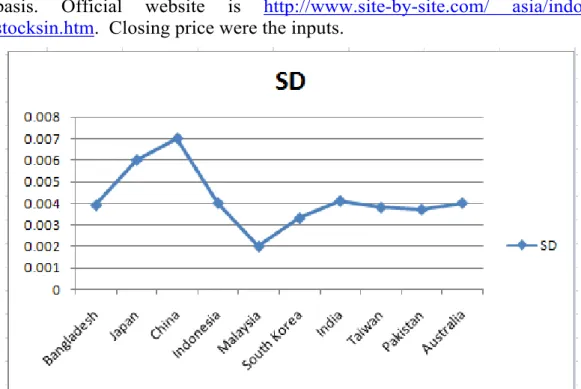
Figure 1. Standard deviation of stock index returns.
It was observed from the ten stock markets that Shenzhen Stock Exchange (China) has the higher volatility indexes and the immediate next one is JPX-Nikkei 400 (Japan). The ranking also gives us an idea about that all values are close to zero which may suggest that all of them show signs of low volatility in spite of their particular values. It is well known to us that standard deviations of stock markets are influenced by abnormally high observations and are not able to capture nonlinear dynamics.
Results of Entropy
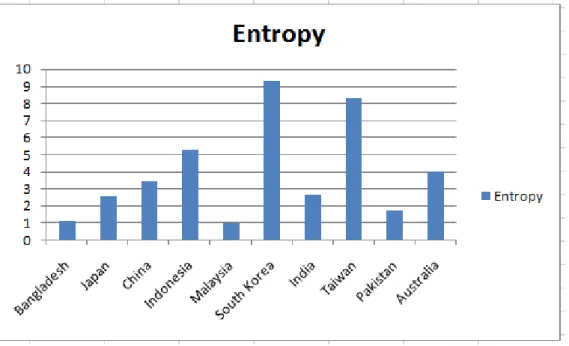
The computed results of Shannon entropies and Tsallis entropies are represented in figure-2 and figure-2 respectively.
Figure 2. Shannon Entropy Results of stock index returns.
Figure 2. Tsallis Entropy Results of stock index returns.
All entropies were estimated with histograms based on equidistant cells. For the calculation of Tsallis entropy we have set values at 1.5, 1.55 and 1.6 for the index q, which is consistent with the finding that when considering financial data their values lie within the range 1.5-1.6. It is worthy to note that KOSPI Composite Index (South Korea) attained the highest levels of volatility and the immediate next one is TSEC weighted index (Taiwan). In the overall, it appears that the use of entropy as a measure of uncertainty allows better insights over the identification of volatile markets, by distinguishing them more sharply, than simply using the standard deviation. This leads us to the conclusion that entropy is more general and better suited for describing stock market volatility. Entropy can be computed from metric and non-metric data. Apart from that the major advantages of entropy when compared to the standard deviation can be summed up d as follows:
(i) it integrates much more information than the standard deviation;
(ii) it has no distribution. It means that it is not dependent upon any particular distribution; it avoids the introduction of errors through the fitting of the distribution of returns to a normal-like distribution.
(iii) Since entropy is independent of the mean for all types of distributions, it satisfies the first order conditions and
(iv) due to its common comprehending of mean uncertainty, it also serves as a measure of dispersion.
On the other hand, some shortcomings have also to be weighted when considering the use of any kind of entropy. First one has to do with its inbuilt complexity when compared to the simple standard deviation.
Second, is related to the amount of statistical bias in these measures due to the degrees of freedom allowed in an experiment.
Conclusion
In this article the volatility of ten indexes has been examined. Ten indices are Dhaka Stock Exchange (Bangladesh), JPX-Nikkei 400 (Japan), Shenzhen Stock Exchange (China), Jakarta Composite Index (Indonesia), FTSE Malaysia KLCI (Malaysia), KOSPI Composite Index (South Korea), S&P BSE SENSEX (India), TSEC weighted index (Taiwan), Karachi 100(Pakistan) and S&P/ASX 200 (AXJO (Australia). The main goal was to compare two different viewpoints.
(i) based on the standard deviation and
(ii) based on the concept of entropy (the Tsallis and the Shannon entropies).
In particular, the results from both entropies have shown nonlinear dynamics in the volatility of all indexes. However, most of the outcomes are not in accordance with the statistics produced by the standard deviation, which emphasizes that this method is not able to capture the overall behaviour of dispersion. This is especially relevant for the decision making process in which all the information is regarded as necessary and useful. It has found that KOSPI Composite Index (South Korea) attained the highest level of volatility and the immediate next one is TSEC weighted index (Taiwan).
Since entropy can capture the uncertainty and disorder in a time series without imposing any constraints on the theoretical probability distribution in this paper has addressed the concept of entropy.
REFERENCES
[1] Henning, B.; Sloane, M.; de Leon, M., Natural gas and energy price volatility.
American Gas Foundation 2003. Available online: http://www. gasfoundation.
org/ResearchStudies/VolStudyCh5. pdf (accessed on 19 January 2012).
[2] Benini, M.; Marracci, M.; Pelacchi, P.; Venturini, A., Day-ahead market price volatility analysis in deregulated electricity markets, In Proceedings of the IEEE Power Engineering Society Summer Meeting, Chicago, IL, USA, 25 July, 2002;
Volume 3, pp. 1354-1359.
[3] Li, Y.; Flynn, P. C., Deregulated power prices: Comparison of volatility, Energy Policy 2004, 32, 1591-1601.
[4] Mantegna R. N., and Stanley H. E., 2004, An Introduction to Econophysics:
correlations and Complexity in Finance (Cambridge University Press, Cambridge).
[5] Shannon C. E., 1948, The Bell System Technical Journal, 27, 379.
[6] Simonsen, I., Volatility of power markets, Phys. Stat. Mech. Appl. 2005, 335, 10-20.
[7] Tsallis C., 1988, Journal of Statistical Physics, 52, 479.