Effect of Precipitation on Development of Recrystallization
Texture in a 6061 Aluminum Alloy
K. Kashihara
1and H. Inagaki
2;*1
Wakayama National College of Technology, Gobo 644-0023, Japan 2INATEX, Fujisawa 251-0031, Japan
Three types of specimens, namely solution treated, peak aged and overaged specimens, were prepared from hot-rolled sheets of a commercial 6061 aluminum alloy, so that they contain precipitates different in size and distribution. These specimens were cold rolled to 95% reduction in thickness and then annealed at 300C. The rolling texture and work hardening rate during cold rolling differed, depending on the
state of the precipitate. In particular, no increase in hardness during rolling was observed in the peak aged specimen. The recrystallizations in the overaged and solution treated specimens were completed more rapidly than that in the peak aged specimen. This is interpreted to be due to pinning effect caused by precipitation and difference in driving force of recrystallization. In the overaged specimen, the recrystallization texture revealed a strong {100}h001iorientation, which has the favored orientation relationship with deformed matrix. In the peak aged specimen, the recrystallization texture revealed a {110}h111iorientation. The {100}h001iorientation was also formed, however, the intensity relative to random orientation was much weaker than that observed in the peak aged specimen. [doi:10.2320/matertrans.L-MRA2008847]
(Received September 4, 2008; Accepted November 25, 2008; Published February 12, 2009)
Keywords: aluminum alloy, ageing, texture, rolling, recrystallization, X-ray diffraction
1. Introduction
It is well known that second phase particles already present in the structure before cold rolling influence the development of the recrystallization texture. Coarse particles larger than 1mm generally accelerate recrystallization by enhancing particle-stimulated nucleation (PSN).1–3)On the other hand, recrystallization is retarded or completely inhibited by small (<1mm) and closely spaced particles.4)In aluminum alloys
with a bi-modal particle distribution in which very large particles and small particles coexist, fine particles such as fine precipitates play a role in suppressing PSN at defor-mation zones around large constituent particles.5,6)
Recently, the effect of precipitation on the development of recrystallization texture has been studied in the 6000 series Al-Mg-Si alloys used for automotive sheets.6–12) Coarse
constituent particles already present before cold rolling enhance PSN, which leads to a very weak recrystallization texture. Precise ODF analysis of the recrystallization texture, however, has established the occurrence of {110}h122iand {100}h013i.13)
Many studies have investigated the effect of the distribu-tion and size of precipitates on recrystallizadistribu-tion.5–13)
How-ever, there are few reports which mentioned the effect of precipitation on work hardening.
In this paper, three types of specimens with different size and distributions of particles before cold rolling were prepared from hot-rolled sheets of a commercial 6061 aluminum alloy. These specimens were cold rolled to 95% reduction in thickness and annealed at 300C. The relation-ship between work hardening and precipitation hardening in rolling was clarified. In addition, we investigated the effects of precipitation and work hardening on recrystallization. The formation mechanism of recrystallization texture was also discussed, based on the state of precipitation before cold
rolling and the orientation relationship between rolling and recrystallization textures.
2. Experimental Procedure
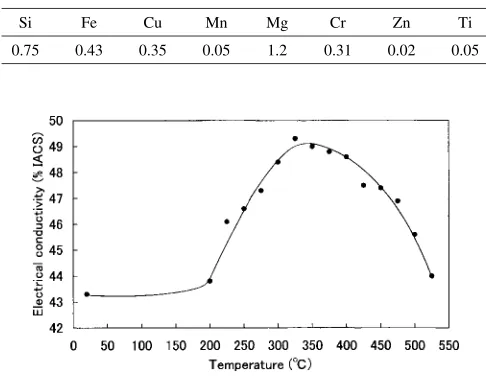
The starting material was a hot-rolled sheet of commercial 6061 aluminum alloy with a thickness of 5 mm. The chemical composition was given in Table 1. To determine optimum experimental conditions in which the three types of speci-mens have different size and distributions of particles, coupons taken from the hot-rolled sheet were solution treated at 530C for 40 minutes (min) and then quenched in ice water. They were subjected to isochronal ageing at temper-atures ranging from 200 to 525C in increments of 25C and a holding time of 0.5 h. Figure 1 shows the relationship between the electrical conductivity and the ageing
temper-Table 1 Chemical composition of a 6061 aluminum alloy. (mass%)
Si Fe Cu Mn Mg Cr Zn Ti
0.75 0.43 0.35 0.05 1.2 0.31 0.02 0.05
Fig. 1 Relationship between electrical conductivity and isochronal ageing temperature (holding time: 0.5 hours) in coupons after solution treatment.
*Passed away in 2008.
[image:1.595.304.547.571.759.2]ature in coupons after solution treatment. Electrical con-ductivity (%IACS) was measured at room temperature using a metal conductivity meter produced by Denshi Keisoku Kogyo Co. Ltd., Tokyo. Precipitation was found to occur most significantly at 325C.
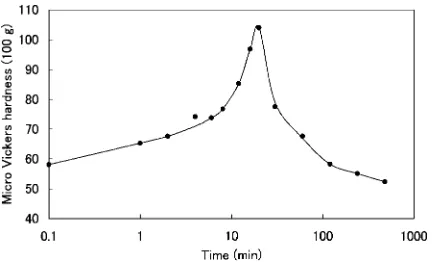
Figure 2 shows Micro-Vickers hardness (load: 100 g) measured on coupons isothermally aged at 325C after solution treatment. Peak ageing was obtained by annealing for 20 min. Electrical conductivity in %IACS of these coupons is shown in Fig. 3. Precipitation started to occur after 10 min of ageing, and it was completed after 1 h. Thus, the overaged specimen could be prepared by ageing for longer than 8 h.
The results of preliminary experiments indicate that three types of specimens were prepared from the received hot-rolled sheets: (1) a solution treated specimen heated at 530C for 40 min and quenched in ice water, (2) a peak aged specimen heated for 20 min at 325C after solution treatment, and (3) overaged specimens, aged for 24 h at 325C after solution treatment. The particles in these specimens were observed with a JEOL 6380 SEM and JEOL 2000FX STEM equipped with EDX.
All specimens were cold rolled to 95% reduction in thickness and isothermally annealed at 300C. The progress of recovery and recrystallization was evaluated by the Micro-Vickers hardness test (load: 100 g) and the electron back scatter diffraction (EBSD) method. In the EBSD analysis, the image quality (IQ) map was obtained by using software of the OIM analysis manufactured by TSL Co. Ltd. The IQ map
represents the image quality of Kikuchi pattern at each data point of EBSD (0.5mmscan step), so that indirectly this map is able to reveal dislocation structure. The degree of precipitation that accompanied recovery and recrystallization was examined by measuring the electrical conductivity in %IACS.
Textures after cold rolling and annealing were investigated by measuring {110}, {100} and {111} incomplete pole figures. Pole figure measurements were performed at the mid-thickness layer of specimens, which was prepared by mechanical grinding and chemical polishing. From these pole figures, orientation distribution functions (ODFs) were calculated with the method of Roe14)and the main orienta-tions and their orientation densities were quantitatively evaluated.
3. Experimental Results
3.1 Microstructures before cold rolling
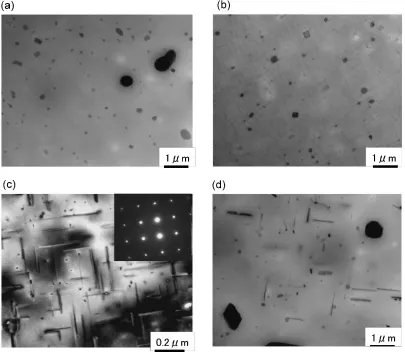
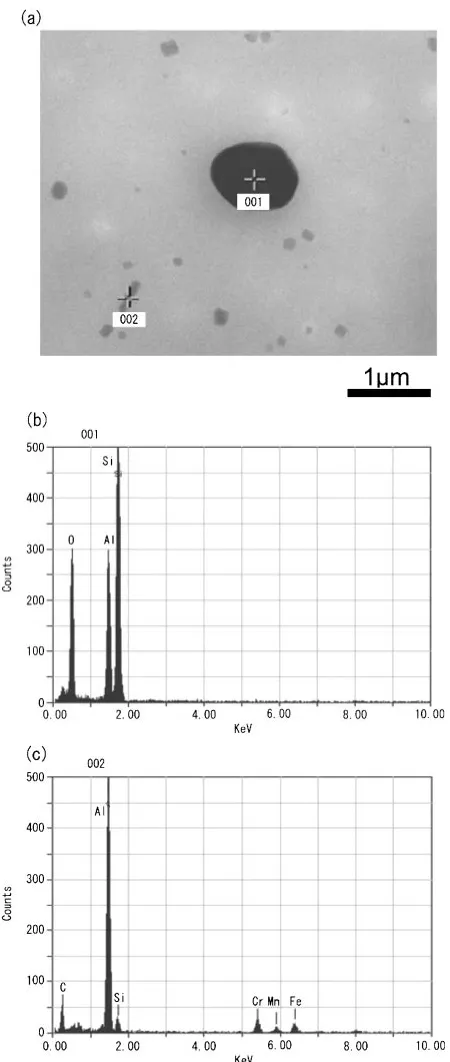
Figures 4 and 5 show SEM and TEM micrographs of the solution treated, peak aged, and overaged specimens. Figure 4 confirms that all of the specimens had large constituent particles ranging from 3 to 10mm in size and fine particles below 1mm. In Fig. 5, the solution treated specimen contained medium (1mm) and small (0.2mm) constituent particles. Based on the EDX analysis using STEM shown in Fig. 6, the medium constituent particle contained Si and the small particle consisted of Cr, Mn, Fe and Si. We could distinguish the existence of O and C, but the reason for detecting O and C was unknown. In the peak aged specimen shown in Fig. 5(b) and (c), fine, rod-shaped precipitates emerged. These were coherent with the matrix, and their rod axes paralleled to the h100i direction of the matrix. Their lengths were about 0.3mm. The overaged specimen (Fig. 5(d)) had precipitates that had grown to 0.1mm in diameter and 1mm in length. These precipitates may be Mg2Si or Al(Mg,Cu)Si.
Thus, we were able to prepare a solution treated specimen containing large (3–10mm), medium (1mm) and small (0.2mm) particles, a peak aged specimen with fine precip-itates (0.3mm) and constituent particles, and an overaged specimen containing grown precipitates (1mm) and constit-uent particles.
3.2 Recovery and recrystallization
The micro-Vickers hardness measured on the three cold rolled and isothermally annealed specimens is plotted in Fig. 7 as a function of annealing time. After cold rolling to 95% reduction in thickness, the solution treated specimen showed the highest hardness, while the overaged specimen showed the lowest hardness. In all specimens, the hardness appeared to decrease at two stages. The first stage was indicated by Vs1, Vp1 and Vo1, and the second stage was by Vs2, Vp2 and Vo2, for the solution treated, peak aged and overaged specimens, respectively.
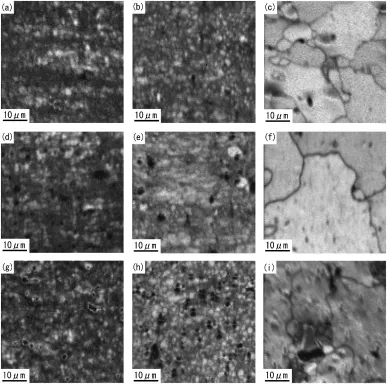
IQ images in the three specimens were shown in Fig. 8. Figure 8(a), (d) and (g) give as-deformed structures in the solution treated, peak aged and overaged specimens after cold rolling, respectively. In all specimens, the tangled dislocations with high density were observed. Figure 8(b),
Fig. 2 Relationship between Micro-Vickers hardness (load: 100 g) and isothermal ageing time (temperature: 325C) in coupons after solution
treatment.
Fig. 3 Relationship between electrical conductivity and isothermal ageing time (temperature: 325C) in coupons after solution treatment.
[image:2.595.62.280.71.202.2] [image:2.595.60.281.263.393.2]Fig. 4 SEM micrographs of (a) the solution treated specimen, (b) peak aged specimen and (d) overaged specimen.
[image:3.595.105.496.67.381.2] [image:3.595.96.501.415.767.2](e) and (h) showed recovery structures. The solution treated and overaged specimens possessed unrecrystallized structure after annealing for 30 min, and the peak aged specimen still maintained unrecrystallized structure even after annealing for 2 h. Figure 8(c), (f) and (i) showed recrystallized structures, where equiaxial grains with dislocation free were grown. In the solution treated and overaged specimens, recrystalliza-tion was completed after annealing for 2 h. The full recrystallization structure in the peak aged specimen was obtained after annealing for 8 h. Thus, the first stage (Vs1, Vp1 and Vo1) and the second stage (Vs2, Vp2 and Vo2)
recognized in Fig. 7 correspond to recovery and recrystalli-zation stages, respectively. Compared Fig. 7 with Fig. 8, it was evident that the recrystallizations in the overaged and solution treated specimens were completed rapidly (Vo2 and Vs2), whereas the peak aged specimen needed longer annealing time to recrystallize (Vp2).
Figure 9 plots the electrical conductivity of the same specimens in %IACS as a function of annealing time. The specimen thickness after cold rolling was about 0.25 mm and much thinner than the critical thickness (1 mm) giving a reliable absolute value of electrical conductivity. Therefore, not absolute value of electrical conductivity, but relative change in electrical conductivity may be available from this figure. Since these specimens were cold rolled to 95% reduction in thickness, the contribution of dislocations accumulated during rolling to the electrical conductivity should not be neglected. In all specimens, the electrical conductivity increased after annealing for 8 min. The overaged specimen had only one stage of increase in electrical conductivity. The increase in electrical conductiv-ity from 8 to 30 min was caused by the annihilation of dislocations introduced by cold rolling, because the overaged specimen did not give rise to further precipitation during annealing. The electrical conductivity of the solution treated and peak aged specimens appeared to increase in two stages. The first stage in both specimens occurred from 8 min to 16 min (Es1 and Ep1). The second stage in the solution treated specimen (Es2) and that in the peak aged specimen (Ep2) started from 30 min and 2 h, respectively.
Compared Fig. 7 with Fig. 9, we found that in the solution treated and peak aged specimens the decrease in hardness observed during the first stage (Vs1 and Vp1) almost coincided with the increase in electrical conductivity during the first stage (Es1 and Ep1). The increase in electrical conductivity (Es1 and Ep1) was caused by both precipitation and recovery. Since the increase in electrical conductivity observed during the second stage (Es2 and Ep2) coincided with the decrease in hardness during the second stage (Vs2 and Vp2), this stage may be ascribed to the annihilation of dislocations in recrystallization. In the solution treated specimen, the increase in electrical conductivity (Es1) caused by precipitation was completed before the decrease in
Fig. 6 (a) a TEM micrograph, and (b) and (c) EDX spectra obtained from constituent particles in the solution treated specimen.
V s 1
V p 1
V o 1 V s 2
V p 2
V o 2
[image:4.595.57.282.69.600.2] [image:4.595.309.541.75.209.2]hardness observed during the second stage (Vs2). This means that the precipitation was completed before recrystallization. In the overaged specimen, the decrease in hardness during the second stage (Vo2) occurred just after the increase in
electrical conductivity. The increase in electrical conductiv-ity may be ascribed to the annihilation of dislocations in recovery and recrystallization.
[image:5.595.104.492.73.457.2]3.3 Textures
Figure 10 shows’¼0, 25and 45sections of the ODF describing the texture of the as-received hot-rolled sheet. This hot-rolled sheet had a nearly random texture.
{111} pole figures and’¼0, 25and 45sections of the ODFs measured in the three types of specimens cold rolled to 95% reduction in thickness are presented in Figs. 11 and 12, respectively. Skeleton lines constructed from these data are illustrated in Fig. 13. These figures clearly showed the formation of copper type rolling textures consisting of -fibers connecting {110}h112i, {123}h634iand {112}h111i orientation. However, the intensity of orientations differed depending on the state of precipitation. As shown in Fig. 13, in the peak aged specimen, the {110}h112iorientation was the strongest of the three specimens, while the {112}h111i orientation was the weakest. The overaged specimen had the strongest {112} h111iand the weakest {110} h112i. In the solution treated specimen, the {110}h112iand {112}h111i
Fig. 8 Image quality (IQ) maps obtained by EBSD analysis. (a), (b) and (c) show the solution treated specimen after cold rolling, annealing for 30 minutes and 2 hours, respectively. (d), (e) and (f) the peak aged specimen after rolling, annealing for 2 hours and 8 hours, respectively. (g), (h) and (i) the overaged specimen after rolling, annealing for 30 minutes and 2 hours, respectively.
E s 2
Ep2
E s 1 E p 1
[image:5.595.60.280.525.652.2]orientations were the medium intensity of the three speci-mens, but the {123} h634i was the weakest. Thus, it was found that precipitation affected the development of cold rolling texture.
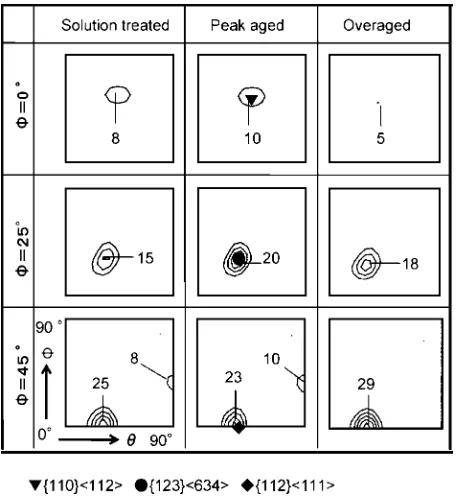
Figure 14 shows {111} pole figures of the specimens annealed at 300C for 24 h. The observed recrystallization textures were strongly dependent on the state of the precipitation before cold rolling. The peak aged specimen showed the weakest texture of the specimens. The {100} h001iorientation developed markedly in the solution treated and overaged specimens. In the latter, the {100} h001i orientation appeared to spread somewhat about the normal direction.
[image:6.595.88.515.240.391.2]Fig. 10 ’¼0, 25and 45sections of the ODF in the as-received hot-rolled sheet.
Fig. 11 {111} pole figures of (a) the solution treated specimen, (b) peak aged specimen and (c) overaged specimen after cold rolling to 95% reduction in thickness.
Fig. 12 ’¼0, 25and 45sections of the ODFs in the same specimens
as Fig. 11.
[image:6.595.55.283.443.692.2]Fig. 13 Skeleton lines consisting of the-fiber connecting {110}h112i, {123} h634i and {112} h111i orientations in the same specimens as Fig. 11.
[image:6.595.311.538.444.619.2]These textures were evaluated quantitatively by a detailed ODF analysis. The’¼0, 25and 45sections of ODFs are illustrated in Fig. 15. The overaged specimen showed the strongest {100}h001iorientation. The relative intensity was 30 times random. The intensity of the {123}h634iorientation was 10 times random. In the peak aged specimen, the {100} h001iorientation was the weakest; its relative intensity was 12 times random. The formation of the {110} h111i and {123}h634iorientations was also observed in this specimen.
4. Discussion
4.1 Effect of precipitation and work hardening on recrystallization
As shown in Fig. 2, the hardness measured before rolling was much lower in the solution treated specimen than in the peak aged specimen. However, after cold rolling to 95% reduction in thickness (Fig. 7), the hardness of the solution treated specimen was higher than that of the peak aged
specimen. This is because the solution treated specimen had the highest work hardening during rolling. The hardness changed from Hv58 to Hv113 upon cold rolling. In contrast, in the case of the peak aged specimen, the hardness after rolling was almost the same as that before rolling, and the work hardening was the lowest.
Scharf and Gruhl studied the effect of cold rolling reduction on hardness in the Al-0.79 wt%Mg-0.46 wt%Si alloy.15) Specimens taken from this alloy were solution treated at 535C for 15 min and quenched in water. Some of the specimens were used in the solution treated state, while others were either aged further at 200C for 100 h to obtain fine precipitates or held at 400C for 1 h and cooled slowly to obtain coarse precipitates. All specimens were cold rolled to thickness reductions ranging from 25 to 90%. The Brinell hardness of these specimens was measured before and after rolling. The solution treated specimen showed remarkable hardening with increasing rolling reduction, especially at low thickness reductions. The specimen containing coarse pre-cipitates also showed significant hardening, although the hardness before rolling was the lowest of the specimens. In contrast, in the specimen containing fine precipitates, the hardness slightly increased with increasing rolling reduction, and the work hardening rate was the lowest. Thus, although the hardness measured before cold rolling was the highest in the specimen containing fine precipitates, i.e. the peak aged specimen, the difference in hardness before and after cold rolling, i.e., the work hardening rate, was the lowest in this specimen.
[image:7.595.85.513.68.222.2]As shown in Fig. 7, in the solution treated specimen with the highest work hardening, i.e. the maximum difference in hardness before and after rolling, the hardness decreased abruptly during annealing and the recrystallization was completed more rapidly than that in the peak aged specimen with the lowest work hardening. Apparently, the difference in hardness before and after rolling, which depends on the precipitate condition before cold rolling, influences the subsequent recrystallization. The peak aged specimen showed that the difference in hardness before and after rolling was almost zero. However, the recrystallization actually occurred as shown in Fig. 8(f). We think that the change in hardness upon rolling is affected by not only work hardening but also precipitation hardening. During rolling,
Fig. 14 {111} pole figures of (a) the solution treated specimen, (b) peak aged specimen and (c) overaged specimen after cold rolling to 95% reduction in thickness and annealing at 300C for 24 h.
Fig. 15 ’¼0, 25and 45sections of the ODFs in the same specimens
[image:7.595.56.284.275.508.2]the effect of work hardening increased hardness, while the effect of precipitation hardening decreased hardness. There-fore, the hardness after rolling was almost the same as that before rolling.
Scarf and Gruhl have studied recrystallization in the specimens mentioned above.15)Isochronal annealing of the
specimens cold rolled to 75% reduction in thickness revealed that the specimen containing coarse precipitates recrystal-lized most rapidly at 280C. In the specimen subjected only to the solution treatment, recrystallization was completed at 370C. The specimen containing fine precipitates needed the higher annealing temperature than the solution treated specimen. The annealing temperature to be recrystallized was 400C.
Lillywhiteet al.have also studied the effect of precipitates on recrystallization in the high-purity Al-0.77 mass%Mg-0.5%Si alloy.9) At first, specimens taken from the alloy
were solution treated at 550C for 2 h. Some specimens were quenched in water, while others were cooled in a furnace to obtain coarse precipitates. After the solution treatment and quenching, some of specimens were further aged at 300C up to 50 h. The specimens with various size and distribution of precipitates were cold rolled to 70% reduction in thickness, and isothermally annealed at 300C. In the specimen with coarse precipitates cooled in the furnace, recrystallization was completed within 10 min. In the specimen subjected to only solution treatment, complete recrystallization was observed after 10 h of annealing. In the specimen with stable fine precipitates that was aged for 1 h at 300C, and the recrystallization was completed after 1600 h of annealing.
Previous studies conducted by Scarf and Gruhl15) and
Lillywhite et al.9) showed that the recrystallization in
specimens containing coarse precipitates was completed most rapidly, and the recrystallization in specimens contain-ing stable fine precipitates was last. These results agree with those obtained in the present study, although the thickness reduction of the specimens and the heat treatment conditions in the present study were different from those in previous studies.
It has already been noted in Figs. 7 and 9 that the precipitation in the solution treated specimen (Es1) started to occur almost simultaneously with the decrease in hardness (Vs1), and precipitation (Es1) was completed before recrys-tallization (Vs2). Precipitation should retard recrystalliza-tion. When we compared the difference in hardness at Vs2 with that at Vp2, the difference in hardness was larger in the solution treated specimen than in the peak aged specimen. Based on the difference in hardness between Vs2 and Vp2, the stored energy of recrystallization in the solution treated specimen is higher than that in the peak aged specimen. Therefore, the recrystallization in the solution treated speci-men was completed more rapidly than that in the peak aged specimen.
The difference in hardness at Vo2 in the overaged specimen was almost the same as that at Vp2 in the peak aged specimen. However, since the overaged specimen had no pinning effect cause by fine precipitates, the recrystalli-zation in the overaged specimen was completed more rapidly that in the peak aged specimen.
4.2 Effect of precipitations on the recrystallization texture
4.2.1 The peak aged specimen
It is reported that recrystallization textures in Al-Mg-Si alloys consist of the {100} h001i (cube), {110} h122i (P orientation, which corresponds to {110}h111iin this study) and {100} h013i (ND rotated cube) orientations.13) It is
widely accepted that the nucleation of {100}h001i recrystal-lized grains occurs at cube bands,16)whereas the {110}h111i
and {100}h013iorientations result from PSN at deformation zones forming around coarse particles larger than 1mm.13)In PSN, although recrystallized grains with random orientations nucleate in the deformation zones, only recrystallized grains with the orientations of {110} h111i and {100} h013i can survive because these grains have a 40 h111i orientation relationship with the neighboring deformed matrix (micro-growth selection).13)
As to the effect of particle size on recrystallization, large particles with sizes larger than 1mmpromote recrystallization by introducing additional nucleation sites where PSN can take place. In contrast, particles smaller than 1mm and closely spaced particles strongly impede the progress of recrystallization through pinning such that the motion of high angle boundaries is suppressed.10)
Before cold rolling, the peak aged specimen contained small and large constituent particles and fine precipitates. The recrystallization texture was composed of the orienta-tions {100} h001i, {110} h111i and {123} h634i. In particular, the {100} h001i orientation was much weaker than that observed in the other specimens.
According to the mechanism proposed by Engler,13) the
formation of the {110}h111iorientation observed in the peak specimen may be attributed to PSN occurring around the large constituent particles. However, recrystallization in this specimen was actually retarded. This means that the pinning caused by fine precipitate inhibits the nucleation around the large constituent particle during recrystallization.
4.2.2 The overaged specimen
In the overaged specimen, the recrystallization was completed rapidly (Fig. 7), and a strong {100} h001i orientation and comparatively weaker {123}h634i orienta-tion were observed (Fig. 15).
All the specimens used in this study had constituent particles of varying size. In addition, the overaged specimen contained rod-shaped precipitates. If the precipitates induced a pinning effect, recrystallization would be retarded. Con-versely, if the precipitates gave rise to PSN, recrystallization would be accelerated, and in addition, the {110} h111iand {100} h013i orientations would develop. The recrystalliza-tion in the overaged specimen was facilitated. However, the recrystallization texture showed a much stronger {100}h001i orientation than {110} h111iand {100}h013i orientations. Thus, we concluded that the precipitates that formed in the structure before cold rolling did not enhance PSN. The precipitates were 0.1mmin diameter and 1mmin length. In general, particles larger than 1mmare required for PSN, in which {110} h111i and {100}h013i recrystallized grains can grow preferentially. The size of the precipitates that formed in the overaged specimen may be insufficient for PSN.
The overaged specimen and the other two specimens prepared in this study were cold-rolled to 95% reduction in thickness. This is much higher than the reduction values in previous studies.6–12) Thus, the stored energy, i.e., the
driving force for recrystallization on the specimens, was presumably higher in this study than in previous studies. The increase in stored energy may enhance PSN or the nucleation at cube bands, or both. The overaged specimens contained constituent particles larger than 3mm, so that there was a possibility of PSN. However, the overaged specimen showed a strong development of the {100}h001i orientation.
As can be seen in Fig. 13, the rolling texture in the overaged specimen showed high intensities of-fiber from {123} h634i to {112} h111i orientations. During recrystal-lization, {100}h001irecrystallized grains presumably meet the deformed matrix with these orientations. The orientation relationship between the recrystallized grain and the de-formed matrix is most favored for growth of the recrystal-lized grains, i.e. 40 h111i rotation relationship.17,18)
There-fore, we conclude that the growth of the {100} h001i recrystallized grains nucleated at cube bands overwhelmed that of the {110}h111irecrystallized grains nucleated around large constituent particles, and therefore a {100} h001i recrystallization texture could be developed.
5. Conclusions
(1) The difference in the state of precipitates before cold rolling gives rise to differences in the rolling texture and recrystallization texture.
(2) In the peak aged specimen, the hardness after rolling is almost the same as that before rolling. This is because the effect of work hardening increases, while the effect of precipitation hardening decreases.
(3) The recrystallizations in the solution treated and overaged specimens are completed more rapidly than that in the peak aged specimen, because of pinning effect caused by fine precipitates and difference in driving force of recrystallization.
(4) In the peak aged specimen, the recrystallization texture mainly consists of {100} h001i and {110} h111i orientations. The pinning caused by fine precipitate
inhibits the nucleation around the large constituent particles during recrystallization.
(5) In the overaged specimen, the recrystallization texture reveals a strong {100} h001i orientation. The precip-itates that formed in the structure before rolling influence neither PSN nor retardation during recrystal-lization. The {100} h001iorientation develops due to the favored orientation relationship with deformed matrix.
Acknowledgement
This work was conducted in Branch Research Committee on Physical Metallurgy of Medium-Strength Aluminum Alloys. One of author (KK) thanks T. Shibayanagi for technical support on EBSD analysis.
REFERENCES
1) F. J. Humphreys and M. Hatherly: Recrystallization and Related Annnealing Phenomena, (Pergamon, 1996) pp. 235–266.
2) F. J. Humpherys: Acta Metall.25(1977) 1323–1344.
3) F. J. Humphreys and P. N. Kalu: Acta Metall.35(1987) 2815–2829. 4) R. D. Doherty and J. W. Martin: J. Inst. Metals91(1962) 332–338. 5) H. M. Chan and F. J. Humphereys: Acta Metall.32(1984) 235–243. 6) O. Engler and J. Hirsch: Mater. Sci. Forum217–222(1996) 479–486. 7) M. R. Clinch, S. J. Harris, W. Hepples, N. J. H. Holroyd and J. V. Wood: Proc. 6th Int. Conf. on Aluminum Alloys (edited by T. Sato
et al., Toyohashi, Japan, 1998) pp. 1185–1190.
8) G. J. Baczynski and D. J. Lloyd: Proc. 21st Riso Int. Symp. on Materials Science (edited by N. Hansenet al., Roskilde, Denmark, 2000) pp. 227–234.
9) S. J. Lillywhite, P. B. Prangnell and F. J. Humphreys: Mater. Sci. Technol.16(2000) 1112–1120.
10) O. Engler and J. Hirsch: Mater. Sci. Eng. A336(2002) 249–262. 11) C. S. Chang, A. S. C. Yeung and B. J. Duggan: Mater. Sci. Forum
495–497(2005) 591–596.
12) J. Go, W. J. Poole, M. Militzer and M. A. Wells: Mater. Sci. Forum
426–432(2003) 291–296.
13) O. Engler: Mater. Sci. Technol.12(1996) 859–872. 14) J. R. Roe: J. Appl. Phys.37(1965) 2069–2072. 15) G. Scarf and W. Gruhl: Z. Metallkde60(1969) 413–421.
16) H. E. Vatne, T. Furu and E. Nes: Mater. Sci. Technol. 12(1996) 201–210.
17) K. Lu¨cke, R. Rixen and M. Senna: Acta Metall.24(1976) 103–110. 18) B. J. Duggan, M. Sindel, G. D. Ko¨hlhoff and K. Lu¨cke: Acta Metall.