Heterogeneous Process of Disordering and Structural Refinement
in Ni
3Al during Severe Plastic Deformation by High-Pressure Torsion
Octav Ciuca
1;*, Koichi Tsuchiya
1;2, Yoshihiko Yokoyama
3,
Yoshikazu Todaka
1and Minoru Umemoto
11Department of Production Systems Engineering, Toyohashi University of Technology, Toyohashi 441-8580, Japan 2Hybrid Materials Center, National Institute for Materials Science, Tsukuba 305-0047, Japan
3Institute for Materials Research, Tohoku University, Sendai 980-8577, Japan
The process of grain refinement in Ni3Al by high-pressure torsion (HPT) was investigated up to 100 turns. The entire diametric sections of
the deformed samples were analyzed by optical microscopy and image processing methods in order to evaluate both the spatial distribution and the volume fractions of the nanocrystalline and coarse grains. A thick band of nanocrystalline phase was formed in the middle section of the samples, and a structure containing mainly coarser ordered fragments was present in the vicinity of the top and bottom surfaces. Pseudo-twinning along {111} was observed at the boundaries of coarse-fragmented grains as well as the inside of the fragments and is put forward as a possible mechanism for disordering and nanocrystalline structure formation in Ni3Al. [doi:10.2320/matertrans.MB200915]
(Received September 1, 2009; Accepted October 21, 2009; Published December 9, 2009)
Keywords: disordering, twinning, high-pressure torsion, nanocrystalline materials, intermetallic compound
1. Introduction
The effect of SPD on the microstructures and properties of bulk metallic materials has been a subject of extensive investigations with the main goal of reducing the average grain size of the processed materials down to nanometer scale in order to improve their mechanical properties. A majority of those investigations, however, concern almost exclusively pure metals or solid solutions. Meanwhile there are much fewer reports on the severe plastic deformation of interme-tallic compounds, and this is mainly due to the inherent brittleness of this class of materials. The High-Pressure Torsion (HPT) method opened a pathway to investigate these compounds since the large torsion deformation is applied under quasi-hydrostatic conditions which significantly sup-press the fracture. A number of intermetallic compounds, such as TiNi,1,2) Ni
3Al,3–6) Cu3Au,7) ZrCu,8) and Zr3Al,9)
have been subjected to HPT deformation which, aside from the expected grain refinement, resulted in various interesting phenomena, e.g. amorphization, disordering, and/or shear band formation. Ni3Al represents a very attractive group of
intermetallics from a technological point of view, used mainly as a strengthening phase in superalloys. In recent years continued interest has been manifested towards the
improvement of the mechanical properties, e.g. their
ductility. HPT deformation of Ni3Al has been studied by
various workers. Languillaume et al.5)reported almost full
disordering and grain refinements to 50 nm as well as the formation of the strong torsion texture. Korznikov et al.6)
pointed out that the addition of B increases the thermal stabilities of the nano-grained structures in HPT-deformed Ni3Al. The process of nanocrystalline structure formation
during HPT deformation was studied by Korznikovet al.4)
They reported a heterogeneous structure composed of highly misoriented nanocrystalline areas and microcrystalline areas with high densities of defects including dislocations and twins. They have found that the first stage of the nano-structure formation is the fragmentation of grains by the formation of deformation twins, followed by the develop-ment of misorientation between the fragdevelop-ments and eventually leading to disordered equiaxed nano-grains. They have attributed chemical disordering to occur by the glide of dislocations which leave anti-phase boundaries in their wake. Rentenbergeret al.have carried out detailed TEM
observa-tions on HPT-deformed Ni3Al with a modified composi
tion (Ni-18 mol%Al-8 mol%Cr-1 mol%Zr-0.15 mol%B).3,10)
They have also reported the formation of the heterogeneous structure, and indicated that grain fragmentation occurs along {111} planes, with the fragments separated by sharp boundaries. They concluded the boundaries have a character of dislocation boundaries. Local disordering at the bounda-ries has been found. The present authors have studied the nano-grain formation and its relation to the micro hardness. The deviation from Hall-Petch behavior in the hardness was related to the activity of Shockley-partial dislocations and to the appearance of deformation twins in the disordered nano-grains.11)
Therefore the process of nanostructure formation in Ni3Al
is still controversial, particularly the presence and importance of deformation twinning and the dominant mechanism of disordering. To shed a new light on these uncertainties, we have performed a systematic investigation on the evolution of microstructures in Ni3Al. It will be shown that the
deforma-tion process during HPT can be inhomogeneous throughout the samples and that the pseudo-twinning may be one of the mechanisms of disordering.
2. Experimental
The material used in the present study was a single-phase binary Ni3Al, arc-melted and cast into a cylindrical ingot of *Graduate Student, Toyohashi University of Technology. Present address:
Hybrid Materials Center, National Institute for Materials Science, Tsukuba 305-0047, Japan. Corresponding author, E-mail: CIUCA. [email protected]
Special Issue on Severe Plastic Deformation for Production of Ultrafine Structures and Unusual Mechanical Properties: Aiming Breakthrough in Materials Development
10 mm in diameter. The ingot was sliced into 0.85 mm thick discs, which were homogenized for 3.6 ks at 1173 K followed by furnace cooling. The samples were deformed at room temperature using a high-pressure torsion (HPT) apparatus with anvils having a depression depth of 0.25 mm. The details for the apparatus can be found elsewhere.12) The turning
speed was set at 0.2 rpm and the applied pressure was 5 GPa. Both the planar and diametric sections of the plastically-deformed disc samples were prepared for optical microscopy; the planar samples were mechanically ground down to roughly the median plane and, along with the diametric samples, carefully etched with a mixture of 25 vol% nitric acid, 25 vol% sulfuric acid and 50 vol% water. Observations were performed on a Nikon Eclipse LV150 microscope in the dark-field (DF) and differential-interference contrast (DIC) observation modes. In the DF mode only reflections from surfaces at an angle different from 90to the optical axis are
allowed and these surfaces appear bright, while completely flat surfaces perpendicular to the optical axis appear dark. The DIC configuration uses the optical path difference of the beams reflected by surfaces at different relative heights to emphasize topological features on the sample surface. These two observation modes were used to characterize the top-ography of the etched specimen surfaces. Secondary-electron images of the etched sample surfaces were also obtained using a JEOL JSM-7001F scanning electron microscope operated at 15 kV. X-ray diffractometry (XRD) was per-formed on the diametric sections of the deper-formed discs using a RINT 2500 diffractometer (Bragg-Brentano geometry) with Cu-Kradiation (40 kV–250 mA), 1/2divergence and
scattering slits, and an exit monochromator (graphite [0002]).
The beam width varied between 2{9mm at the sample
position for the chosen range of diffraction angles; this ensured the beam is wider than the diffracting surfaces of the samples. Disc samples (3 mm) for transmission electron microscopy (TEM) analysis were cut from the edge and central regions of the deformed samples so that the electron-transparent areas are situated near a radial distance of 3:5mm and 0 mm, respectively. Electropolishing was done using a Tenupol-5 with an electrolyte consisting of 20 vol% sulfuric acid and methanol at a temperature of 258 K with an applied voltage of 10 V. TEM investigations were performed on Hitachi H-800 and JEOL JEM-2000FX, both operated at an accelerating voltage of 200 kV. High-resolution TEM analysis was performed on a JEOL JEM 2100F microscope operated at 200 kV.
3. Results
The X-ray diffraction patterns measured on the diametric sections of the HPT-deformed discs are plotted in Fig. 1. Figure 1(a) shows the entire diffraction patterns, and Fig. 1(b) gives an enlarged view of the patterns in the lower angle region containing two superlattice reflections (100 and 110). The samples are identified in the plot by the number of turnsNin HPT deformation. The diffraction pattern of the as-homogenized structure was also included. Two main trends can be noted. Firstly, the fundamental reflections show significant broadening and decrease in peak intensity during the first HPT turn, indicating significant structural
refine-ment. Secondly, the intensities of the superlattice reflections decrease abruptly within the earliest stages of torsional straining, as seen in detail in Fig. 1(b), and the peaks become indistinguishable from the background after about 10 turns, suggesting almost complete disordering in the deformed sample.
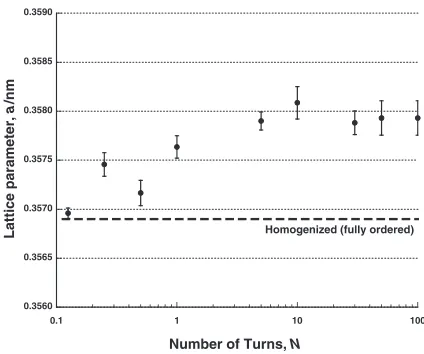
Another indication of the disordering by plastic deforma-tion is an increase in the lattice parameter value. Ni3Al
intermetallic compound is known for the linear dependence of its lattice parameter on the LRO parameter.13,14)The lattice
parameter, a, is plotted in Fig. 2 as a function of N and compared with the value determined for the as-homogenized structure, considered fully ordered. Theavalues were deter-mined from the peak positions of the fundamental reflections using the CellCalc software.15)The lattice parameter value
for the homogenized structure (a¼0:357nm) agrees well with the literature for Ni3Al (a¼0:3560{0:3571nm).16) A
marked increase in the lattice parameter was observed in the first 1 turn of HPT, indicative of considerable loss of LRO, while further straining brings about a limited increase up to 10 turns. This confirms that the disordering process occurs predominantly in the relatively early stages of deformation, as shown by the superlattice peak intensities.
20° 30° 40°
N =1 N =5 N =10
100 110 N =1/2
N =1/4
N =1/8
Homog.
Diffraction Angle, 2 (Cu-K)
N =100
20° 30° 40° 50° 60° 70° 80° 90° 100°
Intensity,
I
/cps
Diffraction Angle,2 (Cu-K)
N =1 N =10
100 110
210 211 300
111
200 220 311 222 N =100
N =1/2
N =1/4
N =1/8
Homog. N =5
2000 cps
500 cps
θ α θ α
Fig. 1 (a) Evolution in X-ray diffraction patterns of HPT deformed Ni3Al,
measured on the diametric sections of the disc samples.N: number of turns in HPT deformation. (b) Enlarged view of lower angle range.
0.3560 0.3565 0.3570 0.3575 0.3580 0.3585 0.3590
0.1 1 10 100
Lattice parameter,
a
/nm
Homogenized (fully ordered)
Number of Turns, N
[image:2.595.312.540.76.222.2] [image:2.595.320.532.284.461.2]Crystallite size for the HPT-deformed samples was estimated from the measured broadening of the X-ray diffraction peaks using the Hall-Williamson equation, and appear to indicate an evolution withNsimilar to the one reported by Korznikov
et al.4)The average crystallite size determined in the present
data, measured in the diametric sections, is consistently
larger (20nm) than the value determined by the same
experimental method on the planar section (15nm). The difference indicates that the grain refinements are more significant in the direction perpendicular to the plane of shear than within the plane.
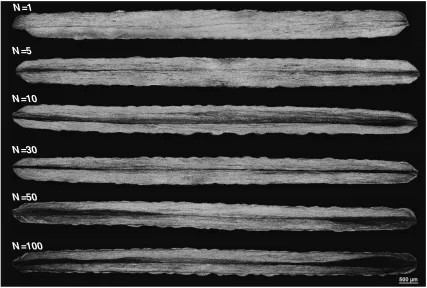
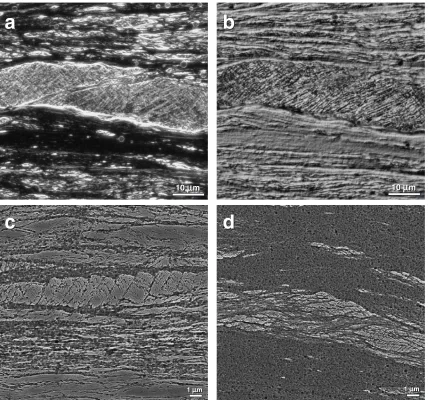
DF optical images of the entire diametric sections used for XRD are presented in Fig. 3. The etching revealed regions with strongly different appearances. Dark bands can be seen running horizontally in the middle section of the HPT deformed samples, forming sharp interfaces with a much brighter structure. An increase in the thickness of the dark bands withNis readily apparent. It is also apparent that their thickness increases at a higher rate in the edge than in the center of the discs. Details of the diametric section of the sample processed byN¼1can be seen in Fig. 4. Structural features specific of the edge region are shown in Fig. 4(a) in DF mode. The dark areas with a predominantly horizontal orientation in the image are observed to be nearly-flat, almost featureless regions in the corresponding DIC image (Fig. 4(b)), while the bright regions in (a) are seen as a finely-fragmented structure in (b). These two significantly different appearances of neighboring regions of the etched surface suggest a clearly different reaction to the etching solution and are an indication of structural heterogeneity. Figures 4(c) and (d) show comparative secondary-electron images of the etched structure in the center and edge regions of the same sample respectively, at positions roughly around
the median section of the discs. In both images, dark-gray regions which correspond to the dark areas in Fig. 4(a) and the featureless areas in Fig. 4(b) are covered by submicron etch pits, while the lighter areas seem to be relatively flat. Based on these observations and TEM observations in the previous works,3,11) it is inferred that the dark-gray areas
covered by etch pits are nano-grained regions, which are disordered and thus less resistant to etching, and that the lighter, relatively flat areas correspond to coarse-grained volumes in which long-range order is retained, making them more resistant to etching. Figure 4(c) shows fragmented coarse grains apparently separated by thin bands of nano-grains, which run parallel to the plane of shear. The fragmented aspect of the coarse grains suggests that the division caused by plastic deformation becomes increasingly finer with strain, with the fragments locally reaching submicron size. In the edge region of the sample where the theoretical strain is highest (Fig. 4(d)), the nanograined bands form a matrix completely surrounding remnant frag-ments of the coarse grains.
The area fraction of the nanocrystalline structure across the diametric section was estimated by image analysis tech-niques, by taking advantage of the strong contrast between the optical appearances of the two structures in DF mode. The results indicated a monotonic increase of the area fraction with straining, with maximum values for the sample deformed by 100 turns, of 36% for the entire section and of 58% in smaller edge areas.
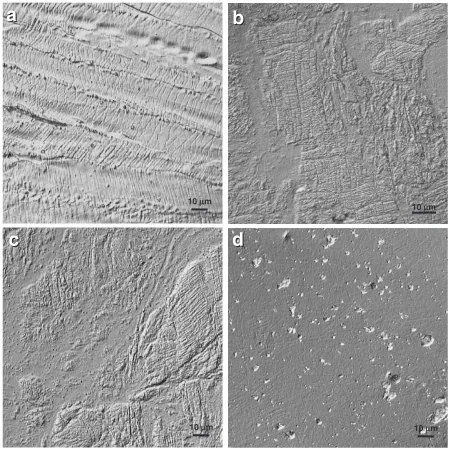
Structural aspects of the edge regions of HPT-deformed samples as viewed in the planar section (parallel to the shearing plane and roughly in the median plane of the sample) were also analyzed by OM in the DIC mode and are presented in Fig. 5. The structure after the initial compres-N=30
N=50
N=100 N=5
N=1
N=10
[image:3.595.84.511.72.360.2]sion (N¼0) is characterized by a high density of intersecting slip bands. After 1 turn of HPT the nanocrystalline bands and fragmentation are clearly visible. The bands appear wider in the planar section view than they do in the diametric section, suggesting that they lie almost flat along the shear plane. Further straining leads to an increase in the area fraction of nanocrystalline structure, reaching almost 100% in the edge region after 10 turns of HPT. In all investigated samples it was found that the nanocrystalline area fraction varies only with the radial distance but not with the angular position on the sample surface and it reaches close to 100% in all regions at higher plastic strain.
A complete illustration of the microstructural evolution with plastic deformation of the binary alloy used in this study, as observed in TEM studies, is shown in Fig. 6. The initial compression (N¼0) leads to the accumulation of a large number of dislocations gliding along the {111} slip planes.17)The shear strain resulting from the rotation of the bottom HPT anvil initiates the fragmentation of the original grains and the formation of thin bands of nanocrystals, as seen in the structure characteristic for the N¼1 sample (Fig. 6(b)). As will be shown later, it is also in this stage that
disordered nanograined bands are observed running along crystallographic boundaries. Further deformation (N¼5, Fig. 6(c)) leads to the formation of a nanocrystalline matrix in which fragments of coarse grains are completely isolated and maintain only a limited degree of LRO. The electron diffraction pattern of the nanocrystalline matrix assumes the typical ring shape with a uniform intensity distribution and it shows no superlattice reflections. At strain levels of more than 10 turns the structure becomes uniformly nanograined. These observations are consistent with the OM results presented in Fig. 5.
The edge region of the sample subjected to a moderate level of strain (N¼1), shown in Fig. 7, exhibits a finely fragmented grain surrounded by nanograined bands. This is in good agreement with the SEM observations on the diametric section discussed above (Fig. 4(d)). The fragments have large aspect ratios, and their widths are of the order of tens of nanometers. The fragmented structure is viewed along the [0111] direction, with two sets of {111} planes end-on. The spreading of fundamental reflection spots in the diffraction pattern of the fragmented grain indicates rela-tively small azimuthal misorientation angles (<5) between
a
a
b
b
10 µµm
10 µm 10 10 µµm m
1 µm 1 µm 1 µm
1 µm
c
c
d
d
Fig. 4 Diametric section views of a Ni3Al disc deformed by 1 turn of HPT: (a) dark-field (DF) and (b) differential-interference contrast
[image:4.595.85.513.71.471.2]neighboring fragments. Superlattice reflections, although weaker than in the as-homogenized structure, indicate that LRO is still retained. The diffraction pattern of the surrounding bands shows almost perfect Debye rings, characteristic of nanograined structures, and no superlattice reflections, suggesting large misorientations and complete chemical disordering.
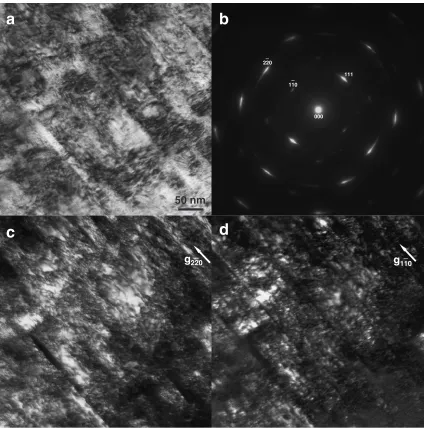
The details of the fragmented structures are shown in Figs. 8(a)–(d). Figures 8(a) and (b) show a BF image and the corresponding SAD pattern of the fragmented structure in the
N¼1sample, respectively. The appearance of theg1110spot in Fig. 8(b) indicates that the long range order is still retained. Boundaries between the fragments are noted as the discontinuity in bend contours and strain contrast and are parallel to {111} in Fig. 8(a). Similar features can be seen in a dark field (DF) image with a fundamental reflection ofg2220
shown as Fig. 8(c). Figure 8(d) is a DF image of same area obtained with theg1-10superlattice reflection. The fragment
boundaries appear dark in the image, although no contrast can be seen at the corresponding locations in Fig. 8(c), indicating the local disordering at the boundaries. The thickness of the disordered boundaries is as much as 5 nm. These results are similar to those found by Rentenberger
et al.3)
Similar fragmented plate structures but with a different boundary structure were also found. Figure 9 shows a BF image (Fig. 9(a)), the corresponding SAD pattern (Fig. 9(b)) and a DF image (Fig. 9(c)) obtained from central region of
N¼1 sample. As shown in Fig. 9(a) the fragments are
separated by the long thin strips with thicknesses of less than 10 nm along the (1111) planes. Streaks perpendicular to the (1111) planes are visible in the corresponding diffraction pattern (Fig. 9(b)), caused by the reduced thickness of these structural features. Weak twin spots for the fundamental reflections (g111andg200) are also visible, with (1111) as the twinning plane, but no twinning spots are seen on the
10 µµm
10 µm
10 µm 10 µm
a
a
b
b
c
c
d
d
Fig. 5 Differential-interference contrast images of the edge regions of Ni3Al samples deformed by HPT (plane view). a:N¼0
[image:5.595.72.522.71.521.2]superlattice reflections (e.g.g011). Figure 9(c) is a DF image with the g200 twin spot, which shows the strips appearing brighter, thus confirming the twin relationship between the strips and the fragmented plates. In addition, the absence of superlattice spots given by the strips indicates that they are disordered.
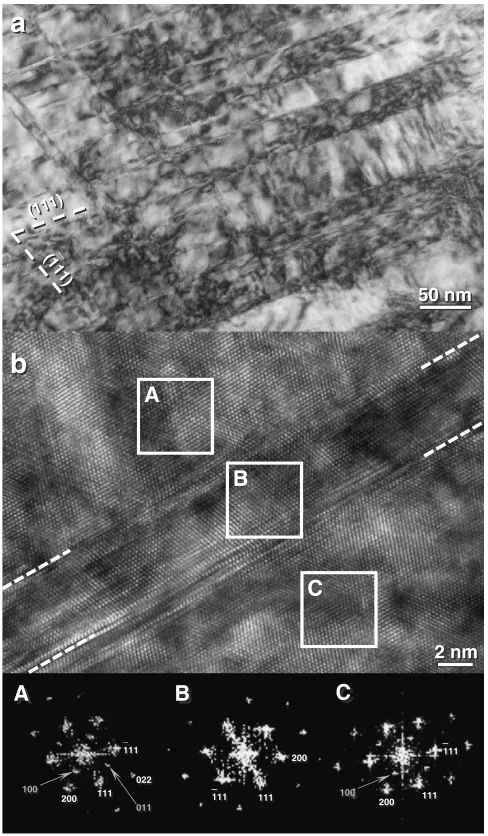
Figure 10(a) is a BF image of the fragmented plates in the central region of theN¼1sample. In addition to the primary twins along (1111) planes separating the fragments, secondary twins along (111) planes are visible which further divide each fragment plate. Figure 10(b) is a HREM image of a fragment boundary observed in the same sample. FFT images from the area delineated by the boxes A, B and C are shown as insets. A plate of about 6 nm thickness can be seen at the fragment
boundary. The FFTs A and C reveal that the fragments on both sides of the thin plate have the same orientation, while the plate B is in the twin orientation with respect to A and C. It should be also noted that the superlattice spots are absent in B, which supports the probability that the thin twin plate formed at the fragment boundaries is disordered. The more details of structure and formation of the pseudo-twins are under investigation.
4. Discussion
The evolution of microstructures in Ni3Al during severe
plastic deformation has been investigated by various methods; the overall tendency is in general agreement with
1 µµm
1 µm
a
a
c
c
d
d
b
b
200 111 000 000 100
011
000 200
220
000 111
200
1 µm
1 µm
1 µm
1 µm 1 1 µµmm 111
Fig. 6 TEM images and corresponding selected area diffraction patterns of Ni3Al deformed by HPT. (a)N¼0, bright-field; (b)N¼1,
dark-field; (c)N¼5, dark-field; (d)N¼10, dark-field.
500 nm
500 nm
500 nm
500 nm
000 000
111 111
111 111 _ _
200 200
g200
g200
coarse
nano
a
a
b
b
(111) (111) _ _
(111) (111)
Fig. 7 Ni3Al microstructure deformed by 1 turn of HPT: (a) coarse fragmented grain surrounded by disordered nanocrystalline grains; the
[image:6.595.86.512.67.368.2] [image:6.595.71.529.414.555.2]those reported in the previous works;3,4,10,18) i.e., the for-mation of duplex structures composed of nanocrystalline areas of disordered fcc, and fragmented grains bounded by sharp boundaries parallel to {111} which maintain, at least
in part, their L12 order. Further straining leads to a gradual
increase in the volume fraction of the disordered nano-crystalline regions at the expense of the fragmented grains, until no trace of the latter can be found within the analyzed g220
g220___
g110
g110__
50 nm
000 110 220
_ _
111
a
c
d
b
Fig. 8 TEM images of fragmented grains in Ni3Al deformed by 1 turn of HPT. (a) bright-field image. (b) selected area diffraction.
(c) dark-field image with fundamental reflectiong2220. (d) dark-field image with superlattice reflectiong1110.
100 nm
100 nm
100 nm
000 000
111 111
200 200
200T
200T
111T
111T 100 100
011 011
a
a
b
b
c
c
111 111 _ _
[image:7.595.86.513.70.499.2] [image:7.595.71.524.540.699.2]volume. Aside from these views, the present investigation revealed the more heterogeneous nature of the deformation structures, as well as a possible mechanism of disordering by pseudo-twinning.
The panoramic images in Fig. 3 indicate not only the volume fraction evolution of the nanocrystalline region with torsional straining in a constrained HPT setup, but also the heterogeneous nature of grain refinement in the sample. The thick nanocrystalline bands form preferentially in, and extend from, the median section plane of the disc samples, parallel to the shear plane. The mechanism of the formation of this band is not clear at this point, but it may be related to a higher level of initial deformation in this middle section as a result of the HPT machine setup. The thickness of the disc sample (0.85 mm) is slightly larger than the combined depth of the anvil depressions (0:5mm), thus on application of com-pressive stress the excess material can flow out and create backpressure to achieve a pseudo-hydrostatic condition. This part of material remains unconstrained during the rest of the
torsion straining. Hence it could be speculated that the deformation localized, at least to some extent, at the middle section near the edge, leading to the initial formation of a nanocrystalline band. Further shear straining causes a continuous increase in the volume fraction of nanocrystalline in the medium section as well as the gradual spreading of the grain-refined structure to adjacent regions. Rentenberger
et al. suggested that the transition of coarse fragments to nanocrystalline occurs at their boundaries due to high stress concentration, and that the nanocrystalline structure in Ni3Al
accommodates larger strain than in the coarser structure.18) This may explain the observed heterogeneous process of nanocrystalline formation during straining. In addition, as was noted in Fig. 4(c), a network of very fine, submicron bands of disordered nanocrystalline grains is formed in the entire volume of the sample even at very low shear strains, thus explaining the rapid loss of LRO. However the speculation cannot explain the relatively homogeneous structures in HPT-deformed pure metals. Further investiga-tion is necessary to clarify the detailed mechanism of the heterogeneous process.
In the present study, the fragmented structures were very often found to be bounded by pseudo-twins on {111} planes. Secondary twins, which further divide the elongated frag-ments to equiaxed ones, were also observed, indicating a minimum of two active twinning systems. These observa-tions are in partial agreement with a previous report of deformation twinning in HPT-deformed Ni3Al. Korznikov et al.4) observed twins with thicknesses of 300–400 nm on three active systems, and also much thinner twin lamellae, of 20nm, the latter being similar to our observations. However, the L12long-range order was reportedly preserved.
This seems to contradict the geometrical considerations of f111gh112i twinning in L12 lattice.19) Meanwhile, in a
Ni3Al alloy with a modified composition (Ni-18
mol%Al-8 mol%Cr-1 mol%Zr-0.15 mol%B)3)no twins were observed,
although the microstructural aspect of the strained alloy was remarkably similar. The discrepancy may be due to the difference in the twin boundary energies of the investigated alloys. Rentenberger et al. attributed the disordering at the boundaries to the formation of APB tubes, which form as a results of the interaction between gliding dislocations.3) The present investigation revealed that the pseudo-twinning can be an additional mechanism of disordering. A possible grain-refinement mechanism is suggested which involves the formation of a fragmented structure and disordering by pseudo-twinning, and subsequently the division of elongated fragments into equiaxed fragments by secondary pseudo-twinning. As a result, a structure of equiaxed grains bounded by disordered twins forms. On further straining, these disordered boundaries can become active sources of
1=2h110i superpartial dislocations, and they will further promote the disordering and dynamic recovery which will eventually lead to the formation of the nanocrystalline structure.
5. Conclusion
The process of disordering and grain refinement during severe plastic deformation by high pressure torsion (HPT)
A
B
C
50 nm 50 nm 2 nm 2 nm (111) (111) _ _ (111) (111)a
a
b
b
A
A
B
B
C
C
[image:8.595.47.291.71.489.2]111 111 _ _ 111 111 111 111 _ _ 111 111 _ _ 200 200 022 022 100 100 111 111 200 200 111 111 200 200 100 100 011 011
Fig. 10 (a) TEM bright field image of Ni3Al after HPT deformation
was investigated for Ni3Al. Even at relatively low levels of
induced strain, almost complete loss of long-range order and the formation of a fully nanocrystalline band in the middle section of the disc samples were found. It is believed that this strongly heterogeneous distribution of the nanocrystalline phase in the deformed specimens is caused by the significant strain gradient occurring in the earliest stages of deformation at the sample edge, as a result of the HPT anvil geometry. Deformation twins were found at the boundaries of coarse fragmented grains and in their interiors in the sample after 1 turn of HPT deformation. The TEM analysis revealed that the twins were disordered; thus, they are pseudo-twins, never before reported in Ni3Al. The observed twinning can be an
important mechanism of disordering and grain refinement. More details on the structures and formation mechanisms of the pseudo-twins and their role in grain refinement are under investigation.
REFERENCES
1) Y. V. Tat’yanin, V. G. Kurduymov and V. B. Fedorov: Phys. Metall. Metallography62(1986) 133–137.
2) A. V. Sergueeva, C. Song, R. Z. Valiev and A. K. Mukherjee: Mater. Sci. Eng. A339(2003) 159–165.
3) C. Rentenberger and H. P. Karnthaler: Acta Mater.53(2005) 3031– 3040.
4) A. V. Korznikov, G. Tram, O. Dimitrov, G. F. Korznikova, S. R. Idrisova and Z. Pakiela: Acta Mater.49(2001) 663–671.
5) J. Languillaume, F. Chmelik, G. Kapelski, F. Bordeaux, A. A. Nazarov,
G. Canova, C. Esling, R. Z. Valiev and B. Baudelet: Acta Metall. Mater.41(1993) 2953–2962.
6) A. V. Korznikov, O. Dimitrov, G. F. Korznikova, J. P. Dallas, S. R. Idrisova, R. Z. Valiev and F. Faudot: Acta Mater.47(1999) 3301– 3311.
7) C. Rentenberger and H. P. Karnthaler: Acta Mater.56(2008) 2526– 2530.
8) K. Tsuchiya, T. Waitz, T. Hara, H. P. Karnthaler, Y. Todaka and M. Umemoto: 14th European Microscopy Congress, (Springer, Aachen, 2008) pp. 385–386.
9) D. Geist, C. Rentenberger and H. P. Karnthaler: 14th European Microscopy Congress, (Springer, Aachen, 2008) pp. 647–648. 10) C. Rentenberger, T. Waitz and H. P. Karnthaler: Mater. Sci. Eng. A462
(2007) 283–288.
11) O. Ciuca, K. Tsuchiya, Y. Yokoyama, Y. Todaka and M. Umemoto: Mater. Trans.50(2009) 1123–1127.
12) Y. Todaka, J. Sasaki, T. Moto and M. Umemoto: Scr. Mater.59(2008) 615–618.
13) S. Gialanella and R. W. Cahn: Kinetics of Ordering Transformations in Metals, ed. by H. Chen and V. K. Vasudevan, (The Minerals, Metals & Materials Soc., 1992) pp. 161–175.
14) G. Chen, X. Ni and T. Nsongo: Intermetallics12(2004) 733–739. 15) http://homepage2.nifty.com/~hsc/soft/cellcalc e.html
16) P. V. Mohan Rao, K. Satyanarayana Murthy, S. V. Suryanarayana and S. V. Nagender Naidu: Phys. Stat Sol. (a)133(1992) 231–235. 17) I. Baker and E. P. George:Encyclopedia of Materials: Science and
Technology, vol. 5, ed. by K. H. J. Buschow, R. Cahn, M. C. Flemings, B. Ilschner, E. J. Kramer, S. Mahajan and P. Veyssiere, (Elsevier, Amsterdam, 2001) pp. 4229–4232.
18) C. Rentenberger, H. P. Karnthaler and R. Z. Valiev: Nanomaterials by Severe Plastic Deformation, ed. By M. Zehetbauer and R. Z. Valiev, (Wiley-VCH, Weinheim, Vienna 2004) pp. 80–85.