Innovation Performance of Chilean
SMEs: A Bivariate Probit Analysis
Rehman, Naqeeb Ur
Hazara University Mansehra
4 January 2016
Online at
https://mpra.ub.uni-muenchen.de/68827/
Innovation Performance of Chilean Firms: A Bivariate Probit Analysis
Naqeeb Ur Rehman, PhD (Economics) Hazara University Mansehra
Abstract
The purpose of this paper is to investigate the innovation activities of Chilean firms’ by using micro level data. Previous studies showed research gap related to micro level analysis of the Chilean SMEs. For the first time, multiple proxies have been used as dependent variables (product/process innovations and patent application/spending), which is neglected by the past studies. A micro level data has been obtained from the World Bank, Enterprise Survey on 696 Chilean SMEs. Bivariate probit estimation method has been used. The results showed that SMEs are less likely to apply for patents and introduce product innovations. This outcome indicates that Chilean SMEs face resource constraint in terms of introducing product
innovations and applying for patents. In addition, SMEs undertaking R&D and making network ties with other research institutions are more likely to introduce patents and product innovations. Similarly, SMEs that are engage in quality programs are more likely to spend on patents. Lastly, SMEs with public support for innovation activities positively influence the patent application. Findings imply that SMEs investment in knowledge based assets (e.g., R&D, networks and quality methods) accelerate their innovation output. Policy makers should not only provide financial incentives (R&D subsidies) to SMEs but also encourage their strong ties with research institutions for higher innovation output.
Keywords: Innovation, R&D, SMEs
1. Introduction
external knowledge, which is called absorptive capacity (Cohen and Levinthal, 1990; Harris and Reid, 2010). In particular, this empirical study is more focused on the analysis of innovation activities of small and medium enterprises (SMEs) because these are the cornerstone for most of the economies in the world. In Europe, 99% of the Industry is comprises SMEs (<250 employees) and provides 70% of the employment opportunities (Neito and Santamaria, 2010). More specifically, in Chile more than 90% of enterprises are
SMEs and approximately 60% of the workforce is employed in the business sector. This indicates that SMEs in developed and developing countries provide a major source of workforce in the country.
On the one hand, in the developing countries where poverty, unemployment, low income per capita, low literacy, high inflation and interest rates hinder the economic growth, SMEs contribute significantly to the national income and provide employment opportunities (Ghoneim, 2003; Moktan, 2007; Drnovsek, 2004). On the other hand, SMEs have lower survival rates than large firms because of their resource constraints (financial and non- financial) (Beck et al. 2005). This indicates that SMEs are less innovative than large firms. Specifically, the aim of this study is to provide the key determinants of innovation performance (as output) which is derived from the knowledge-based view of the firm’s. Moreover, this study has formed a basic research question which is as follows: Why are SMEs less innovative? To answer this research question this study has identified the important knowledge based resources (i.e., R&D, networks, quality programs) to analyze the Chilean SMEs innovation performance. While, product and process innovation, patent application and patent spending are the proxies of measuring SMEs innovation performance.
Regarding the contribution, this research study has contributed to the existing knowledge in two different ways. First, the study has used multiple dependent variables (patent
introduce product innovations. Likewise, public support programs (subsidy or tax incentive) related to innovation activities has a positive impact on the firms’ innovation performance.
The present study is structured as follows: section 2 discusses the literature review and section 3 present the methodology, Chilean firms as research context and data sources with descriptive analysis. Estimation of hypotheses has been provided in section 4. Section 5
concludes the major findings with policy implications.
2. Theoratical Background
Rangone (1999) argued that SMEs lack innovative capabilities due to a critical shortage of resources. For instance, small firms are reluctant to invest in R&D and have low human capital as compared to large firms, which may affect the former’s innovation performance (Saleh and Ndubisi, 2006). Similarly, SMEs have few opportunities to exploit economies of scale because of high financial barriers and intense technological competition (Friestsch et al.
2013; Belitz and Lejpas, 2014; Adam, 1982; Ying, 2009). Furthermore, Ortiz et al. (2013) examined the innovation performance of Latin American countries (Argentina, Brazil, Chile, Columbia, Peru, Mexico and the Caribbean) using firm level data. Their study revealed that large firms are more innovative than SMEs in terms of R&D, product and process innovation. Moreover, they discussed that informal organizational structure and poor marketing abilities significantly reduce the innovation performance of SMEs. In addition, Radas and Bozic (2009) investigated the barriers to innovation for Croatian SMEs. They identified that lack of qualified staff, lack of information concerning technology and lack of information concerning market; high innovation cost and insufficient government support reduce the innovation performance of SMEs.
On the other hand, Lane and Lubatkin (1998) suggested that small firms usually comprise
SMEs have certain advantages over large firms such as their organizational flexibility with less bureaucratic control, quick in decision making, flexibility to market needs, informal strategies and greater responsiveness to changing environment. In short, this interesting and distinctive debate in the literature motivated the researcher to investigate why SMEs are less innovative by using knowledge based resources.
A number of researchers have divided resources into two broad categories i.e., tangible and intangible, which are heterogeneous in nature (Penrose, 1995; Dundas, 2006; Walker, 2010). These tangible (people, machinery, financial capital) and intangible (R&D, skills and process) resources perform productive tasks for the firm (Galunic and Rodan, 1998). These tangible and intangible resources significantly improve the firm’s innovation output. However, this study is mainly focused on role of intangible assets or knowledge based assets (KBA) for a number of reasons. First, KBA provides the firm’s sustained competitive advantage and second KBA positively influence the firm’s productivity (Harris, 2008). These KBA are defined as knowledge embodied in intellectual assets, such as R&D and proprietary know how, intellectual property, workforce skills, world class supply networks and brands (Harris, 2008). These KBA have a significant impact on the SMEs innovation performance (Zahra and George, 2002; Harris, 2008). In other words, this study has examined the relationship between KBA (i.e., R&D, networks, quality methods) and innovation output (product and process innovation, patent application and patent spending) by using a micro level data on Chilean SMEs.1
2.1. Research & Development (R&D)
From the perspective of input resources, one of the most common indicators used to measure firm innovation is R&D expenditure (Karlsson and Olsson, 1998). Consequently, innovative firms are strongly R&D oriented (Gatignon and Xuereb, 1997). Concerning R&D function, it performs two major functions: R&D generates new knowledge through product/process innovation and increases the firm absorptive capacity, and hence innovative performance (Cohen and Levinthal, 1989; Stamm and Wennberg, 2009). According to Cohen and Levinthal (1989), a firm must invest its own R&D in order to obtain benefits from output of its competitors. In support of Cohen and Levinthal’s (1989) argument about the two faces of
1
R&D, Kinoshita’s (2001) panel data analysis of Czech manufacturing firms found that the learning effect of R&D (absorptive capacity) is more important than the innovative effect of R&D in explaining the firms’ performance. Similar evidence is provided by Kinoshita’s (2001) empirical study which states that firms should engage in R&D for higher absorptive capacity and innovation performance.
Likewise, the study by Wang et al. (2014) on 279 Chinese firms investigated the impact of R&D strategies on firms’ performance using Structural Equation Model (SEM). R&D novelty (technological newness in product/process innovation) and R&D openness (external technology acquisition) has a significant impact on the firms’ innovation performance. On the one hand, a considerable internal R&D investment is required to generate radical product and process innovation. And on the other hand, greater technological acquisition from external sources (external R&D) positively contributes to the firms’ performance (Wang et al. 2014). This study suggests that firms’ can adopt balance R&D strategy related to the novelty and openness which may result in higher firms’ performance. Moreover, incurring R&D cost allows firms’ to enhance technology and minimizes the marginal cost of production (Peter et al. 2013). Further, Harris and Moffat (2012) study on UK firms identified that R&D not only support innovation but also increase the knowledge based asset through improving the absorptive capacity of the firms’. However, R&D is a risky adventure and it is not necessary that always R&D lead to successful innovation. Sometime for product and process innovation firms’ do not require formal R&D and can develop outside the firm (Harris and Moffat, 2012; Jong and Vermeulen, 2006).
Additionally, Peter et al. (2013) investigated the German SMEs from manufacturing and services sector. Their findings suggest that R&D positively contribute to the firms’ product and process innovation.2 Further this product and process innovation will raise the
productivity of SMEs in the long run. Mairesse and Mohnen (2005) examined the positive relationship between R&D and product/process innovation using Tobit regression analysis of 2253 French firms. Similarly, Ganotakis and Love (2011) conducted a study on 412 UK SMEs. They revealed that internal R&D has a strong and positive impact on the firms’ product innovation. Additionally, a number of empirical studies (Adam, 1982; Harris and
2
Product innovation is defined as new or significantly improved good/services and process innovation defined as new or significantly improved methods of production, logistics etc. For instance, the study of Podler et al.
Trainor, 1995) emphasized the role of R&D subsidies/grants to support innovation in SMEs. They argued that R&D grants from government agencies are more beneficial in increasing R&D spending and innovation output than R&D financing (through external sources), as it is difficult to obtain R&D finance due to its risky nature (e.g. R&D takes a long time to generate results). In other words, R&D grants/subsidies could alleviate underinvestment in firms’ innovation activities. Meuleman and Maeseneire (2012) conducted a study on 1107
Belgian SMEs. They found that R&D subsidy has positive impact on the SMEs innovation quality and access to long term debt. This indicates that government intervention through R&D subsidies may reduce the SMEs financial constraint because investment in R&D below optimal level is very expensive for the firms. More specifically, SMEs require government help in approving new products, granting patents and awarding subsidies and grants.
To sum up, SMEs that are engaged in R&D would likely to have higher innovation output than non-R&D SMEs. However, SMEs financial constraint suggests that R&D subsidies/grants could alleviate their underinvestment in innovation activities. Two hypotheses have been drawn from the above theoretical evidences which are as follows:
H1: A firms’ engaged in R&D has a positive impact on the firms’ product and process
innovations and applies for patents.
H2: Public support to innovation activities (e.g. R&D subsidies/grants) has a positive impact
on the firms’ product and process innovation and applies for patents.
2.2. Networks and Quality Methods
The lack of resources in SMEs is barrier to its innovation performance, but at the same time it is the main motive of SMEs to search beyond the organizational boundaries for required knowledge and technological ideas (Subrahmanya, 2012; Spithoven et al. 2013). Subrahmanya’s (2012) study on Indian SMEs suggests that SMEs with external support have better technological competence in the form of a large number of innovated products. In other words, networks allow firms’ to cope with rising demand for human and technological dependence on others and without network relations it is difficult for a firm’s to coordinate its diversified resources with heterogeneous economic agents i.e., competitors, customers, suppliers, public and private research institutions (Cantner et al. 2010; Gebreeyesus et al.
may encourage small firms to improve their innovation performance through such linkages with other firms and research institutions (Jong and Vermeulen, 2006). Staveren and Knorringa (2007) defined social networks (social capital) in a broader way as “social relations matter” and examined their impact on the economy. Their study measured firm social networks through inter-and intra-firm relationships, clusters, value chains, business association and business systems. They argued that the economic impacts of social relations
are to reduce the transaction cost, enabling collective action and improve learning through knowledge spillovers (Staveren and Knorringa, 2007). Similarly, Gebreeysus et al. (2013) conducted a study on 153 Ethiopian footwear micro enterprises. Their results revealed that firms with networks are more likely to engage in innovation activities (product/process innovation).
Firms can reduce their innovation cost and minimize the risk of innovation failure by using inter-firm networks and linkages with research organizations (Narula, 2004; Fukugama, 2006). In addition, Fukugama (2006) conducted a case study on Japanese small firms from cross industrial groups (i.e. manufacturing, services, wholesale, retail, finance and insurance) and analyse that the firm cooperative activities3 leads to innovation. Fukugawa suggested that network relationship based on shared knowledge among members would increase the absorptive capacity at network level (Fukugama, 2006). Similarly, Gronum et al. (2012) conducted a longitudinal study on 1435 Australian SMEs and investigated the relationship between networking (e.g., frequency of firm inter-intra interaction) and firms’ performance. They found that firm networking has a positive impact on its productivity and innovation performance. This suggests that network provides SMEs with more access to external sources such as complementary skills, knowledge, capabilities which are important factors for higher firms’ performance (Gronum et al. 2012). Further, Spithoven et al. (2013) investigated the open innovation practices in 967 Belgium SMEs. They found that SMEs linkages with
research organizations (R&D cooperation) significantly improve the innovation performance (product innovation). Moreover, their findings suggested that SMEs rely heavily on external sources of information along with the internal ones because cooperation broadens SMEs technical competencies (skilled workers).
3
In contrast, Chapman and Khawaldeh (2002) examined the link between total quality management (business improvement methods) and labour productivity for Jordanian manufacturing firms. They developed a conceptual framework which measured elements of total quality management: (i) employees participation; (ii) education and training; (iii) organisational communication; (iv) customer focus; (v) scientific approaches to decision making; (vi) scientific methods for quality control; (vii) organisational commitment to quality
and continuous improvement; (viii) statistical methods for quality control and; viii) unity of purpose. Using multiple regression analysis by Chapman and Khawaldeh (2002) stated that the elements of business improvement methods were shown to have a positive impact on firm labour productivity for high TQM firms. In addition, Harris et al. (2012) discuss the effects of business improvement methods on innovation in SMEs. Business improvement methods (BIM) include the following processes (or elements) such as ‘to focus customer needs’, ‘management involvement’, ‘continuous improvement’, and ‘employee involvement’ (Harris
et al. 2012). They suggest that business improvement methods improve the firm efficiency and innovativeness.4
Similarly, Hoang and Igel et al. (2010) and Koberg et al. (2012) emphasized the importance of total quality management practices (e.g, customer focus, employees’ involvement, education and training) for higher firm innovation performance. Their study5 suggested that TQM-practices large firms have higher quality implementation programs as compared to small firms due to their resource constraint. Concerning quality programs, the International Standard Organization (ISO) has certain criteria for quality management for use by small or large firms. The standard is based on several quality control principles such as customer focus, the motivation of leadership, process approaches and the involvement of people in the firm’s continuous improvement programs. For example, Malik et al. (2010) assert that ISO-certified SMEs are higher performer than non ISO ISO-certified SMEs. This apparently indicates
that quality improvement methods (customer focus, management commitment, employees’
4
Harris et al. (2012) conducted a study on 606 SMEs from Republic of Ireland, Northern Ireland, and West of Scotland. They used multinomial logit model to investigate the relationship between business improvement methods (BIM) and firm innovation (e.g., undertaking R&D). Further, Harris et al. (2012) classified firm responses into successful innovators (introduced a major product innovation in the last 3 years), unsuccessful innovators (engaged in innovation activities but had not introduced a major product innovation) and non- innovators (did not innovate or spend on innovation related capabilties).
5
involvement) have a positive impact on the firm’s performance. In short, literature on network and quality methods derived the next hypotheses as follows;
H3: SMEs networks with research institutions are more likely to introduce product and
process innovation and apply for patents.
H4: Firms’ with quality methods have positive association to the firms’ product and process
innovation and apply for patents.
.3. Methodology
This section first explains why Chilean firms have been selected for empirical analysis as research context. Second, it discusses the data sources and firms’ characteristics before informing about the operationlization of variables (factor analysis) and econometric models.
3.1. Chilean SMEs as Research Context
Chile is the first country in South America to have joined the OECD, in 2010. According to the World Bank, the country has the highest GDP per capita (approximately US$ 15000) in Latin America with lower inflation rate (3.2%) in the last 4 years. Chile’s major exports are copper, sea products, minerals, chemicals and agriculture goods. The government’s robust business-friendly policies welcomed the investment of foreign firms which resulted in a more competitive business environment. In Chile, more than 99% of all enterprises are SMEs and
nearly 57% of the workforce is employed in the business sector. Of these 99%, 77% are micro enterprises, 19% are small and 3% are medium sized firms. Alternatively, Chilean SMEs are the major source of employment in the country. There are a number of public support programs to support firms’ innovation activities. For instance, FONTEC (National Productivity & Technological Development Fund) and FONDEF (Science & Technology Development Fund) are specifically designed to encourage innovative business culture in the country. These two organizations provide subsidies (contribution up to 55% of total cost) in product/process innovation, R&D projects with universities and science & technology institutions. The main aim of such public support program is to improve SMEs innovation performance. Despite the public support programs, Chilean firms are facing many challenges to their innovation performance such as high cost of innovation, limited access to credit, low human capital and overall lack of innovative culture (Lussier and Halabi, 2008; Amoros et al.
performance. To fill that gap, this empirical study provides contribution to the existing knowledge.
3.2. Data Source
The data on Chilean firms has been obtained from the World Bank Enterprise Survey-2010. An enterprise survey is firm-level survey which is representative sample of a Chilean economy private sector. The survey covers a broad range of information related to the business environment such as innovation capacity, financial performance, infrastructure facilities and so forth. Usually Enterprise Survey carried out these micro level surveys in cooperation with business organizations and government agencies promoting job creation and economic growth, but confidentiality is strictly followed. Moreover, Enterprise Surveys used stratified random sampling methodology. In this method, all population units are grouped
within homogenous groups and simple random samples are selected within each group.
The manufacturing and services sectors are main business sectors of interest. The data comprises 1033 manufacturing firms formally registered. Of the total, approximately 78% of firms are from the manufacturing sector (food, textile, machinery and equipment) and only 22% from the services sector (retail, wholesale, hotel and restaurants). The majority of these firms (88%) are local based with only 12% having foreign ownership. In addition, the information was mainly collected from four regions of the country (Santiago, Antofagasta, Los Lagos and Valparaiso) using a structured questionnaire. Firms were predominantly interviewed in Santiago (68%), 8% in Antofagasta, 10% in Los Lagos and nearly 14% in Valparaiso. The survey asked detailed questions from the owner-managers related to firm size, age, sales, exports and their innovation activities such as product/process innovation, R&D, patents and networks. The average age of a firm is approximately 32 years. However, this data has certain limitations related to measuring innovation activities. For example, the data has not provided any information related to the patent citation (measure of quality), R&D employees, nature & types of linkages with other firms, science & technology institutions and with universities.
3.3. Dependent Variable
This empirical study has used four proxies of measuring the firms’ innovation performance such as i) patent application6, ii) patent spending7, iii) product innovation and, iv) process innovation. Patent applied is a more appropriate indicator than patents granted because usually the time interval is long between patent applied and granted which results in underestimation of measuring innovation performance (Ying, 2009). Similarly, product and process innovation are innovation output (see Podler et al. 2010).
3.4. Independent Variables
The literature examples suggest that firms’ with R&D, networks and quality standards are important innovation input variables. In addition, this paper has used exports as independent variable in the empirical analysis for the following reasons. First, in foreign markets, firms get access to the diversified knowledge, gain cross country income and acquire patents, which increase the likelihood of innovativeness of exporters (Bratti and Felice, 2012). Second, exporting firms broadens the international customer base, specifically when foreign markets are more competitive and innovative than the domestic ones (Lu and Beamish, 2006; Castellani, 2002). On the other hand, studies (e.g. Bratti and Felice, 2012; Anh et al. 2008; Harris and Li, 2009) examined the causal link between export and innovation performance using instrumental variable approach. However, this study does not focus on the causal link between export and innovation performance which is beyond the scope of this paper. Lastly, a number of studies (e.g. Harris and Trainor. 1995; Kim, 2000) stated that SMEs required greater R&D incentives (e.g. grants/subsidies) from government agencies to improve their firms’ performance. This paper expects the positive relationship between public support for innovation and innovation output.
3.5. Descriptive Analysis
Table 1 provides information on the firms’ characteristics. Of the 771 firms, approximately 43% firms are engaged in R&D. Similarly, a significant proportion (57.6%, 50%) of firms introduced product and process innovation in the last 3 years.8 This suggests that firms that
6
Firm apply or file for any patent, trademark, industrial design or copy right registration with its products and process innovation.
7
Patent spending is defined as spending on purchases of licenses to use intellectual property such as patent, trademark, industrial design copy rights or specialized consultancy services.
8
are engaged in R&D are more likely to introduce innovation output. Size of the firm is measured by creating four dummy variables (size-1 to size-4) to analyze the innovation performance of micro, small, medium and large firms. It is observed that most of the firms (56%) are small size (11-100 employees) in our sample with a low percentage (nearly 14%) of large firms. In comparison, a low percentage (23%) of firms applied for patent registration in the last 3 years. Likewise, a low proportion of firms (31%) are spending on patent
[image:13.595.71.527.330.529.2]registration of their products and services (See Table 1). Further, these firms have a low level (nearly 14%) of public support (assuming FONTEC and FONDEF) related to their innovation activities and with weak networks with other firms and science & technology (S&T) institutions. Only 38% of firms are ISO (International Standard Organization) certified which means that firms are pursuing total quality standards.
Table 1: Firms characteristics (figures are in percentages)
Variables N Yes No
Dependent Variables
Patent Applied 768 22.92 77.08
Patent Spending 767 31.42 68.58
Product Innovation 775 57.68 42.32
Process Innovation 774 49.74 50.26
Independent Variables
Firm Undertaking R&D 771 42.67 57.33
Size-1 (1-10) employees (Micro) 1033 13.94 86.06
Size-2 (11-100) employees (Small) 1033 55.95 44.04
Size-3 (101-250) employees (Medium) 1033 16.17 83.83
Size-4 >250 employees (Large) 1033 13.94 86.04
Public Support (Innovation) 775 13.81 86.19
ISO-Quality Standards 1028 38.42 61.58
Networks (Inter-firm, S&T) 770 24.03 75.97
Source: Author own calculation
Table 2: Innovation activities region wise (figures are presented row wise in percentages)
R&D Undertaking Patent(s) Applied
Regions n=771 Yes No Total n=768 Yes No Total
Santiago 542 42.25 57.75 100 540 22.92 77.08 100
Antofagasta 50 42.00 58.00 100 50 12.00 88.00 100
Los Lagos 77 37.95 48.05 100 75 29.33 70.67 100
Valparaiso 102 38.24 61.76 100 102 23.53 76.47 100
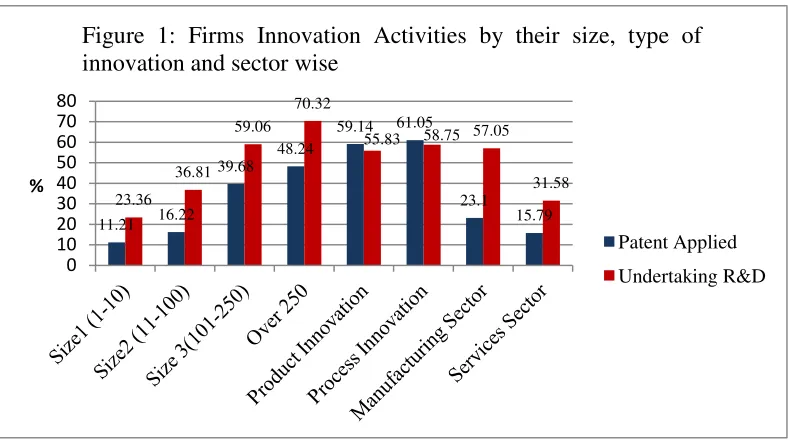
Figure 1: shows the firms’ innovation activities (R&D, Patents) distributed by their respective size, type of innovation and sector wise R&D and patent application. The figure clearly indicates that large firms (over 250 employees) are more engaged in R&D and applied for more patent registrations compared to other size bands (size1 to size 3). However, the product and process innovation shows almost similar trend for undertaking R&D and patent applications. This apparently suggests that firms with product and process innovation have
significant association to patents and R&D.
Source: Author own calculation
In addition, in manufacturing sector the R&D proportion (57%) is higher than the services sector. While 23% manufacturing firms applied for patent compared to nearly 16% in the
services sector.
4. Estimation Analysis
Table 3 provides information on the definitions of variables and their means and standard deviations. Firms’ financial information (export sales, innovative product sales) has been
11.21 16.22
39.68 48.24
59.14 61.05
23.1 15.79 23.36
36.81 59.06
70.32
55.83 58.75 57.05
31.58
0 10 20 30 40 50 60 70 80
[image:14.595.75.471.348.568.2]%
Figure 1: Firms Innovation Activities by their size, type of innovation and sector wise
Patent Applied
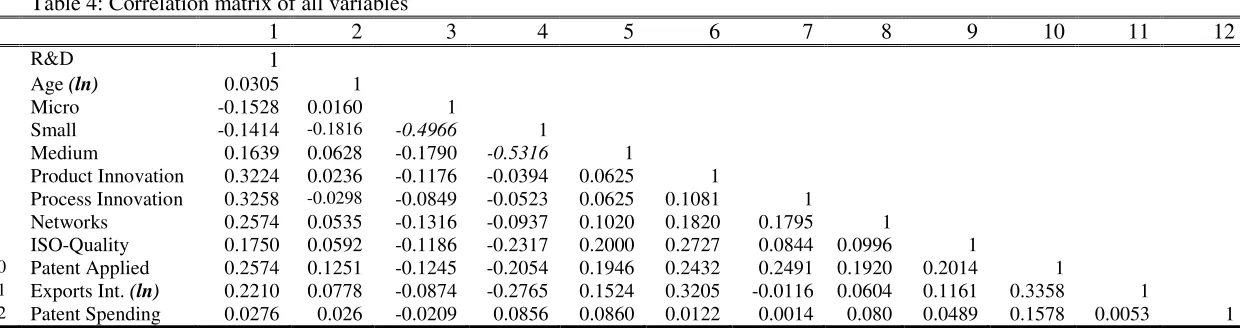
converted into single international currency (US$). The average exchange rate has been calculated i.e., US$ 1 = 559.6126 (Chilean Peso) in the year 2009. Before estimation, correlation matrix is used to investigate the multi-collinearity problem (see Table 4). Overall, most of the correlation values are lower than 0.5. This indicates that multi-collinearity is not a problem.
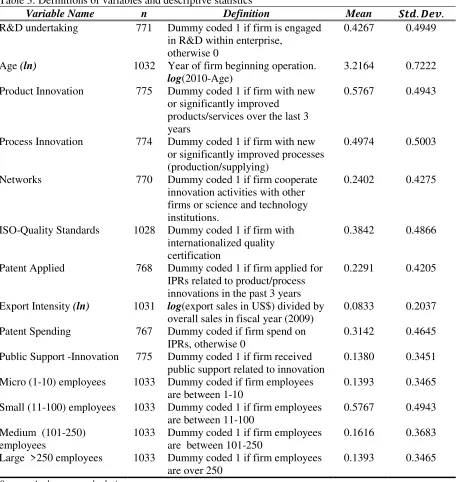
Table 3: Definitions of variables and descriptive statistics
Variable Name n Definition Mean . .
R&D undertaking 771 Dummy coded 1 if firm is engaged in R&D within enterprise,
otherwise 0
0.4267 0.4949
Age (ln) 1032 Year of firm beginning operation.
log(2010-Age)
3.2164 0.7222
Product Innovation 775 Dummy coded 1 if firm with new or significantly improved
products/services over the last 3 years
0.5767 0.4943
Process Innovation 774 Dummy coded 1 if firm with new or significantly improved processes (production/supplying)
0.4974 0.5003
Networks 770 Dummy coded 1 if firm cooperate
innovation activities with other firms or science and technology institutions.
0.2402 0.4275
ISO-Quality Standards 1028 Dummy coded 1 if firm with internationalized quality certification
0.3842 0.4866
Patent Applied 768 Dummy coded 1 if firm applied for IPRs related to product/process innovations in the past 3 years
0.2291 0.4205
Export Intensity (ln) 1031 log(export sales in US$) divided by overall sales in fiscal year (2009)
0.0833 0.2037
Patent Spending 767 Dummy coded if firm spend on IPRs, otherwise 0
0.3142 0.4645
Public Support -Innovation 775 Dummy coded 1 if firm received public support related to innovation
0.1380 0.3451
Micro (1-10) employees 1033 Dummy coded if firm employees are between 1-10
0.1393 0.3465
Small (11-100) employees 1033 Dummy coded 1 if firm employees are between 11-100
0.5767 0.4943
Medium (101-250) employees
1033 Dummy coded 1 if firm employees are between 101-250
0.1616 0.3683
Large >250 employees 1033 Dummy coded 1 if firm employees are over 250
0.1393 0.3465
Table 4: Correlation matrix of all variables
1 2 3 4 5 6 7 8 9 10 11 12
1 R&D 1
2 Age (ln) 0.0305 1
3 Micro -0.1528 0.0160 1
4 Small -0.1414 -0.1816 -0.4966 1
5 Medium 0.1639 0.0628 -0.1790 -0.5316 1
6 Product Innovation 0.3224 0.0236 -0.1176 -0.0394 0.0625 1
7 Process Innovation 0.3258 -0.0298 -0.0849 -0.0523 0.0625 0.1081 1
8 Networks 0.2574 0.0535 -0.1316 -0.0937 0.1020 0.1820 0.1795 1
9 ISO-Quality 0.1750 0.0592 -0.1186 -0.2317 0.2000 0.2727 0.0844 0.0996 1
10 Patent Applied 0.2574 0.1251 -0.1245 -0.2054 0.1946 0.2432 0.2491 0.1920 0.2014 1
11 Exports Int. (ln) 0.2210 0.0778 -0.0874 -0.2765 0.1524 0.3205 -0.0116 0.0604 0.1161 0.3358 1
12 Patent Spending 0.0276 0.026 -0.0209 0.0856 0.0860 0.0122 0.0014 0.080 0.0489 0.1578 0.0053 1
4.1. Econometric Models (a). Bivariate Probit Models
The bivariate probit model is used for estimation analysis. This estimation method removes the sample selection bias and also presents more accurate parameters through the inclusion of non-innovative firms (Chun and Mun, 2012). For instance, Heckman suggested Heckit-procedure for continuous dependent variables. However, in this case the dependent variables are discrete and the use of Inverse Mills Ratio (IMR) is not an appropriate choice. This study has used bivariate probit model to correct the sample selection bias. Further, the correlation . ., = 0.4021 between two dependent discrete variables (patent applied
and patent spending) is statistically significant. This indicates that a separate probit model is
not a good option for the estimation (Neito and Santamaria, 2010). Bivariate models provide two binary results. Mathematically the two outcomes are determined by the two unobserved latent variables (Cameron and Trivedi, 2009),
∗ = + (a)
∗ = + (b)
Both errors ( , ) are jointly normally distributed with mean of 0 and variance of 1. is a vector of explanatory variables common to both outcomes with estimators, β. It is expected to observe the two binary outcomes;
= 10
! ! "#∗$%
"#∗&%
' and
= 10
! ! "(
∗$%
"(∗&%
'
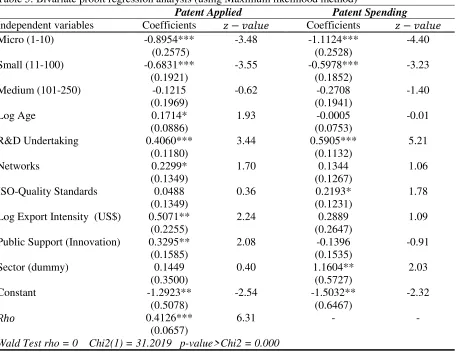
Table 5 reports the results of bivariate probit model. Two indicators of firms’ innovation performance (patent application and patent spending) are used in the bivariate analysis.
Concerning the firms’ size, three size dummy variables are named as micro, small and medium enterprises. This strategy allows us to investigate the impact of SMEs on innovation
performance more appropriately. Further, an additional dummy variable is introduced for sector i.e., 1= manufacturing sector, 0= services for sector. A result for manufacturing sector is related to the services sector, which is our reference category. Further, the models used robust standard errors method to eliminate the heteroskedasticity.
that Chilean SMEs have found patents to be expensive in terms of money, time and efforts and their incremental innovation satisfy the customer demands and it is not worth patenting. Alternatively, this finding is in line with Schumpeterian hypothesis which suggest that large firms are more innovative than small firms. Previous studies of Ying (2009); Belitz and Legpas (2014) and Rangone (1999) investigated that SMEs are less innovative due to their resource constraint (financial and non-financial). Similarly, the negative relationship is
stronger between micro size firms and patent spending. This indicates that Chilean SMEs are less likely to spend on patenting their products and services. There are two possible outcomes of this relationship; first, perhaps patent spending is not worth for SMEs because of incremental innovation (largely confined to changing product design/shape), second due to financial barriers Chilean SMEs are reluctant to apply or spend on patenting their products and services. In addition, the positive coefficient of age with patent applied indicates that older firms are more experience and competitive and likely to have higher innovation performance than younger firms.
The positive association between undertaking R&D and patent applied shows that 1% increase in R&D would likely to increase the patent application by 40%. Similarly, this relationship is stronger between undertaking R&D and patent spending (see Table 5). Moreover, undertaking R&D positively influence the firm’s product and process innovation (see Table 6). Overall, this outcome has supported the first hypothesis and confirms the previous findings of Peter et al. (2013); Stamm and Wennberg (2009); Peter et al. (2013) and Mairesse and Mohnen (2005). This suggests that firms’ undertaking R&D significantly improves the firms’ innovation output in terms of taking out patent applications and/or product/process innovations. Networks with other firms’ and research institutions presented positive impact on the patent application. The coefficient value of network tells that collaboration with other firms and research institutions increases the probability of SMEs
The coefficient value of exports which is 0.5071 shows that 1% increase in exports the probability of patent application is rise by 50%. This positive relationship shows that exports significantly improve the firms’ innovation performance because exports provide firms more innovative opportunities to compete in the international markets. Any public support (tax incentive or subsidies) related to firm’s innovation activities have positive and significant impact on the firm’s patent application (See Table 5). Lastly, the sector dummy variable (i.e.,
[image:19.595.74.530.354.706.2]services sector) showed positive association to firm’s patent spending. This apparently indicates that firms in the services sector are more likely to be naturally flexible and spends on patent registration. The value of rho is estimated at 0.41. It is positive signed and statistically significant different from zero in a Wald test, indicating that the two outcomes are related and some unobserved factors (e.g., university-linkages, external R&D, patent citation) are positively related to both dependent variables.
Table 5: Bivariate probit regression analysis (using Maximum likelihood method)
Patent Applied Patent Spending
Independent variables Coefficients ) − Coefficients ) −
Micro (1-10) -0.8954***
(0.2575)
-3.48 -1.1124***
(0.2528)
-4.40
Small (11-100) -0.6831***
(0.1921)
-3.55 -0.5978***
(0.1852)
-3.23
Medium (101-250) -0.1215
(0.1969)
-0.62 -0.2708
(0.1941)
-1.40
Log Age 0.1714*
(0.0886)
1.93 -0.0005
(0.0753)
-0.01
R&D Undertaking 0.4060*** (0.1180)
3.44 0.5905***
(0.1132)
5.21
Networks 0.2299*
(0.1349)
1.70 0.1344
(0.1267)
1.06
ISO-Quality Standards 0.0488 (0.1349)
0.36 0.2193*
(0.1231)
1.78
Log Export Intensity (US$) 0.5071** (0.2255)
2.24 0.2889
(0.2647)
1.09
Public Support (Innovation) 0.3295** (0.1585)
2.08 -0.1396
(0.1535)
-0.91
Sector (dummy) 0.1449
(0.3500)
0.40 1.1604**
(0.5727)
2.03
Constant -1.2923**
(0.5078)
-2.54 -1.5032**
(0.6467)
-2.32
Rho 0.4126***
(0.0657)
6.31 - -
Wald Test rho = 0 Chi2(1) = 31.2019 p-value>Chi2 = 0.000
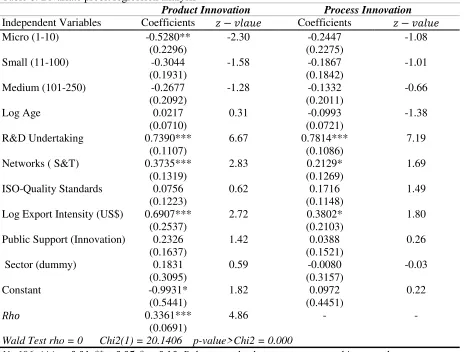
Table 6 provide information on the determinants (e.g., R&D, networks and quality) of product and process innovation. The coefficient of micro firms’ shows negative association to product innovation. This outcome is in line with the previous finding in Table 5. This result indicates that the probability of micro firms is lower to introduce product innovation. This finding suggests that micro firms have low innovation activities. However, the parameters of other size groups present no statistical association with product and process innovations.
Overall, the negatively signed coefficients of firms’ size (SMEs) imply that Chilean SMEs are less innovative due to resource constraint.
Table 6: Bivariate probit regression analysis
Product Innovation Process Innovation
Independent Variables Coefficients ) − Coefficients ) −
Micro (1-10) -0.5280**
(0.2296)
-2.30 -0.2447
(0.2275)
-1.08
Small (11-100) -0.3044
(0.1931)
-1.58 -0.1867
(0.1842)
-1.01
Medium (101-250) -0.2677
(0.2092)
-1.28 -0.1332
(0.2011)
-0.66
Log Age 0.0217
(0.0710)
0.31 -0.0993
(0.0721)
-1.38
R&D Undertaking 0.7390*** (0.1107)
6.67 0.7814***
(0.1086)
7.19
Networks ( S&T) 0.3735*** (0.1319)
2.83 0.2129*
(0.1269)
1.69
ISO-Quality Standards 0.0756 (0.1223)
0.62 0.1716
(0.1148)
1.49
Log Export Intensity (US$) 0.6907*** (0.2537)
2.72 0.3802*
(0.2103)
1.80
Public Support (Innovation) 0.2326 (0.1637)
1.42 0.0388
(0.1521)
0.26
Sector (dummy) 0.1831
(0.3095)
0.59 -0.0080
(0.3157)
-0.03
Constant -0.9931*
(0.5441)
1.82 0.0972
(0.4451)
0.22
Rho 0.3361***
(0.0691)
4.86 - -
Wald Test rho = 0 Chi2(1) = 20.1406 p-value>Chi2 = 0.000
N=696. *** p<0.01, **p<0.05, * p<0.10. Robust standard errors are reported in parentheses.
5. Conclusion
Concerning the contribution of this paper, to the best of my knowledge hardly any micro level study is available on the analysis of Chilean SMEs innovation performance. This empirical study provides contribution to the existing knowledge. Moreover, there is scarcity of empirical studies which investigates the innovation performance using multiple dependent variables (patent application, patent spending and product/process innovation). This study would fill that gap within the country specific characteristics.
In spite of the positive relationship between networks and innovation performance, Chilean firms’ still have weak linkages with other firms and research institutions. They require strong linkages with research universities for joint R&D projects. Policy makers shall encourage firms’ network relations. Similarly, it is investigated that only a few percent of firms are receiving public support for innovation activities. This implies that policy makers shall revisit the innovation policy to ensure that firms can maximize benefits from such public support programs. In other words, complicated and bureaucratic procedures for applying to such programs must be minimized without discrimination of firm size. Lastly, this study has certain limitations such as non availability of information on patent citations, type of linkages and specifically what type of innovation support programs firms have received. Having information on these variables may provide more appropriate ways to investigate their innovation performance. This study has not addressed the causality between exporting and innovation. It could be analysed in the future.
6. References
Adams, Adam (1982). Barriers to Product Innovation in Small Firms: Policy Implication, International Small Business Journal, 1, 67-87.
Alvarez, Roberto; Crespi, Gustavo.,(2012). Public Programs, Innovations and Firm Performance in Chile, Working Paper, IDB-IN-375, 1-43.
Amoros, E.Jose; Romani; Atienza (2008). Formal and Informal Equity Funding in Chile, Estudios de Economia, 35, 2, 179-194.
Anh, Ngoc; Chuc., (2008). Innovation and Export of Vietnam’s SMEs sector, European Journal of Development Research, 2, 262-280.
Aquilina, M. Rainer, K. and Pietrobelli C. (2006). Factors substitution, average firm size and economic growth, Small and Business Growth, 26, 230-214.
Beck T., Demirguc-Kunt, A. and Levine, R. (2005). SMEs, Growth and Poverty: Cross country evidence, Journal of Economic Growth, 10, 3, 199-229.
Belitz, Heike; Lejpras.,(2014). Financing Patterns of Innovative SMEs and the Perception of Innovation, Discussion Paper, 1353, 1-26.
Bjerk, Lina; Johansson, Sara (2014). Innovation and Firm Collaboration-An Exploration of Survey Data, Working Paper 383, CESIS, 1-24.
Bratti, Massimiliano; Felice, Giulia (2012). Are Exporters Are More Likely to Introduce Product Innovations? The World Economy, 35, 11, 1559-1598.
Cameron, A. Colin; Trivedi, K. Pravin (2009). Microeconometrics Using Stata, Stata Press Publication, Texas, 515-516.
Cantner, Uwe; Conti, Elisa; Meder, A. (2010). Networks and Innovation: The Role of Social Assets in Exploring Firms Innovative Capacity, European Planning Studies, 18, 12, 1937-1956.
Castellani, D. (2002). Export Behaviour and Productivity Growth: Evidence from Italian Manufacturing Firms, Journal of Weltwirtschaftliches Archive’, 138, 4, 605-628.
Chapman, R. and Al-Khawaldeh K. (2002). TQM and labour productivity in Jordanian industrial companies, The TQM Magazine, 14, 4, 248-262.
Chun, Hynbae; Mun, Sung-Bae (2012). Determinants of Cooperation in Small and Medium Enterprises, Small Business Economics, 39, 419-436.
Cohen, W, M, Levinthal D, A (1990). Absorptive Capacity: A New Perspective on Learning and Innovation, Administrative Science Quarterly, 35, 1, 128-152.
Cohen, W, M, Levinthal D, A (1989). Innovation and learning: the two faces of R&D, The Economic Journal, 99, 397, 569-596.
Drnovsek, M. (2004). Job Creation Process in Transition Economy, Journal of Business Economics, 23, 3, 179-188.
Dundas-Hewitt, N. (2006). Resources and Capability Constraints to Innovation in Small and Large Plants, Small Business Economics, 26, 3, 257-277.
Fabrizio, R. K. (2009). Absorptive capacity and search for innovation, Research Policy 38, 2, 255-267.
Fosfuri, A. and Tribo A. J. (2008). Exploring the antecedents of potential absorptive capacity and its impact on innovation performance, The International Journal of Management Science, 36, 2, 187-187.
Fukugama, Nobuya (2006). Determining Factors in Innovation of Small Firm Networks: A Case of Cross Industry Groups in Japan, Small Business Economics, 27, 181-193.
Ganotakis, Panagiotis; Love H. James (2011). R&D, Product Innovation and Exporting: Evidence from UK New Technology Based Firms, Oxford Economics Papers, 63,2, 279-306.
Gatignon, H. and Xuereb-Marc J. (1997). Strategic Orientation of the Firm and New Product Performance, Journal of Marketing Research, 34, 1, 77-90.
Galunic C., D. and Rodan, S. (1998). Resource Recombination in the firm: knowledge structures and the Potential for Schumpeterian Innovation, Strategic Management Journal 19, 12, 1193-1201.
Gebreeyesus, Mulu; Mohenen.,(2013). Innovation Performance and Embeddness in Networks: Evidence from the Ethiopean Footwear Cluster, World Development, 41, 302-316.
Ghoneim, F, A. (2003). Intellectual property in Arab Countries: SMEs as Copyright Owners and/or Copyright users, Centre for International Private Enterprise, 1-11.
Gronum, S., Verreyne, L., Kastelle, J. (2012). The Role of Networks in Small and Medium-Sized Enterprise and Firm Performance, Journal of Small Business Management, 50, 2, 257-282.
Hagedoorn, John; Cloodt, Myriam (2003). Measuring Innovative Performance: Is There an Advantage In Using Multiple Indicators? Research Policy, 32, 1365-1379.
Harris, R. (2008). Models of Regional Growth: Past, Present and Future, CPPR, SERC & University of Glasgow,Glasgow, 1-55.
Harris, R. McAdam, R. and Reid, R. (2012). The Effect of Business Improvement Methods on Innovation in SMEs’, Discussion Paper, Glasgow, 1-11.
Harris, R. and Trainor, M. (1995). Innovation and R&D in Northern Ireland Manufacturing, A Schumpeterian approach, Journal of Regional Studies, 27, 7, 593-604.
Harris, R. and Li, Q., C (2009). Exporting, R&D, and Absorptive Capacity in UK establishments’, Oxford Economic Papers, 61, 1, 74-103.
Harris, I.D. Richard; Moffat, John (2012). R&D, Innovation & Exporting in Britain: Empirical Analysis, Working Paper, Glasgow, 28, 1-43.
Harris, I.D. R. and Reid, R. (2010). The role of knowledge in Lowering Barriers to Internationalisation, Conference paper, Glasgow, 1-33.
Hoang, T. D., Igel, B. Laosirihongthong, T. (2010). Total Quality Management (TQM) Strategy and Organizational Characteristics: Evidence from recent WTO member, Total Quality Management, 21, 9, 931-951.
Jong De, Jeroen; Vermeulen, M, Patrick (2006). Determinants of Product Innovation, International Small Business Journal, 24, 6, 587-609.
Karlsson, Charlie and Olsson (1998). Product Innovation in Small and Large Enterprises, Small Business Economics, 10, 31-46.
Kinoshita, Y. (2001). R&D and Technology spillovers through FDI: Innovation and Absorptive Capacity, International Trade and Transition Economics, Discussion Paper, 2775, 1-24.
Katila, Riitta, (2000). Measuring Firm Innovation Performance, Journal of Business Performance Measurement, 2, 180-193.
Katila, R. and Shane, S. (2005). When Does Lack of Resources Make New Firms Innovative? Academy of Management Journal, 48, 5, 814-829.
Kim, R. P (2000). R&D and Firm Size in the Information and Telecommunications Industry of Korea, Small Business Economics, 15, 3, 183-192.
Koberg, Ralph; Watson, John (2012). The Impact of Total Quality Management Adoption on Small & Enterprises Financial Performance, Accounting and Finance, 52, 421-438.
Knight A. G. and Cavusgil, S. T. (2004). Innovation, organizational capabilities and the born global firm, Journal of International Business Studies, 35, 124-141.
Meuleman, Miguel; Maeseneire (2012). Do R&D Subsidy Affect SMEs Access to External Finance, Research Policy, 41, 3, 580-590.
Moktan, S. (2007). Development of Small and Medium Enterprises in Bhutan: Analyzing Constraints to Growth, Journal of South Asian Survey, 14, 2, 251-282.
Lane, J. Peter and Lubatkin, M. (1998). Relative Absorptive Capacity and Interorganizational Learning, Journal of Strategic Management, 19, 461-477.
Lu, W. J. and Beamish W. P. (2006). SME internationalization and performance: Growth vs. profitability’, Journal of International Entrepreneurship 4, 1, 27-48.
Lumpkin G, T. and Dess G. G. (1996). Clarifying the Entrepreneurial Orientation Construct and Linking IT to Performance, Academy of Management Review, 21, 1, 135-172.
Lussier, N. Robert; Halabi, E. Claudia (2008). An Analysis of Small Business in Chile: A Correlational Study, Journal of Small and Enterprise Development, 15, 3, 490-503.
Mairesse, Jacques; Mohnen, Pierre (2005). The Importance of R&D for Innovation: A Reassessment using French Survey Data, Journal of Technology Transfer, 30, 1, 183-197.
Musolesi, Antonio; Huiban-Piere; (2010). Innovation and Productivity in Knowledge Intensive Business Services, Journal of Productivity Analysis, 34, 63-81.
Narula, Ranjeesh (2004). R&D Collaboration by SMEs: A New Opportunities and Limitations in the Face of Globalization, Technovation, 1-17.
Neito, Maria; Santamaria,(2010). Technological Collaboration: Bridging the Innovative gap between Small & Large Firms; Journal of Small Business Management, 48, 1, 44-69.
Ortiz, Arias, Elena; Crespi, Gustavo.,(2013). Innovation for Economic Performance: The Case of Latin American Firms, Working Paper, 028, 1-33.
Penrose, E. (1995), ‘The Theory of the Growth of the Firm’, 3rd Edition, New York, Oxford University Press, 35-50.
Peter, Bettina; Roberts J, Mark; Vuong, Anh, Van; Fryges, H (2013). Firm R&D, Innovation and Productivity in German Industry, Conference Paper, Germany, 1-35.
Podler, Michael; Leeuwen, George.,(2010). Product, Process and Organizational Innovation: Drivers, Complementarity and Productivity Effects, Working Paper, 28, 1-42.
Radas, S. and Bozic, L. (2009). The antecedents of SMEs innovativeness in an emerging Transition economies, Technovation, 29, 6-7, 438-450.
Rangone, A. (1999). A Resource based View Approach to strategy Analysis in Small and Medium Sized Enterprises, Journal of Small Business Economics, 12, 3, 233-248.
Saleh, S. Ali and Ndubisi, O. N. (2006), ‘An Evaluation of SME Development in Malaysia’, International Review of Business Research Papers, 2, 1, 1-14.
Smallbone, D. Welter F. I., Nina, Slonimski, A. (2001).The contribution of small and medium enterprise to Economic development in Ukraine and Belarus: Some policy perspectives, Small Business Economics, 11, 3, 253-273.
Spithoven, Andre; Vanhaverbeke, Wim; Roijakkers, Nadine (2013). Open Innovation Practices in SMEs and Large Enterprises, Small Business Economics, 1-27.
Stam, E. and Wennberg, K. (2009). The role of R&D in new firm growth, Small Business Economics, 33, 1, 77-89.
Staveren, van, I. and Knorringa, P. (2007). Unpacking Social Capital in Economic Development: How social relations matter, Review of Social Economy LXV, 1, 107-135.
Subramanya, M.H.Bala (2012). Technological Innovation in Indian SMEs: Need, Status and Policy Imperatives, Current Opinion in Creativity, Innovation and Entrepreneurship, 1, 2, 1-6.
Teiklinck Peter, Spithoven Andre (2013). Research Collaboration & R&D outsourcing: Different R&D personnel Requirements in SMEs, Techonovation, 33, 142-153.
Wagner, J. (2007). Exports and Productivity: A survey of the evidence from firm level data’, Working paper, 5580, 60-82.
Walker, P. (2010). The (Non) Theory of the Knowledge Firm , Scottish Journal of Political Economy, 57, 1, 1-32.
Wang, Fangui; Chen.,(2014). The Effect of R&D Novelty and Openness Decision on Firm’s Catch Up Performance: Empirical Evidence from China, Technovation, 34, 21-30.
Wooldridge M. Jeffrey (2003), ‘Multiple regression analysis’ In J. Wooldridge (ed.) Introductory Econometrics, A Modern Approach, 2nd Edition, USA, Thomson, South-Western, 68.
Wong, Kam, Poh; Lee, Lena.,(2008). Occupational Choice: The Influence of Product vs. Process Innovation, Small Business Economics, 30, 267-281.
Ying-J, Lin (2009). Firm Size and Innovation Performance: An Empirical Study from Chinese Photoelectric Industry, Innovation Management Industrial Engineering,1-5.
Zahra, A., George, G. (2002). Absorptive Capacity: A review, Reconceptualisation, and Extension’, The Academy of Management Review, 27, 2, 185-203.