Study of Interaction between Au and TiO
2(110) at Low Coverage
Kazuyuki Okazaki-Maeda
1, Yasushi Maeda
2, Yoshitada Morikawa
3,
Shingo Tanaka
1and Masanori Kohyama
11
Research Institute for Ubiquitous Energy Devices, National Institute of Advanced Industrial Science and Technology, Ikeda 563-8577, Japan
2Research Institute for Innovation in Sustainable Chemistry, National Institute of Advanced
Industrial Science and Technology, Tsukuba 305-8569, Japan
3Institute of Scientific and Industrial Research, Osaka University, Ibaraki 567-0047, Japan
We have investigated the interaction between Au and a rutile TiO2(110) surface at low coverage, using density functional theory. We have examined Au adsorption on three types of TiO2(110) surface with different stoichiometry and structures; the stoichiometric surface, the surface formed by removing bridging-oxygen (defected surface), and the reconstructed12surface with Ti2O3rows (added-row surface). For the stoichiometric surface, the most stable site for the Au adsorption is the on-top site above the bridging-oxygen atom. Electrons transfer from the Au adatom to the bridging-oxygen atom after adsorption. For the defected surface, the most stable adsorption site is the bridging-oxygen vacant site. For the added-row surface, the most stable adsorption site is the neighborhood of the Ti2O3rows. For both the reduced surface, defected and added-row surfaces, electron densities between the Au and the reduced Ti atom increase after adsorption, and it seems that the Au atom covalently interacts with the reduced Ti atoms at the surface. Moreover, we compared the simulated scanning tunneling microscopy (STM) images with the experimental STM images for the added-row surface. The calculated STM images of Au adatom adsorbed near Ti2O3rows agree with experimental images qualitatively. [doi:10.2320/matertrans.47.2663]
(Received May 23, 2006; Accepted July 10, 2006; Published November 15, 2006)
Keywords: gold, titanium dioxide, density functional calculations, pseudopotential method, scanning tunneling microscopy
1. Introduction
Gold does not reveal catalytic activity for hydrogenation or oxidation generally.1)Harutaet al., however, have found that nano-size particles of gold deposited on the oxide supports such as TiO2 have strong catalytic activity.2) For
example, oxidation of CO occurs at room temperature when an average diameter of Au particles supported on TiO2 is
smaller than about 5 nm.3,4) The catalytic activity of the Au
particles on TiO2 strongly depends on the size and structure
of the Au particles.5–8)Therefore, it is necessary to control the
size and shape of Au particles on the oxide supports in order to make catalysts with higher activity. For this purpose, it is important to investigate the interaction between a Au atom and a TiO2supports at the initial stage of the nucleation of a
Au particle.
There are a lot of studies about the interfacial interaction between Au and TiO2.9–13)All the studies have reported that
the interaction of Au with the stoichiometric TiO2surface is
very weak and that with the oxygen vacancy at TiO2surface
is strong. Lopez and Nørskov investigated the size depend-ence of the interaction between Au and TiO2(110) usingab
initio pseudopotential calculations based on the density functional theory (DFT).14) They have found that the
interaction between Au and TiO2(110) become more weak
as increasing the coverage of Au. However, the detailed study about initial stage of the growth of a Au particles is small. Wahlstro¨m et al. have investigated the interaction of Au nano-particles with the bridging-oxygen vacancies on the (110) 11 surface through an interplay between scanning tunneling microscopy (STM) observations and the DFT calculations.15)They reported that the nucleation and growth of Au clusters on the TiO2(110) surface is strongly related to
the presence of surface oxygen vacancies; a single Au
atom-vacancy complex is stable and a single oxygen atom-vacancy can bind three Au atoms on average. Recently, Okazawa et al. investigated the growth mode of Au nano-particles on TiO2
using reflection high-energy electron diffraction, a field-emission type scanning electron microscopy and medium energy ion scattering.16)
For the reduced TiO2(110) surface, a12reconstruction
occurs after annealing in vacuum.17,18)It was found that the
reconstructed surface has the added Ti2O3 rows by STM
observation,17) by non-contact atomic force microscopy
observation,19)and by first-principles calculations.20,21)The
studies of the interaction of Au with the12TiO2supports
are only few. The formation and growth of Au nano-particles were studied by STM on the TiO2(110) reconstructed12
surface22)and the local barrier height was measured on the TiO2(110) 12 surface with and without Au deposition
using STM.23)However, there is no theoretical studies about the interaction of Au clusters with the 12 TiO2 surface.
Therefore, we examined the Au adsorption on the three types of the rutile TiO2(110) surface; the stoichiometric surface,
the surface formed by removing one bridging-oxygen atom per22unit cell (defected surface), and the reconstructed
12surface with Ti2O3 rows (added-row surface).
2. Method of Calculations
All the calculations are carried out using the program package STATE (Simulation Tool for Atom TEchnology), which has been successfully applied for various systems including TiO2(110),24) Au(111) surfaces,25,26) and Au/
TiO2(110) system with coverage of 1/3 ML.13)We adopted
the generalized gradient approximation (GGA) in the
DFT27,28) with the Perdew-Burke-Ernzerhof formula29) as
the exchange-correlation energy functional. We constructed
pseudopotentials of O2p, Ti3pand3d, and Au5dstates by Vanderbilt’s ultra-soft scheme,30) while other components
of pseudopotentials by the norm-conserving scheme.31)
Two projectors are used for ultra-soft pseudopotentials. All pseudopotentials are generated from scalar relativistic32)
all-electron atomic calculations to including relativistic effect. The cutoff energy of the wave function is 25 Ry and that of the augmentation charge is 225 Ry. The equilibrium config-urations were determined with a criterion that required the force on each atom to be less than1103 hartree/a.u.
A repeated slab model with three layers, where one layer was defined as the O-Ti2O2-O structural plane, and the22
surface unit cell was used to simulated the TiO2(110) surface.
Each slab was separated by a vacuum region of about 19.8 A˚ . We deal with three kinds of surface structure; the perfect stoichiometric surface, the surface formed by removing one bridging-oxygen atom per22unit cell (defected surface), and the reconstructed12surface with Ti2O3rows
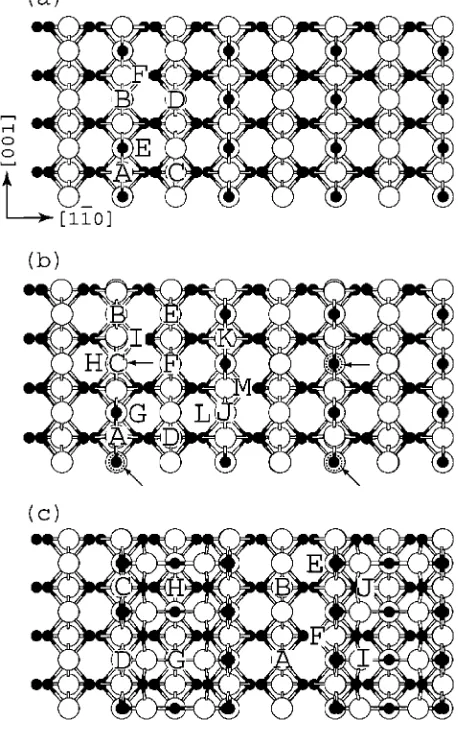
(added-row surface). These structures are shown in Fig. 1. Au adatoms are introduced on one side of each slab. In this case, the coverage of Au is 1/12 ML. For structural optimization, adatoms and the substrate layers expects the bottom one layer are allowed to relax. As shown in Fig. 1, we examined six possible adsorption sites (A-F) for the stoichiometric surface, thirteen possible adsorption sites (A-M) for defected surface, and ten possible sites (A-J) for the added-row surface.
3. Results
[image:2.595.313.542.79.444.2]3.1 Stable configurations
Table 1 lists the adsorption energies. The adsorption energyEadis defined by
Ead¼EAuþETiO2EAu/TiO2; ð1Þ
whereEAu,ETiO2, andEAu/TiO2represent the total energies of
a free Au atom, the clean relaxed TiO2(110) surface, and the
adsorbed Au/TiO2(110) system, respectively. For the
stoi-chiometric surface, a Au atom is adsorbed on the on-top site above the bridging-oxygen atom [site B in Fig. 1(a)]. This result is different from one in the case of medium coverage, 1/3 ML. At medium coverage, Au adsorbed on the hollow site surrounded by two in-plane oxygen and one bridging-oxygen atoms or on the on-top site above five-fold titanium atom, and the adsorption energy is 0.10 eV/adatom.10,11,13) The dependence of the adsorption site and energy on the coverage agrees with the result reported by Lopez and Nørskov.14)For the defected surface, a Au atom is adsorbed
on the vacant site of the bridging-oxygen atom [site C in Fig. 1(b)]. The adsorption energy is larger than that of the stoichiometric surface. These results agree with that reported by Wahlstro¨met al.15)The adsorption energy of the site A is
comparable with that of the site C. This is because Au atoms
starting from the site A moved to the site C, resulting in essentially the same configuration as that starting from the site C. Moreover, Au atoms starting from the site G or site L moved to the site E and ones starting from the site H moved to the site F. The slight difference of the adsorption energy between the site E and the site F is cause by the difference of the distance to the bridging-oxygen vacancy. For the added-row surface, Au is adsorbed near the Ti atom in the Ti2O3
row [site E in Fig. 1(c)]. The adsorption energy for the added-row surface is close to that for the defected surface, because a Au adatom interacts with the reduced Ti atoms for both surfaces. The reason why the adsorption energy for the defected surface is slightly larger than that for the added-row
Fig. 1 Schematic geometry (top view) of three kinds of rutile TiO2(110) surface; (a) The perfect stoichiometric surface, (b) the surface formed by removing on bridging-oxygen pre22unit cell, and (c) the reconstructed
[image:2.595.46.551.731.785.2]12surface with Ti2O3rows. The small filled and large open circles indicate oxygen and titanium atoms, respectively. Arrows in (b) indicate oxygen vacancy site.
Table 1 Adsorption energies of Au on the TiO2(110) surfaces with three types of surface condition. Unit is eV/adatom.
A B C D E F G H I J K L M
Stoichiometric 0.59 0.65 0.22 0.30 0.64 0.57
Defected 2.09 0.36 2.08 0.86 1.24 1.22 1.25 1.22 1.23 0.33 0.14 1.25 0.87
surface is that the added-row surface is more stable than the defected surface due to reconstruction.
The optimized Au/TiO2(110) configurations for each
surface condition are shown in Fig. 2. For the stoichiometric surface [Fig. 2(a)], the distance between the Au adatom and the bridging-oxygen atom is 2.01 A˚ . This distance is shorter than that at medium coverage, 2.37 A˚ .33)This is reason why
the adsorption energy at low coverage is larger than that at medium coverage. For the defected surface [Fig. 2(b)], the distance between the Au adatom and the reduced Ti atom is 2.66 A˚ . This distance is the same with that at medium coverage.13) For the added-low surface [Fig. 2(c)], the
distance between the Au adatom and the reduced Ti atom in the Ti2O3 row is 2.44 A˚ . Although this distance is shorter
than that for the defecated surface, the adsorption energy for the added-low energy is slightly smaller than that for the defected surface. One of the reasons is that the added-row surface is more stable than the defected surface as the mentioned above. Another reason is because the displace-ment of the reduced Ti atom interaction the Au atom is large, 1.24 A˚ .
3.2 Electron transfers between Au and TiO2(110)
sur-face
In order to investigate the interaction between Au and TiO2(110) surface in detail, we examine the charge density
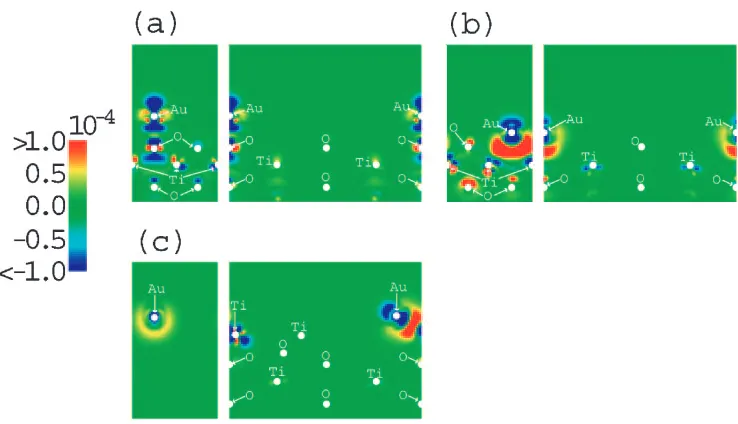
difference, which is obtained by subtracting the superposition of the respective charge densities of the Au adatom and the TiO2(110) slab from that of the Au/TiO2(110) system, as
shown in Fig. 3. For the stoichiometric surface, electrons transfer form the Au adatom to the bridging-oxygen atom. The oxygen 2p bands are filled for the bulk, but the coordination number of the bridging-oxygen reduced from four to two. Therefore, the2pstates of the bridging-oxygen are slightly empty and electron transfer occurs from the Au adatom to the bridging-oxygen atom. At medium coverage (1/3 ML), the electron transfer is negligible.13)This
differ-ence is the reason why the adsorption energy at low coverage is larger than that at medium coverage. For the defected surface, electron densities between the Au adatom and the reduced Ti atoms increase. For the added-row surface, electron densities between the Au adatom and the reduced Ti atom in the Ti2O3row increase, too. Therefore, it can be said Fig. 2 Optimized stable configurations for each surface condition; (a) Au adsorbed on the stoichiometric surface, (b) on the defected
surface, and (c) on the added-row surface. The gray circles represent Au atoms.
[image:3.595.113.487.71.216.2] [image:3.595.113.482.266.478.2]that Au is covalently bound to the reduced Ti atoms for the defected and added-row surfaces.
3.3 Comparison with the experimental STM images It is important that the calculated results are compared with the experimental ones. For the defected surface, Wahlstro¨m el al.15)have already investigated the interaction of Au with
the vacancy. Therefore, we have compared the simulated STM images with the experimental ones for the reconstructed
12 surface. The reason why we chose the reconstructed surface is that it is easy to observed and to determined the surface structure by using STM.
Sample preparation and STM observation were preformed in a UHV-STM system (JSTM4500XT, JEOL) with a base pressure of 2108Pa. The substrate was a polished TiO2(110) single crystal. A clean surface was obtained by
repeated cycles of Arþ sputtering (3 keV for 5 min.) and
annealing (1073 K for 10 min.). The surface observed by the experiment was reconstructed to the cross-linked 12
structure. This structure is different from the structure dealt with in the present simulation. The cross-linked 12
structure, however, consists of the Ti2O3 rows and the
linkage structures, which were modeled by Takakusagi et al.34) Gold was deposited on it by vacuum evaporation at
room temperature. The coverage is 0.006 ML. All STM images were obtained in constant current mode with sample bias voltage ofþ1:5V. For further details, see Ref. 23).
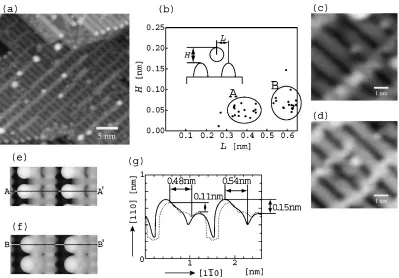
In Fig. 4(a), the experimental STM image is shown. Many particles are adsorbed on the linkage structures. A few particles, however, are adsorbed near the Ti2O3 rows.
Therefore, we compared the simulated STM images with the experimental ones about the particles near the Ti2O3
rows. In Fig. 4(b), the relation betweenLandHfor each Au particle is plotted, whereLis defined as the distance between the center of the Ti2O3 row and the center of the adsorbed
particles and His defined as the height of the particle from the top of the Ti2O3 row [see the inset of Fig. 4(b)]. Two
domains exist in the distribution of the relation betweenLand H. The particles in region A are adsorbed near the Ti2O3row
(0:3nmL0:5nm andH0:05nm), while the particles in the region B are adsorbed slightly far from the Ti2O3 row
(L0:5nm andH0:07nm). The images of Figs. 4(c) and (d) correspond to the images of a particle belonging to the region A and B, respectively.
In order to simulate the STM images, we calculated the following equation;
ðrÞ ¼ X
"F"nk"FþVB
j nkðrÞj2; ð2Þ
where is"FandVB represent the Fermi level and the value
corresponded the sample bias voltage, respectively. And we plotted thezvalue, where thez-axis is the [110] direction, to the following conditions;
ðrÞ ¼;z0; ð3Þ
whereis a constant corresponded the current. We simulated the STM images of two structures. One is the most stable structure as shown in Fig. 2(c). For this structure, a Au adatom interacts with one Ti atom in the Ti2O3 row. The
simulated STM image is shown in Fig. 4(e). Another is the
[image:4.595.99.498.70.348.2]meta-stable structure of Au adsorbed near the Ti2O3row. For
this structure, a Au atom interacts with two Ti atoms in Ti2O3
row and the adsorption energy is 1.06 eV/adatom. The simulated STM image is shown in Fig. 4(f). Fig. 4(g) shows the line profiles along the line AA0 in Fig. 4(e) [solid line]
and along the line BB0in Fig. 4(f) [dotted line]. As shown in
Fig. 4(g), the image of Fig. 4(f) corresponds to the Au adsorption near the Ti2O3row (region A), withLof 0.48 nm
andHof 0.11 nm, and one of Fig. 4(e) corresponds to the Au adsorption slightly far from the Ti2O3row (region B), withL
of 0.54 nm andHof 0.15 nm. The theoretical values ofLand H are not necessarily located in the observed two region strictly, although the tendency of the two sets of values ofL andHfor the most stable and meta-stable configuration is in good agreement with experiment.
4. Discussions and Conclusion
We have investigated theoretically the interaction between Au and a TiO2(110) surface at low coverage, 1/12 ML. We
considered three types of surface conditions; the perfect stoichiometric surface, the surface formed by removing the bridging-oxygen (defected surface), and the reconstructed
12surface with Ti2O3rows (added-row surface). For the
stoichiometric surface, the most stable adsorption site is the on-top site above the bridging-oxygen and the adsorption energy is 0.65 eV/adatom. The most stable site is different from that at medium coverage (1/3 ML) and the adsorption energy at low coverage is larger than that at medium coverage. The oxygen2pbands are filled for the bulk, but the
2p orbitals of the bridging-oxygen become slightly empty due to the reduction of the coordination number. Therefore, the electron transfers can occur from the Au adatom to the bridging-oxygen atom. For the defected surface, the most stable adsorption site is the bridging-oxygen vacancy site and the adsorption energy is 2.09 eV/adatom. Electron density between the Au adatom and the reduced Ti atom at the surface increases. These results agree with the results reported by Wahlstro¨m et al.15) Recently, Minato et al.
investigated the electronic interaction between Au clusters and TiO2(110) surface by photoelectron spectroscopy and
STM.35)They found that Au clusters nucleate at the surface defects of TiO2(110) surface and that the electrons transfer
occurs from TiO2(110) to Au clusters at low coverage. Our
present results also agree with them results. For the added-row surface, the most stable adsorption site is near the Ti atom in the Ti2O3row and the adsorption energy is 1.81 eV/
adatom. Electron density between the Au adatom and the reduced Ti atom in the Ti2O3row increases. Therefore, it can
be said that Au covalently interacts with the reduced Ti atom for both the reduced surfaces, the defected and added-row surfaces.
In addition, we compared the simulated STM images with the experimental STM ones for the reconstructed TiO2(110)
surface with Ti2O3 rows. The TiO2 surface used in our
simulation is the12surface with Ti2O3rows and that used
in experiment is the cross-linked12structure, consisting of the Ti2O3 row and the linkage structure. The reason why we chose the reconstructed surface as a support is that comparison between the STM observation and the simulation
for the non-reconstructed defected surface have already done by Wahlstro¨m15)and that it is easy to control and to determine
the surface structure. The simulated STM images of Au adsorption on the most stable site and the meta-stable site are similar to experimental ones, and can reproduce the exper-imentally observed two distinct adsorption states. The energy difference between the most stable site (site E) and the meta-stable one (site F) is larger, 0.75 eV/adatom. Usually, the most stable configuration may be the major configuration. The reason why the meta-stable configuration is observed by the experiment is that the Ti atom interacting with the Au atom displaces from the position of the clean12surface for the most stable configuration. When the Au atom approaches to the Ti2O3row, the Ti atom in the Ti2O3 row
move toward to the Au atom in order to form the most stable configuration or the Au atom interacts with two Ti atoms in the Ti2O3 row. It can be said that these two processes are
caused by the same probability at room temperature. It is necessary to simulate a process of adsorption dynamics in order to make clear this thing. Moreover, we could nod detect the Au atom adsorbed on the other meta-stable sites; A, B, G, and I in Fig. 1(c). The Au atoms adsorbed on the sites A and B may be counted as those in region B of Fig. 4(b) or may be confused with a part of the linked structures. In addition, there is the possibility that the Au atoms adsorbed on the sites A, B, G, and I diffuse to the cross-linked site easily. These detailed feature need to be studied by the dynamical simulation.
The present results support the idea that the nucleation of Au clusters is related to some non-stoichiometry or defects at TiO2 substrates.12,13,15) Maedaet al. have investigated size
and density of Au particles deposited on TiO2(110)-11
and cross-linked 12 surfaces using STM.36) They found
that Au particles grow large and dominantly cover steps even at room temperature on the 11 surface and that the Au particles are of a small size and highly dispersed on terraces on the12surface. In order to make the catalysts supported on the oxide with the high activity, the particles should be controlled the size and shape and be highly dispersed on the oxide supports. There is a possibility that the catalysts, which the Au particles with the nano-size are highly dispersed, are prepared on the cross-linked 12 surface. Therefore, our study about the interaction between the Au atom and the reconstructed12surface at low coverage is important for the investigation of the initial stage of the growth on the cross-linked12surface.
Acknowledgments
REFERENCES
1) B. Hammer and J. K. Nørskov: Nature376(1995) 238.
2) M. Haruta, N. Yamada, T. Kobayashi and S. Iijima: J. Catal.115(1989) 301.
3) M. Valden, X. Lai and D. W. Goodman: Science281(1998) 1647. 4) M. Haruta: Catal. Today36(1997) 153.
5) M. Valden, S. Park, X. Lai and D. W. Goodman: Catal. Lett.56(1998) 7.
6) D. R. Rainer and D. W. Goodman: J. Mol. Catal. A131(1998) 259. 7) X. Lai, T. P. St. Calir, M. Valden and D. W. Goodman: Prog. Surf. Sci.
59(1998) 25.
8) T. Hayashi, K. Tanaka and M. Haruta: J. Catal.178(1998) 566. 9) L. Zhang, R. Peraud and T. E. Madey: Phys. Rev. B56(1997) 10549. 10) Z. Yang, R. Wu and D. W. Goodman: Phys. Rev. B61(2000) 14066. 11) Y. Wang and G. S. Hwang: Surf. Sci.542(2003) 72.
12) A. Vittadini and A. Selloni: J. Chem. Phys.117(2002) 353. 13) K. Okazaki, Y. Morikawa, S. Tanaka, K. Tanaka and M. Kohyama:
Phys. Rev. B69(2004) 235404.
14) N. Lopez and J. K. Nørskov: Surf. Sci.515(2002) 175.
15) E. Wahlstro¨m, N. Lopez, R. Schaub, P. Thostrup, A. Rønnau, C. Africh, E. Lægsgaard, J. K. Nørskov and F. Besenbacher: Phys. Rev. Lett.90 (2003) 026101.
16) T. Okazawa, M. Fujiwara, T. Nishimura, T. Akita, M. Kohyama and Y. Kido: Surf. Sci.600(2006) 1331.
17) H. Onishi and Y. Iwasawa: Surf. Sci.313(1994) L783.
18) P. W. Murray, N. G. Condon and G. Thornton: Phys. Rev. B51(1995) 10989.
19) M. Ashino, Y. Sugawara, S. Morita and M. Iwasawa: Phys. Rev. Lett. 86(2001) 4334.
20) S. D. Elliot and S. P. Bates: Surf. Sci.495(2001) 211. 21) S. D. Elliot and S. P. Bates: Phys. Rev. B67(2003) 035421. 22) J. R. Kitchin, M. A. Barteau and J. G. Chen: Surf. Sci.526(2003) 323. 23) Y. Maeda, M. Okumura, S. Tsubota, M. Kohyama and M. Haruta:
Appl. Surf. Sci.222(2004) 409.
24) S. H. Ke, T. Uda and K. Terakura: Appl. Surf. Sci.188(2002) 319. 25) T. Hayashi, Y. Morikawa and H. Nozoye: J. Chem. Phys.114(2001)
7615.
26) Y. Morikawa, T. Hayashi, C. C. Liew and H. Nozoye: Surf. Sci.507– 510(2002) 46.
27) P. Hohenberg and W. Kohn: Phys. Rev.136(1964) B864. 28) W. Kohn and L. J. Sham: Phys. Rev.140(1965) A1133.
29) J. P. Perdew, K. Burke and M. Erunzerhof: Phys. Rev. Lett.77(1996) 3865.
30) D. Vanderbilt: Phys. Rev. B41(1990) 7892.
31) N. Troullier and J. L. Martins: Phys. Rev. B43(1991) 1993. 32) D. D. Koelling and B. N. Harmon: J. Phys. C10(1997) 3107. 33) K. Okazaki, Y. Morikawa, S. Tanaka, K. Tanaka and M. Kohyama:
J. Materials Sci.40(2005) 3075.
34) S. Takakusagi, K. Fukui, F. Nariyuki and Y. Iwasawa: Surf. Sci.523 (2003) L41.
35) T. Minato, T. Susaki, S. Shiraki, H. S. Koto, M. Kawai and K. Aika: Surf. Sci.566–568(2004) 1012.