Phase Stability of Iron Oxides on Palladium
Iron Alloy at Elevated Temperatures
and Its Application to High Temperature Oxidation
Tedi Kurniawan
+1, Mitsutoshi Ueda
+2, Kenichi Kawamura and Toshio Maruyama
Department of Metallurgy and Ceramics Science, Graduate School of Science and Engineering, Tokyo Institute of Technology, Tokyo 152-8552, Japan
Phase stability of iron-oxides as a function of alloy composition in PdFeO system has been examined by emf measurement with solid electrolyte of CaO-stabilized zirconia at the temperature ranging from 973 to 1123 K. Phase boundary between the alloy and iron-oxide was determined with six alloys in which Fe-composition is ranging from 1 to 64 at%. The boundary composition of wüstite lies in between 34 at%Fe and 54 at%Fe and hematite was expected to be formed at the alloy composition less than 1 at%Fe. Thickness of iron oxide was estimated from the amount of consumed Fe in the alloy, which is given by the difference of initial andfinal composition at the temperature and oxygen partial pressure. Estimated thickness of iron oxide was in good agreement of that obtained from high temperature oxidation of PdFe alloy. Emf measurement gives useful information to obtain single-phase iron-oxide with the expected thickness on PdFe alloy by high temperature oxidation. [doi:10.2320/matertrans.M2013122]
(Received March 26, 2013; Accepted June 13, 2013; Published August 25, 2013)
Keywords: phase stability, iron oxides, palladiumiron alloys, electromotive force measurements, high temperature oxidation
1. Introduction
Increasing thermal efficiency of fossil fuel power plants is one of the crucial factors of reducing green house gas emission. The most effective way is to increase steam condition. The highest steam temperature in Japan is 620°C (893 K) and power plants are targeted to operate at 700°C (973 K) or higher temperature.1,2) These target temperatures may serve more severe oxidation condition for boiler tubes and turbine components.
Superheaters and reheaters are one of the important components as heat exchanger in the thermal power plants. Ferritic or austenitic heat resistant steels are used for the piping materials. Inside of the boiler tube is exposed to high pressure steam (steam side) and the outer side is exposed to dry atmosphere (fire side). Many researchers showed that oxidation behavior of the heat resistant steels in steam condition was different from that in air condition.35) Formation of protective chromium oxide (Cr2O3) was retarded in steam condition by the growth of duplex scale, which mainly consists of iron-oxides as the outer scale and FeCr spinel as the inner scale. Formation of the non-protected oxides scale becomes a big concern in power plant industry, because it can cause several problems such as wall loss, lower thermal conductivity of the tube and the spallation of the oxide scale. Especially, exfoliation of the scale sometimes makes troubles such as blockage of the tube and erosion of turbine components.
Many researchers69)try to clarify the mechanism of steam oxidation. Ani et al.7) investigated that the effect of water vapor on the transition from internal to external oxidation of FeCr ferritic alloys at 1073 K and the critical Cr content in the alloy increased in the presence of water vapor. They also clarified that dissolved hydrogen enhanced oxygen permeability, resulting in the increase of critical Cr contents. Moreover, there are several evidences that dissolved
hydro-gen or hydrohydro-gen permeation affects the oxidation behavior of heat resisting steels. Nakagawa et al.8,9) examined the oxidation test of ferritic steel in both the single air and in the steam/air dual atmospheres. Their results showed that the thickness of the oxide scale in the dual atmosphere was much thicker than that in the single air. The thicker oxide scale was not only in the steam side, but also in the air side. This indicates that hydrogen permeates through the tube from the steam side to the air side and dissolved hydrogen affects the oxidation behavior at air side. Measurement of hydrogen permeability through oxide scales, especially iron-oxide and FeCr spinel are required to clarify the phenomenon. However, there are few papers which are dealing with hydrogen permeability of oxide scales under steady-state condition. Tanaka et al.10) measured hydrogen permeability through chromia (Cr2O3) scale at 1273 K under constant oxygen activities. They oxidized the foil of FeCr commer-cial steel to obtain constant thickness of the Cr2O3 scale. Present study focuses on iron oxide and the same method will be adopted to measure the hydrogen permeability under the steady-state condition. In this study, uniform layer of iron-oxide on the substrate is made by the oxidation of palladium iron (PdFe) alloy. Pd is chosen as the matrix of the alloy due to high hydrogen permeation so that hydrogen permeation in the alloy matrix can be neglected compared with the oxide scale. There are three phases of iron oxides, wüstite (Fe1¹xO),
magnetite (Fe3O4) and hematite (Fe2O3). Fe oxide is equilibrated with PdFe alloy under the constant PO2 and temperature and constant thickness of single-phase Fe oxide is formed in the equilibrium condition. Accurate phase boundary between Fe oxide and PdFe alloy is required to determine the alloy composition and the oxidation condition to obtain desired Fe oxide on the alloy.
The thermodynamic properties in the PdFe system have been measured earlier by several authors with different methods.1114) The most suitable condition with the purpose of this study is the work which is done by Alcock and Kubik.11) They conducted electromotive force (emf ) meas-urement of PdFe alloy by an oxygen concentration cell with +1Graduate Student, Tokyo Institute of Technology
+2Corresponding author, E-mail: mueda@mtl.titech.ac.jp
ThO2YO1.5 and ZrO2CaO (CSZ) solid electrolyte. Their emf measurement was carried out with the sample, which Fe composition was ranging from of 0.2 to 0.92 at the temperature range from 973 to 1273 K and covered mainly the stability regions of wüstite and magnetite. However, their measurements are still limited only in the higher Fe-compositions and there are little information about phase boundary at our desired PO2 and temperature, which are almost same condition as boiler environments.
In this study, thermodynamic stability of iron oxides in Pd FeO system was focused on less Fe-concentration and at the range temperature required for hydrogen permeability measurement from 973 to 1073 K. The equilibrium oxygen partial pressure of PdFe alloy/iron-oxide was measured with oxygen concentration cell made by solid electrolyte of CSZ. Based on the obtained results, the phase stability of iron-oxides is determined, and the thickness of iron-oxide is estimated as a function of equilibrium oxygen partial pressure and alloy compositions. High temperature oxidations are also conducted to clarify the formation of single-phase of iron oxide with the expected thickness.
2. Experimental
2.1 Sample preparation
Six compositions of PdFe alloys were prepared by arc melting. The ingots were annealed at 1473 K for 172.8 ks in vacuum. Table 1 shows the chemical composition of the alloys analyzed by an electron probe microanalyzer (EPMA). These alloys were cold-rolled to the foils, which thickness is about 150200 µm. The foil was cut into small pieces with the size of 1©1 mm2. Ultrasonic cleaning was conducted prior to the experiment.
2.2 Emf measurement of the oxygen concentration cell
Electromotive force measurement was conducted by an oxygen concentration cell with CSZ solid electrolyte. Figure 1 shows a schematic illustration of the cell. Pt electrode was fabricated on a CSZ tube by the following procedure. Platinum paste was coated on the area to which the electrodes are formed both inside and outside of the CSZ tube. The tube was annealed at 1173 K for 1.8 ks. Pt-mesh which was soldered to Pt-wire was placed on the area where platinum paste was coated and re-annealed at 1173 K for 1.8 ks. R-type thermocouple was placed close to the electrodes so that all electrodes and thermocouple located in the isothermal zone of the furnace.
Theflakes of the alloy were inserted into the cell and the cell was evacuated for 3.6 ks before the valve was closed. The PO2 inside the cell after vacuum process was about 10¹2Pa when the cell heated up to 973 K without the sample. The cell was assembled in the isothermal zone (15 mm,
«1.5 K) of the furnace. The furnace was heated up to measuring temperature. The alloy was oxidized at measuring temperature by the remaining oxygen in the evacuated cell. Oxidation continues until oxygen partial pressure of the cell reaches the equilibrium condition with PdFe alloy/Fe oxide. The change of Fe concentration in the alloy is negligible small, because the alloy is oxidized with the limited amount of oxygen in the evacuated cell. Therefore, we can obtain the
equilibriumPO2 of each PdFe alloy. Oxygen concentration cell in this study is described as follows.
O2½PdFe alloy, Fe oxide; PtjCSZjPt; O2½air ð1Þ
anode side: 2O2!O2½PdFe alloy, Fe oxideþ4e ð2Þ
cathode side: O2½airþ4e!2O2 ð3Þ
The relation between emf (E) and oxygen partial pressure (PO2) is formulated by Nerst’s equation as follows.
E¼ ðRT=4FÞlnðPO2½air=PO2½PdFe alloy, Fe oxideÞ ð4Þ whereRis the gas constant,Tis temperature andFis Faraday constant. Emf measurement was conducted at the temperature between 973 and 1123 K by heating and cooling process.
2.3 High temperature oxidation of PdFe alloys
[image:2.595.309.541.81.433.2]The foils of Pd54Fe and Pd64Fe alloys were used for the oxidation tests. Table 2 shows the condition of oxidation to obtain single-phase of iron oxide on PdFe alloys. Fe concentration in the alloy is changed to be the equilibrium value under the constantPO2 during the oxidation tests and the equilibrium Fe concentration in the alloy will be obtained as a function ofPO2. The foil of Pd64Fe alloy was oxidized at 1073 K or 1273 K for up to 518.4 ks in the stable region of wüstite. The oxygen partial pressures of atmosphere were 4.0©10¹14Pa at 1073 K and 6.3©10¹10Pa at 1273 K, respectively. These values were determined based on the emf
Table 1 Chemical composition of the alloys.
Alloys Pd/at% Fe/at%
Pd1Fe bal. 1.2
Pd5Fe bal. 4.6
Pd10Fe bal. 10.1
Pd34Fe bal. 34.4
Pd54Fe bal. 54.4
Pd64Fe bal. 64.2
[image:2.595.305.549.83.171.2]measurement and corresponded to the equilibrium oxygen partial pressure of Pd54Fe alloy with wüstite. The foils of Pd64Fe and Pd54Fe alloys were oxidized at 1273 K in the stable region of magnetite. Oxygen partial pressure was 4.3©10¹8Pa, which was corresponded to the equilibrium oxygen partial pressure of Pd34Fe alloy with magnetite. The
PO2 was controlled by supplying gas mixture of ArH2H2O
with a certain H2/H2O ratio. ArH2 gas was humidified by passing the gas though distilled water which was kept at constant temperature. ZrO2 oxygen pump was also installed in the apparatus to adjust thePO2.
After oxidation, oxide scale formed on the alloys was identified by X-ray diffraction (XRD). For observation of cross-sections, the samples were mounted in resin, ground by SiC abrasive paper up to#2000 grits, and polished by 2 µm diamond paste. The cross-section of the sample was observed by an optical microscope, SEM and EPMA or FE-SEM with EDS.
3. Results
3.1 Emf measurement of the oxygen concentration cells
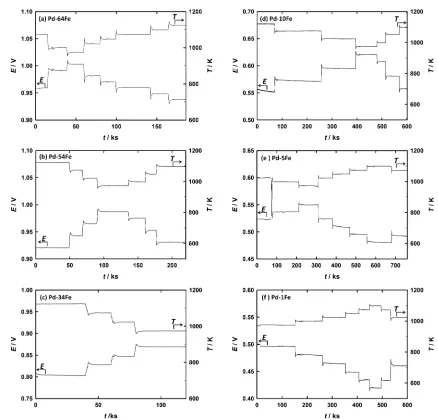
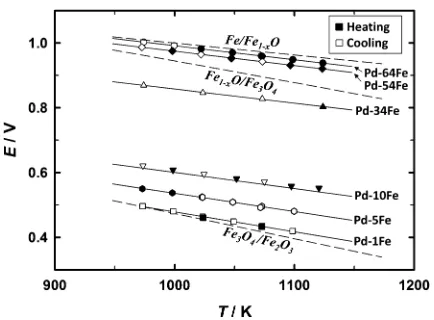
[image:3.595.47.291.184.330.2]Figure 2 shows the temperature and emf’s of the cells with (a) Pd64Fe, (b) Pd54Fe, (c) Pd34Fe, (d) Pd10Fe, (e) Pd 5Fe and (f ) Pd1Fe alloys. Emf changes follow the change of the temperature. In all the measurements, temperature was kept within «1 K. Equilibrium condition is defined as the value when emf was kept within«1 mV for 10.2 ks. Figure 3 shows the equilibrium emf at each temperature for all
Table 2 Condition for oxidation tests.
Alloy
Oxidation Temperature
(T/K)
Oxidation Time (t/ks)
Logarithmic oxygen partial pressure
logðPO2=PaÞ
Wüstite formation
Pd64Fe 1073 259.2 ¹13.4
Pd64Fe 1273 259.2 ¹9.2
Pd64Fe 1273 518.4 ¹9.2
Magnetite formation
Pd54Fe 1273 172.8 ¹7.37
Pd54Fe 1273 345.6 ¹7.37
Pd64Fe 1273 259.2 ¹7.37
Pd64Fe 1273 518.4 ¹7.37
[image:3.595.76.514.352.772.2]measured samples. The solid and open marks indicate the equilibrium emf during the heating and the cooling, respectively. The lines of phase boundaries of Fe/Fe1¹xO,
Fe1¹xO/Fe3O4 and Fe3O4/Fe2O3 were calculated based on
the reported thermodynamics data of the Gibbs free energy change of formation (Gf).1517) Gf of Fe0.947O from Barin15)was chosen as a reference in the iron rich side since the boundary line of Fe/Fe1¹xO between 973 and 1473 K is
almost constant at this composition.15,16)On the other hand, as the composition of wüstite at oxygen-rich region was changing drastically as a function of temperature, Gf of Fe1¹xO from Rizzoet al.17)was taken as a reference for the
boundary line of Fe1¹xO/Fe3O4.
The equilibrium emf’s for the alloys examined are expressed by linear functions with the experimental error.
Pd1Fe E=V¼1:09236:1104T=K0:0018 ð5Þ Pd5Fe E=V¼1:09755:6104T=K0:0016 ð6Þ Pd10Fe E=V¼1:08844:8104T=K0:0018 ð7Þ Pd34Fe E=V¼1:29464:4104T =K0:0016 ð8Þ Pd54Fe E=V¼1:41714:4104T =K0:0006 ð9Þ Pd64Fe E=V¼1:42624:4104T =K0:0003 ð10Þ
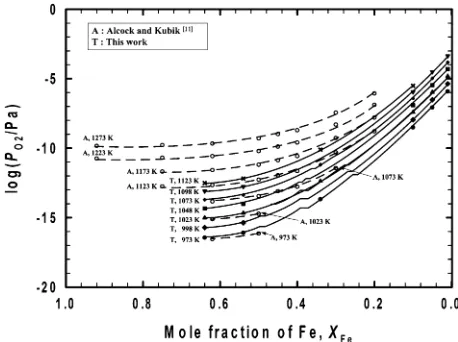
The equilibrium oxygen partial pressure is calculated by using eq. (4). Figure 4 shows the logarithmic oxygen partial pressure as a function of temperature. To describe the relation of oxygen partial pressure and temperature, least-square analysis was performed in between 973 to 1123 K for each alloy composition. The relations between logarithmic oxygen partial pressure as a function of temperature are described as follow.
Pd1Fe logðPO2=PaÞ ¼16:6322021 K=T ð11Þ
Pd5Fe logðPO2=PaÞ ¼15:6222126 K=T ð12Þ
Pd10Fe logðPO2=PaÞ ¼14:0121942 K=T ð13Þ
Pd34Fe logðPO2=PaÞ ¼13:2026099 K=T ð14Þ Pd54Fe logðPO2=PaÞ ¼13:2028569 K=T ð15Þ
Pd64Fe logðPO2=PaÞ ¼13:2028752 K=T ð16Þ The phase boundary between wüstite and magnentite lies in between the alloy composition of Pd34Fe and Pd54Fe. This boundary composition is in good agreement with the result of Alcock and Kubik,11)where its boundary line lies in between Pd30Fe and Pd45Fe. These results also clarified
that hematite is expected to be formed on the alloy which composition of Fe is less than 1 at%.
3.2 High temperature oxidation of PdFe alloys
3.2.1 Oxidation behavior of PdFe alloy at 1073 K
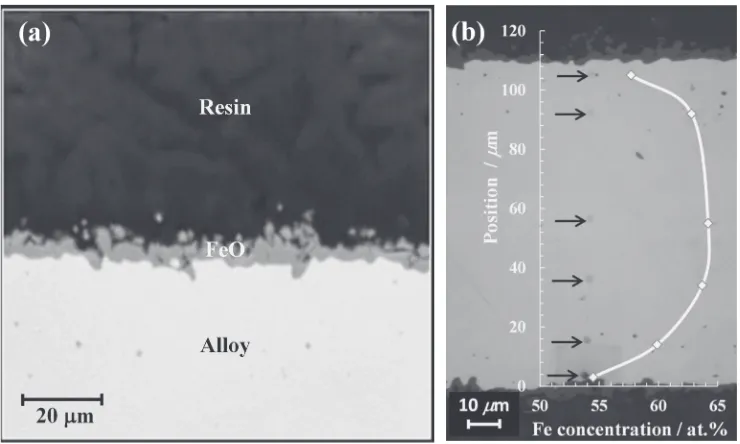
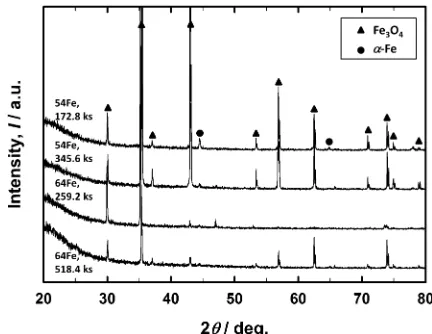
Figure 5 shows the XRD pattern of the oxidized sample after the oxidation of Pd64Fe alloy at 1073 K for 259.2 ks in the stable region of wüstite. Wüstite were detected on the surface of the oxidized sample together with those of the substrate. Figure 6(a) shows the cross-sectional image of the Pd64Fe alloy after oxidation. The average oxide thickness was 3.4«2.3 µm, and it is much thinner than the expected value calculated from the amount of Fe in the alloy. Figure 6(b) shows the concentration profile of Fe in the alloy as a function of position. Although depleted zone of Fe was observed beneath the oxide scale, Fe concentration in the bulk alloy is almost the same as un-oxidized sample. It indicates that the growth rate of wüstite scale at 1073 K is too low to reach equilibrium condition. Oxidation test at higher temperature was preferred to compare the thickness of iron oxide with that estimated from the amount of consumed Fe during the oxidation.
3.2.2 Formation of wüstite on PdFe alloy at 1273 K
Figure 7 shows the XRD pattern of the Pd64Fe alloy oxidized at 1273 K in the stable region of wüstite. The measured oxygen partial pressure during the oxidation was
Fig. 3 Equilibrium emf as a function of temperature. Fig. 4 Logarithmic equilibriumPO2as a function of temperature.
[image:4.595.61.278.67.227.2] [image:4.595.318.534.71.227.2] [image:4.595.316.534.260.432.2]corresponded to the equilibrium PO2 of Pd53Fe alloy with wüstite.¡-Fe and wüstite were detected on the surface.¡-Fe may formed from the dissociation of wüstite during cooling process. Figure 8 shows the BE cross-sectional image of the sample oxidized for 259.2 ks. Continuous wüstite layer was formed on the alloy and precipitation of wüstite was also observed in the substrate. The thickness of wüstite was un-uniform and 27.5«4.9 µm. Surface reaction is rate determining step for the formation of wüstite layer. Figure 9 shows concentration of Fe in the alloy as a function of oxidation time. Concentration of Fe in the bulk reaches to the equilibrium concentration with iron oxide. Final composition of Fe was determined to be 51 at% at 1273 K and the value was closed to that estimated from emf measurement. Although the oxide thickness became thinner than that for 518.4 ks, the thickness of the oxide scale in the equilibrium condition strongly depends on the mass (the thickness) of the initial alloy. These results indicate that the oxidation process has reached the equilibrium condition.
[image:5.595.114.484.69.291.2]3.2.3 Formation of magnetite on PdFe alloy at 1273 K
Figure 10 shows the XRD patterns of the samples oxidized at 1273 K in the stable region of magnetite. The oxygen partial pressure during the oxidation was corresponded to the equilibriumPO2of Pd32Fe alloy with magnetite. Magnetite and ¡-Fe peaks were observed in all oxidized samples. BE images of the cross-sectional area are presented in Fig. 11. Continuous magnetite layer with inhomogeneous thickness was formed on the alloy. Volume fraction of precipitates in the substrate was increased as compared to the alloy with wüstite formation. Figure 12 shows the final composition of Fe in the alloy after the oxidation at 1273 K in the stable region of magnetite. The composition was constant at 29 at% Fe of all oxidized samples, which may indicate that the oxidation has reached equilibrium condition.
4. Discussion
4.1 Phase stability of Fe oxide equilibrated with PdFe
alloy at elevated temperatures
As shown in Fig. 13, phase boundary between PdFe alloy and iron oxide in the PdFeO ternary system were estimated as a function of the composition and temperature based on the equilibrium oxygen partial pressure obtained from emf measurement (Fig. 4). According to phase diagram of PdFe alloy,18) several intermetallic compounds are stable below 1073 K. Equilibrium PO2 between Fe oxides and alloy is independent of the composition of a two phase alloy, because a constant activity of Fe. The oxygen partial pressure calculated from the equilibrium emfs obtained by Alcock and Kubik11) are also plotted in this figure. The oxygen partial pressures at higher iron content were close enough with their result but the difference reaches one order of magnitude higher at lower iron content. This difference may come from the change of Fe concentration in the alloy during the Emf measurement. Fe concentration in the alloy may be changed due to the oxidation with not only by the limited oxygen in the evacuated cell, but also oxygen which was
Fig. 6 (a) BE image of the oxide scale and (b) concentration of Fe in the substrate after the oxidation of Pd64Fe alloy at 1073 K.
[image:5.595.61.277.333.503.2]electrochemically permeated though the CSZ tube. If the equilibrium PO2 was obtained with less Fe concentration of the alloy, the phase boundary as estimated in Fig. 13 shifts to the low Fe concentration side.
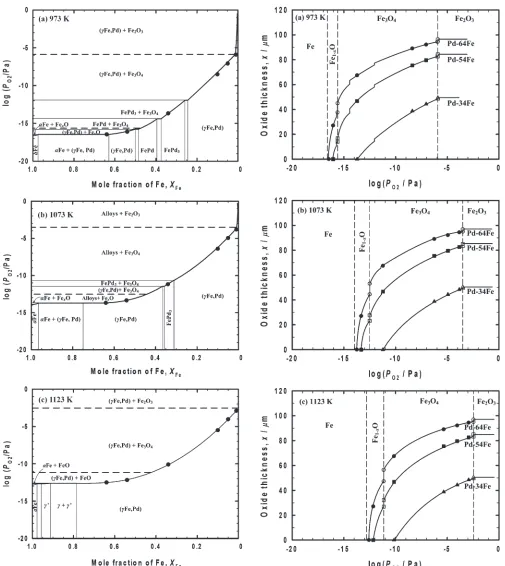
Figures 14(a)14(c) show the phase stability diagrams of PdFeO system at 973, 1073 and 1123 K, respectively. This diagram could provide adequate information of the phase stability of iron oxides based on the alloy compositions and the oxygen partial pressure. The phase boundary between alloy and oxide was determined based on the emf measurement. The phase of iron oxide and the final composition of PdFe alloy can be estimated by these phase stability diagram, when PdFe alloy is oxidized at certain oxygen partial pressure and temperature.
4.2 Estimation of oxide thickness on PdFe alloy during
oxidation
In this study, thickness of iron oxide is calculated from the amount of iron in the alloy which is consumed during oxidation. The final composition of PdFe alloy after oxidation is estimated from the phase stability diagrams, as shown in Fig. 14. Iron oxide of FeaObis formed on the alloy by the following reaction.
aFeþ ðb=2ÞO2 !FeaOb ð17Þ
The amount of FeaOb is expressed as a function of the amount of consumed iron in the alloy as follows.
nFeaOb¼ ð1=aÞnFe ð18Þ wherenis the amount of mole of iron oxide and iron. Based on eq. (18), the thickness of iron oxide formed on PdFe alloy (xFeaOb) can be estimated by following equation.
xFeaOb¼ ðmalloyV
FeaOb
m =aAsurMFeÞ
fðcinitial Fe cfi
nal
Fe Þ=ð100cfi
nal
Fe Þg ð19Þ
where malloy is mass of the initial alloy,VFeaOb
m is the molar
volume of iron oxide, MFe is molar mass of iron and Asur
is the total surface area of the alloy. cinitial
Fe (mass%) and cfinal
Fe (mass%) represents the initial and final concentration
of Fe in the alloy during oxidation. Figures 15(a)15(c) summarize the estimated oxide thickness at 973, 1073 and 1123 K, from initial alloy composition of Pd64Fe, Pd54Fe and Pd34Fe. On the phase boundary, the thickness of the oxide becomes discontinuous due to the difference of molar volume of each oxide. This boundary lines shifted to the higher iron concentration when the oxidation temperature increased.
Fig. 9 Concentration of Fe in the substrate after the oxidation of Pd64Fe alloy at 1273 K.
[image:6.595.113.484.70.252.2]Fig. 8 BE images of the wüstite scales formed on Pd64Fe alloy at 1273 K.
[image:6.595.75.264.298.437.2] [image:6.595.317.533.300.467.2]4.3 Comparison of oxide thickness from estimation and oxidation test at 1273 K
Figure 16 shows the measured oxide thickness as compared to the estimated value from the phase stability diagram. It shows that the thicknesses of wüstite and magnetite from oxidation are close to the estimated value. The thicknesses of magnetite were initially thinner than the
[image:7.595.114.484.65.441.2]estimated one. The formation of precipitate in the substrate might affect to the reduction of magnetite formation on the surface of the alloy. From the surface fraction analysis, total volume of precipitates formed in Pd54Fe and Pd64Fe alloys corresponds the magnetite thickness to 2.6 and 7.2 µm, respectively. By adding the corresponding thickness of magnetite from the fraction of precipitate in the substrate,
[image:7.595.311.540.482.653.2]Fig. 11 BE images of the magnetite scales formed on PdFe alloys at 1273 K.
Fig. 12 Concentration of Fe in the substrate after the oxidation of PdFe
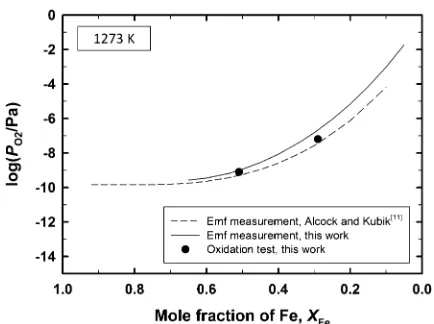
[image:7.595.66.273.486.643.2]the measured thickness became closer to the estimated value. Figure 17 shows phase boundary between alloy and iron oxide at 1273 K, which plotted together with the result of Alcock and Kubik.11) The final compositions of Fe in the alloy after oxidation were slightly lower compared to that estimated from emf measurement. The estimated composition was obtained by the extrapolation of the Emf measurement at low temperature regions (9731123 K). It may be possible
that the value of PO2 from the extrapolation was not as accurate as if it directly obtained from the Emf measurement at 1273 K.
[image:8.595.47.552.65.631.2]The results of the oxidation process at 1273 K have clarified that the phase stability diagram of PdFeO system developed from the emf measurement can be applied to form single-phase of iron oxide with the expected thickness by the oxidation of PdFe alloy.
Fig. 14 Phase stability diagram of iron oxide in the PdFeO system as a
5. Conclusion
The thermodynamic study of PdFe alloy has been conducted at the temperature range from 973 to 1123 K by emf measurement with oxygen concentration cell. The phase boundary between alloy and iron oxide in PdFeO system was determined by emf measurement and phase stability diagram of this system was established as a function of temperature. Thickness of iron oxide on the alloy was
estimated from the amount of consumed iron during oxidation. High temperature oxidation of PdFe alloy has clarified that the determined phase stability diagram can be applied to form single-phase of iron oxide with the expected thickness. The design oxidation test by using this phase stability diagram gives the single-phase of iron oxide on the alloy, which can be used for the hydrogen permeability measurement of iron oxide at elevated temperature.
Acknowledgement
This research was partially supported by Japan Society for Promotion of Science under Grant-in-Aid for “Scientific Research (A) (General)” (21246108). One of the author (T.K.) is grateful for the financial support from Japan International Cooperation Agency (JICA).
REFERENCES
1) Mitsubishi Heavy Industries, Ltd.: Technical Review40(2003). 2) F. Masuyama: JSPS Report of the 123rd Committee on Heat Resisting
Mater. Alloys.48(2007) pp. 215228.
3) M. Ueda and T. Maruyama: Zairyou-to-Kanyou54 (2005) 175182 (in Japanese).
4) Z. Yang, M. S. Walker, P. Singh and J. W. Stevenson:Electrochem. Solid-State Lett.6(2003) B35B37.
5) E. Essuman, G. H. Meier, J. Zurek, M. Hänsel and W. J. Quadakkers: Oxid. Met.69(2008) 143162.
6) E. Essuman, G. H. Meier, J. Zurek, M. Hänsel, L. Singheiser and W. J. Quadakkers:Scr. Mater.57(2007) 845848.
7) M. H. B. Ani, M. Ueda, K. Kawamura and T. Maruyama:Mater. Trans. 50(2009) 26562663.
8) K. Nakagawa, Y. Matsunaga and T. Yanagisawa:Mater. High Temp.18 (2001) 5156.
9) K. Nakagawa, Y. Matsunaga and T. Yanagisawa:Mater. High Temp.20 (2003) 6773.
10) M. Tanaka, M. Ueda, K. Kawamura and T. Maruyama: ISIJ Int.51 (2001) 5156.
11) C. B. Alcock and A. Kubik:Acta Metall. Mater.17(1969) 437442. 12) G. Ghosh, C. Kantner and G. B. Olson:J. Phase Equilib.20(1999)
295308.
13) E. Aukurst and A. Muan:Acta Metall. Mater.10(1962) 555560. 14) J. Tomiska: Z. Metallk.80(1989) 888893.
15) I. Barin, F. Sauert, E. S. Rhonhof and W. S. Sheng:Thermochemical Data of Pure Substances, (VCH Publisher, 1989).
16) L. S. Darken and R. W. Gurry:J. Am. Chem. Soc.67(1945) 1398 1412.
17) H. F. Rizzo, R. S. Gordon and I. B. Cutler:J. Electrochem. Soc.116 (1969) 266274.
[image:9.595.54.285.68.244.2]18) T. B. Massalski: Binary Alloy Phase Diagrams, 2nd ed., (ASM International, 1990).
Fig. 16 Comparison of oxide thickness from the oxidation tests and from emf measurement at 1273 K.
[image:9.595.60.277.295.457.2]