1907
MS
MR Blood Oxygenation Level–Dependent Signal
Differences in Parenchymal and Large Draining Vessels:
Implications for Functional MR Imaging
Timo Krings, Stephan G. Erberich, Florian Roessler, Ju¨rgen Reul, and Armin Thron
BACKGROUND AND PURPOSE: One major limitation of current functional MR (fMR) imaging is its inability to clarify the relationship between sites of cortical neuronal activation, small parenchymal venules that are in close proximity to these sites, and large draining veins distant from the active parenchyma. We propose to use gradient-echo blood oxygenation level– dependent (BOLD) fMR time courses to differentiate large draining veins from parenchymal microvasculature.
METHODS: In eight research subjects, five of whom presented with space-occupying lesions near the central sulcus, gradient-echo fMR imaging was performed during alternating periods of rest and motor activation. MR signal time courses from parenchymal regions and draining veins of different diameters, which were identified using contrast-enhanced T1-weighted scans, were evaluated. Percent signal changes (DS) and the time to the onset of MR signal rise (T0) were calculated.
RESULTS: Mean DS for all subjects was 2.3% (SD 60.7%) for parenchymal activation, 4.3% (SD61.0%) for sulcal macrovasculature, and 7.3 (SD61.1%) for large superficial bridg-ing veins. The mean time to onset of MR signal increase was 4.4 seconds for parenchymal task-related hemodynamic changes and 6.6 seconds for venous hemodynamic changes, regardless of vessel size. Both the differences inDS and T0were statistically significant between venous and parenchymal activation (P,.0001).
CONCLUSION: Gradient-echo fMR imaging reveals hemodynamic task-related changes re-gardless of vessel size and therefore might show macrovascular changes distal to the site of neuronal activity. MR-signal time-course characteristics (DS and T0) can be used to differen-tiate between small parenchymal and larger pial draining vessels, which is especially important in presurgical planning of neurosurgical procedures involving functionally important brain regions. The knowledge about the differences in DS and T0between micro- and macrovascu-lature might lead to a more accurate description of the spatial distribution of underlying neu-ronal activity.
Neuronal activity causes changes in CBF, cerebral blood volume (CBV), and blood oxygenation. It has been demonstrated that MR imaging can be used to detect these subtle cerebral hemodynamic changes with appropriate pulse sequences. Several studies have shown that these specifically designed sequences can be used for noninvasive mapping of
Received November 9, 1998; accepted after revision June 14, 1999.
From the Department of Neuroradiology and the Interdis-ciplinary Center for Clinical Research—Central Nervous Sys-tem, University Hospital of the Technical University, Aachen, Germany.
Address reprint requests to Timo Krings, MD, Department of Neuroradiology, University Hospital of the Technical Uni-versity Aachen, Pauwelsstrasse 30, 52057 Aachen, Germany.
qAmerican Society of Neuroradiology
human brain function. Functional MR (fMR) im-aging techniques that investigate the various as-pects of cerebral hemodynamics (CBV [1], CBF [2], and blood oxygenation) have been developed. Of these different MR techniques, blood oxygena-tion level dependent (BOLD) sequences are used most extensively.
on T2*-weighted pulse sequences, and a consecu-tive attenuation of MR signal intensity (5, 6). Sta-tistical correlation between the MR signal time course and the cognitive paradigm identifies those regions that demonstrate task-related changes in MR signal intensity (7).
One major limitation of functional MR imaging is the still unknown relationship between the lo-calization of the depicted task-related hemodynam-ic changes and the corthemodynam-ical area of neuronal activity (8–10). This so-called ‘‘brain or vein’’ problem (11) describes the lack of knowledge about whether or not large draining veins, which have no close relationship to the areas of cerebral activation or small parenchymal venules in close proximity to the sites of neuronal activity, are depicted during BOLD functional MR imaging. This problem be-comes especially important if functional MR im-aging results are used for presurgical mapping of functional cortical areas in relationship to under-lying brain lesions. To date, the most common ap-proach used to differentiate between large draining veins and small parenchymal veins has been the visual inspection of the functional MR imaging ac-tivation pattern in correlation with anatomic images (12). More elaborate studies have correlated their activation patterns to venous angiograms (13) or have cross-validated their sequences with other electrophysiologically and hemodynamically based mapping techniques, including positron-emission tomography (14), direct electrical cortical stimula-tion (15), magnetoencephalography (16), electro-encephalography (17), or transcranial magnetic stimulation (18). Instead of these cross-validation techniques, the aim of the present study was to use MR-signal time-course characteristics in a typical fMR imaging experiment to differentiate between small parenchymal venules and large draining veins that are demonstrated by contrast-enhanced T1-weighted studies.
Methods
Eight subjects (23–65 years old), of whom five underwent presurgical evaluation for tumors in the area of the central sulcus, were investigated. All experiments were performed on a clinical 1.5-T scanner equipped with echo-planar imaging (EPI) capabilities (Gyroscan ACS NT, Philips Medical Sys-tems, Best, the Netherlands). The subjects were rigidly fixated in a standard headcoil by using Velcro straps and foam padding to minimize motion artifacts. For each subject before each scan was obtained, field homogeneity was optimized using an au-tomatic shimming sequence.
Anatomic Images
Six contiguous T1-weighted spin-echo slices were obtained for anatomic reference and were oriented parallel to the line running through the anterior and the posterior commissure. Im-ages were obtained solely from the suprasylvian region (100/ 14 [TR/TE]; flip angle, 908; matrix, 2563256; field of view, 250 3175 mm; and slice thickness, 5 mm). After the func-tional scans were performed, this T1-weighted anatomic se-quence was repeated after administration of Gd-DTPA. At the end of the scanning procedure, a 3D phase-contrast
gradient-echo (GE) angiographic sequence (20/8.6 [TR/TE]; flip angle, 158; matrix, 256 3 256; flow selectivity, 10 mm/s) was ob-tained. Each scan (anatomic, functional, postcontrast, angio-graphic) was obtained with the same slice number, orientation, and localization.
Functional Images
BOLD imaging was performed on all eight subjects using a multi-shot T2*-weighted GE EPI sequence (278/35 [TR/TE]; flip angle, 358; matrix, 64 3 64; field of view, 250 3 175 mm). Six 5-mm-thick slices were obtained that had the same localization and orientation as the anatomic slices. One hun-dred two images were generated (2.2 s/image) during a total imaging time of 3 minutes 42 seconds.
Each task paradigm consisted of six 37-second blocks alter-nating between rest and activation. The specific task was the repetitive, self-paced opening and closing of the hand (‘‘hand clenching’’). The activity was performed with a frequency of approximately 1 Hz. Hand clenching was used as opposed to finger tapping because it constitutes a simpler movement re-quiring less fine-motor activity, which was impaired in some patients with tumors near the central sulcus. One additional subject was investigated with a faster sequence employing only two 5-mm-thick slices. This faster sequence focused on the paracentral lobule, which enabled a temporal resolution of 556 ms/image.
Each subject repeated the functional task twice. In one pa-tient, only one study was performed because of the patient’s discomfort in the scanner. Subjects gave written informed con-sent for participation in the study. None of the subjects expe-rienced any procedure-related side effects.
To minimize the effects of interimage motion-related arti-facts, we employed an automated image realignment algorithm for each set of functional data (19). Sites of functional acti-vation were identified on a voxel by voxel basis using the Kolmogorov Smirnov nonparametric statistical test to compare the MR signal time course with the given task paradigm. Ac-tivation maps were color-coded according to the statistical sig-nificance of difference between the rest and activation states and overlaid upon the anatomic T1-weighted images, the ve-nous angiograms, and the contrast-enhanced T1-weighted im-ages for anatomic reference and detection of venous structures. Task-related MR signal changes arising from draining veins could be identified reliably by toggling the activation maps over the contrast-enhanced scans.
During signal time-course analysis, the following steps were performed independently for ‘‘activated’’ regions overlaying the parenchyma, small veins in the depth of the central sulcus, and large veins on the cortical surface parenchyma. First, per-cent signal change (DS), and then determination of the latency between onset of task activity and onset of signal rise time (T0) were calculated. To minimize partial volume effects, only one voxel for each region was evaluated. We selected this vox-el according to its statistical power. Percent signal change was calculated between the arithmetic mean MR signal-intensity baseline value and the mean MR signal-intensity activated-state value. The time of onset of MR signal-intensity rise was determined as follows. The standard deviation for the baseline MR signal-intensity values was calculated. The time of onset (T0) was defined as the first time-point after task initiation in which the MR signal intensity was consistently (five consec-utive time-points) higher than the mean baseline plus twice the standard deviation. To test for intrasubject variation ofDS, the arithmetic error between the two functional runs was calculated.
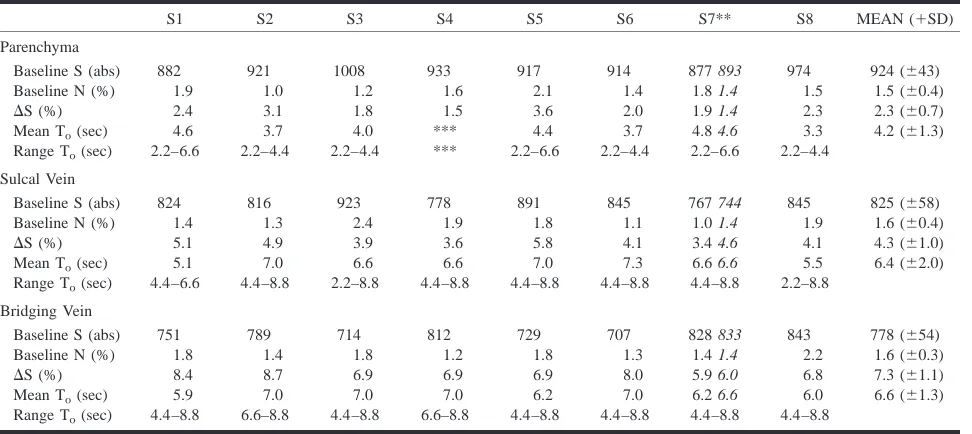
MR BOLD signal characteristics for veins of different sizes*
S1 S2 S3 S4 S5 S6 S7** S8 MEAN (1SD)
Parenchyma
Baseline S (abs) 882 921 1008 933 917 914 877 893 974 924 (643) Baseline N (%) 1.9 1.0 1.2 1.6 2.1 1.4 1.8 1.4 1.5 1.5 (60.4)
DS (%) 2.4 3.1 1.8 1.5 3.6 2.0 1.9 1.4 2.3 2.3 (60.7) Mean To(sec) 4.6 3.7 4.0 *** 4.4 3.7 4.8 4.6 3.3 4.2 (61.3) Range To(sec) 2.2–6.6 2.2–4.4 2.2–4.4 *** 2.2–6.6 2.2–4.4 2.2–6.6 2.2–4.4
Sulcal Vein
Baseline S (abs) 824 816 923 778 891 845 767 744 845 825 (658) Baseline N (%) 1.4 1.3 2.4 1.9 1.8 1.1 1.0 1.4 1.9 1.6 (60.4)
DS (%) 5.1 4.9 3.9 3.6 5.8 4.1 3.4 4.6 4.1 4.3 (61.0) Mean To(sec) 5.1 7.0 6.6 6.6 7.0 7.3 6.6 6.6 5.5 6.4 (62.0) Range To(sec) 4.4–6.6 4.4–8.8 2.2–8.8 4.4–8.8 4.4–8.8 4.4–8.8 4.4–8.8 2.2–8.8
Bridging Vein
Baseline S (abs) 751 789 714 812 729 707 828 833 843 778 (654) Baseline N (%) 1.8 1.4 1.8 1.2 1.8 1.3 1.4 1.4 2.2 1.6 (60.3)
DS (%) 8.4 8.7 6.9 6.9 6.9 8.0 5.9 6.0 6.8 7.3 (61.1) Mean To(sec) 5.9 7.0 7.0 7.0 6.2 7.0 6.2 6.6 6.0 6.6 (61.3) Range To(sec) 4.4–8.8 6.6–8.8 4.4–8.8 6.6–8.8 4.4–8.8 4.4–8.8 4.4–8.8 4.4–8.8
Note.—Baseline S, mean baseline signal in absolute values; Baseline N, mean percent signal noise;DS, mean percent gradient–echo BOLD MR signal changes; Mean To,mean time delay until a significant increase from the baseline (mean value12SD) is noted; Range Torange of onset times using a time resolution of 2.2 sec per scan.
* All values represent the mean of two functional runs performed during the same imaging session.
** In subject 7, two imaging sessions consisting of two functional runs were performed 10 days apart. The values for the latter session are given in italics.
*** In subject 4 no significant increase from the baseline was noted.
Results
Motor activation induced robust task-related he-modynamic changes in the primary sensorimotor cortex contralateral to the activated hand in all of the investigated subjects. The pattern of activation was similar in all subjects: deep medial activity lo-cated in the ‘‘hand knob’’ (20), an omega-shaped part of the precentral gyrus, and, typically in the same slice, more superficial lateral activity within the central sulcus. In subsequent higher slices, the lateral activation still was visible on the superficial cortex, whereas the medial activity was maximally located on two subsequent slices. The lateral activ-ity always was contiguous on the adjacent slices in all investigated subjects, extended toward the su-perior sagittal sinus, and had a tubular structure, presumably corresponding to the central sulcal vein.
The area of activation on the surface of the brain, which was visible on multiple slices, was identified as a large draining vessel when overlaying the functional maps on the contrast-enhanced T1-weighted scan. The dual activation visible on at least one slice in each patient could be differenti-ated further when being merged with the venous anatomy. The lateral, more superficial area of ac-tivation co-localized in all cases in which a vessel was seen after administration of Gd-DTPA; how-ever, the medial deep activation did not spatially coincide with a macrovessel.
Student t-test statistics of the time-course anal-ysis revealed highly significant (P,.0001)
differ-ences in T0 andDS between parenchymal and
ve-nous sites of task-related hemodynamic changes and highly significant differences inDS for super-ficial and sulcal veins. T0 differences between
su-perficial and sulcal veins were not significant. There were no significant differences in MR signal time-course characteristics between different runs in the same subject;DS demonstrated a mean percent signal change variation of 0.4% (range 0–1.7 %) between two different runs of the same subject. The Table herein shows the meanDS and T0values for
[image:3.612.60.546.74.291.2]all subjects. Mean DS for all subjects was 2.3% (SD60.7%) for parenchymal activation, 4.3% (SD 61.0%) for sulcal macrovasculature, and 7.3% (SD 61.1%) for large superficial bridging veins. The median time to onset of MR signal increase was 4.4 seconds for parenchymal task-related hemody-namic changes and 6.6 seconds for venous hemo-dynamic changes, regardless of vessel size. In all but one functional run (subject 1, run 2), there was no overlap in values between parenchymal and nonparenchymal T0.
FIG 1. MR signal time courses for parenchyma, sulcal veins,
and bridging veins for single subject in two different functional runs (hand clenching) (S1). Each diamond represents MR signal at one time-point. Temporal resolution of the sequence was 2.2 s/image. Mean percent signal changes increase as a function of vessel size. Note low test-retest variability of percent signal changes within the same subject.
The single subject who was investigated using a higher temporal resolution had similar DS values compared with the other eight subjects (parenchy-ma, 2.2%DS; sulcal vein, 3.1%DS; bridging vein, 5.7%DS). When evaluating the signal time-course, however, a finer temporal discrimination was pos-sible. The first significant increases from baseline were noted in parenchymal venules (3A [3.4–3.9 seconds]), sulcal veins (3B [5.5–6.1 seconds]), and large bridging veins (3C [6.1–6.7 seconds]) after the subject moved his hand.
Illustrative Case
Patient 7 (28-year-old woman) underwent pre-surgical planning for a space-occupying lesion of unknown etiology near the central sulcus. Func-tional MR imaging showed dual activation in close proximity to the tumor in the central region. The lateral activity had a mean percent signal change of 3.4% and a T0 of 6.6 seconds, whereas the re-spective values for the medial activity were DS 1.9% with a T0of 4.8 seconds. The medial activity showed posterior displacement, with the tumor di-rectly anterior to the functional activation, whereas the stronger activity was displaced lateral to the tumor and at an in-plane distance of 3 mm to the medial activation. A stereotactic biopsy was taken after which the patient suffered from a paresis of the right small hand muscles with a loss of fine
motor skills. An fMR imaging re-examination was performed 10 days after the first and 8 days after the biopsy was taken. The persistent paresis still allowed for hand clenching, with a marked de-crease in finger movement rate compared with the initial functional MR imaging investigation. Ana-tomic images showed that the biopsy was taken from the posterior part of the lesion and also af-fected healthy tissue in which part of the medial activation of the former functional examination was seen. Subsequent activation maps again revealed dual activation with the lateral area unchanged in location, extent, percent signal change, and statis-tical significance, whereas the medial area showed more lateral displacement, directly adjacent to the biopsy site and decreased in extent, percent signal change, and peak statistical significance (Fig 4).
Discussion
Using the following criteria, merging of func-tional images with T1-weighted images can assist in the differentiation between functional MR signal changes of large draining vessels and those of small parenchymal vessels. Small parenchymal microves-sels are represented by those voxels that are located mainly in the part of the gray matter that corre-sponds to functional anatomy (ie, hand knob) (20) and that do not extend to the superior surface of the brain where the major draining veins are locat-ed. This microvasculature has a close spatial rela-tionship to the cortical sites of neuronal activation (12). Sulcal or superficial activity, on the contrary, presumably reflects large draining vessels such as bridging veins.
On contrast-enhanced T1-weighted images, ad-ditional pial vessels such as deep sulcal veins can be visualized. Merging of functional maps with these contrast-enhanced scans allows for an even finer differentiation of the size of the vasculature from which the functional MR signal change stems (13). Thus, we used morphologic, not physiologic, criteria to segment the observed signal changes. In the following, the term microvasculature will be used for those draining veins that show functional MR signal change during activation but are not vis-ible on contrast-enhanced T1-weighted sequences nor do they follow the above-mentioned criteria for parenchymal vessels. The term macrovasculature will be used for those draining veins that can be seen on contrast-enhanced T1-weighted scans.
FIG2. MR signal time course correlation with contrast-enhanced T1-weighted scans and phase-contrast MR angiography (S5).
Con-trast-enhanced studies reliably show sulcal and superficial veins, whereas the phase-contrast MR angiography with given flow sensitivity demonstrates vessels the size of large bridging veins. Significant change in MR signal (DS) is seen in bridging veins even close to superior sagittal sinus. From this data, one can presume that dilution of increased oxyhemoglobin content and therefore decay ofDS takes place when bridging veins enter large draining sinuses.Arrows point at sulcal veins, arrowheads at large bridging veins.
draining upward, or in axial slices, draining later-ally, toward the brain surface (21). The small ven-ules of the parenchyma are in close spatial rela-tionship to the activated neuronal tissue, maximally 1.5-mm apart and too small to be detectable on contrast-enhanced studies (22). Nonetheless, the larger sulcal veins, which are fed by smaller veins within the posterior and anterior banks of the pre-and postcentral gyri, respectively, are visible on contrast-enhanced studies. The lateral area of acti-vation typically overlaid a vein visible on contrast-enhanced T1-weighted sequences, whereas the me-dial area did not. The lateral area extended over multiple slices and therefore had a tubular struc-ture, most likely resembling a superficial draining vein. The fact that both micro- and macrovascula-ture are depicted by GE fMR imaging is further confounded by Monte-Carlo modeling of suscep-tibility physics. Unlike spin-echo sequences, GE sequences are not specific in the detection of vessel sizes (23–25). Spin-echo sequences, on the con-trary, have a high specificity for microvessels but are less sensitive to magnetic susceptibility effects. At 1.5 T, functional contrast for both sequences is
quite similar within parenchymal regions, whereas signal changes in large vessels is reduced greatly by employing an additional refocusing pulse as used in spin-echo sequences (26). This diminution of signal arising from large vessels is not observed with GE sequences. The decreased specificity for detected vessel size of GE sequences is traded against a higher overall sensitivity for magnetic susceptibility differences and, therefore, a higher percent signal change in GE sequences compared with spin-echo sequences. Most fMR imaging stud-ies employ GE sequences for this reason.
FIG 3. MR signal time courses for parenchyma, sulcal veins,
and bridging veins for subject scanned with higher temporal res-olution (556 ms/image) during hand clenching. With a finer tem-poral resolution, the differences in onset of significant task relat-ed MR signal changes between vessels of different diameter can be visualized.
with microvessels (23–25). In addition, in vivo measurements have shown that the region that con-tributes the intravoxel dephasing extends as far as twice the vessel diameter (5). This means that the volume that contributes to the dephasing is four times that of the vessel volume if one treats a cyl-inder as a two-dimensional object (5). Therefore, magnetic susceptibility effects and a concomitant increase in DS are enhanced presumably around large veins draining an extended activated region (12). The macroscopic signal increase during neu-ronal activation reflects a net increase in brain ox-ygenation within extended-field brain tissue. A sec-ond explanation for the more prominent increase in DS in larger vessels is, therefore, partial volume effect. Because parenchymal vessels are consider-ably smaller than are the draining macrovessels, pa-renchymal activation suffers from larger partial volume averaging, with brain tissue unaffected by the motor activation. The corresponding diminution of the mean signal change theoretically could be removed by reducing the slice thickness and in-creasing the imaging matrix, because it is known
that object contrast and visibility increase as reso-lution increases until the voxel size is similar to the object size (28). A third explanation is inflow ef-fects, which have a significant impact on percent signal changes (8, 10) and are more pronounced in large vessels than in cortical microvasculature. It is known from studies of the structure of the micro-vasculature within the brain that there is a random distribution of capillary orientation (29). Inflow ef-fects are of particular interest in functional neu-roimaging when large flip angles, thin slices, and short TRs are used. The fourth explanation is that DS also might be higher in the macrovasculature, because the venous drainage in larger sulcal vessels might have contributions from a larger area. It is known from the venous anatomy of the pre- and postcentral gyrus that the central sulcus is filled with pial vessels draining from both banks of the central sulcus (21). During motor tasks, both the precentral gyrus and the postcentral sensory cortex are active, presumably because of sensory feedback during the performance of the motor task (13). Draining veins in the central sulcus and the cortical surface collect from a larger area of cortex and, therefore, demonstrate enhanced hemodynamic changes. As Malonek and Grinvald indicated (30, 31), this increased inflow is regulated at a rather coarse spatial scale.
Differences in the onset of signal change be-tween large draining veins and cortical microvas-culature have been reported previously (32). It was shown that signals from large vessels are time-de-layed compared with those from small vessels. The larger delay is consistent with the longer time re-quired for blood to reach larger vessels. We were able to demonstrate similar MR signal time-course characteristics. Our time resolution was rather coarse (2.2 s/scan), yet the differences in T0 were
statistically significant between venous and paren-chymal ‘‘activation.’’ There, however, was no sig-nificant difference between the larger draining veins (ie, sulcal and superficial bridging veins). These results were confirmed in the single subject who was examined with a higher temporal resolu-tion. The earlier onset in the microvasculature re-flects hemodynamic changes in draining vessels that are more closely time-locked to the neuronal activation and, therefore, demonstrate a better spa-tial concordance to the site of neuronal activity. In contrast to DS, which only reflects vessel size, T0
seems to reflect the vascular transit time from the capillary bed to the large draining veins.
FIG4. Functional MR and MR signal time course. This patient was evaluated for presurgical planning of a space-occupying lesion
near central sulcus (Astrocytoma III) (S7). The first fMR imaging study shows dual activation in slice of interest with parenchymal activation located in close proximity to tumor. A stereotactic biopsy was performed after which the patient suffered from transient mild paresis of the small right hand muscles. A postbiopsy MR image demonstrates that the biopsy involved a previously activated region posterior to the lesion. Functional study again shows dual activation with parenchymal activation close to biopsy tract and lateral venous activity unaffected by biopsy. This case illustrates the importance of differentiating task-related hemodynamic changes of small paren-chymal venules and large draining veins.
too low to yield statistically significant results (7). In these cases, parenchymal activation with a lower statistical power might not be detectable, whereas venous activation is, which leads to misinterpreta-tion of the anatomic correlate of the specific task-related activity, because only larger venous struc-tures demonstrate a high enoughDS and, therefore, a high enough statistical power. Coregistration of functional maps with contrast-enhanced T1-weight-ed images might help in these studies to subtract signal arising from the macrovasculature. A second approach is to use the described differences in T0 and DS to discern micro- from macrovasculature. Preliminary work from our group has shown that it is possible to use an unsupervised self-organiz-ing-map neural-network technique that separates the voxels in the time-domain into different clus-ters. This technique might result in an automated detection and corrective algorithm for venous struc-tures (33). A third approach is to increase the over-all signal and, therefore, the ability to detect subtle signal changes in gray matter by using higher field strengths of the scanner. Because the absolute value
of volume susceptibility differences between oxy-genated and deoxyoxy-genated hemoglobin is more pronounced at high field strength (34), higher field imaging magnets increase the observed T2* changes (9, 27).
Conclusion
it is not obvious why different GE sequences should yield significantly different results. Varia-tion of MR imaging parameters will definitely en-hance or diminish percent signal change. Geomet-ric imaging parameters such as matrix size and slice thickness will lead to an increased DS if res-olution is enhanced, lowering the possibility for un-wanted partial volume effects; slice thicknesses of . 8 mm will suffer from considerable partial vol-ume averaging with concomitant signal decrease (35). The choice of echo time also will have a con-siderable effect on signal intensity and observed signal changes. Even though susceptibility weight-ing is increasweight-ing at longer echo times, the measur-able signal strength will decrease because of system instabilities, imaging artifacts, and, of course, T2 relaxation processes (35, 36). These changes, how-ever, are not likely to affect the relative differences between parenchymal and sulcal activation, which, therefore, might be used to differentiate the fMR signal.
References
1. Belliveau JW, Kennedy DN, McKinstry RC, et al. Functional
mapping of the human visual cortex by magnetic resonance imaging. Science 1991;254:716–719
2. Kwong KK, Bellieveau JW, Chesler DA, et al. Dynamic magnetic
resonance imaging of human brain activity during primary sensory stimulation. Proc Natl Acad Sci USA 1992;89:5675–
5679
3. Fox PT, Raichle ME. Focal physiological uncoupling of cerebral
blood flow and oxidative metabolism during somatosensory stimulation in human subjects. Proc Natl Acad Sci USA 1986;
83:1140–1144
4. Fox PT, Raichle ME, Mintun MA, Dence C. Nonoxidative
glu-cose consumption during focal physiologic neural activity. Sci-ence 1988;241:462–464
5. Ogawa S, Lee TM, Nayak AS, Glynn P. Oxygenation-sensitive
contrast in magnetic resonance image of rodent brain at high magnetic fields. Magn Reson Med 1990;14:68–78
6. Turner R, Le Bihan D, Moonen CT, Despres D, Frank J.
Echo-planar time course MRI of cat brain oxygenation changes. Magn Reson Med 1991;22:159–166
7. Kwong KK. Functional MRI with echo planar imaging. Magn
Reson Q 1995;11:1–20
8. Duyn JH, Moonen CTW, van Yperen GH, de Boer RW, Luyten PR. Inflow versus deoxyhemoglobin effects in BOLD
function-al MRI using gradient echoes at 1.5T. NMR Biomed 1994;7:83–88
9. Kim SG, Hendrich K, Hu X, Merkle H, Ugurbil K. Potential
pitfalls of functional MRI using conventional gradient recalled echo techniques. NMR Biomed 1994;7:69–74
10. Righini A, Pierpaoli C, Barnett AS, Waks E, Alger JR. Blue blood
or black blood: R1 effects in gradient-echo echo-planar func-tional neuroimaging. Magn Reson Imaging 1995;13:369–378
11. Frahm J, Merboldt KD, Ha¨nicke W, Kleinschmidt A, Bo¨cker H.
Brain or vein—oxygenation or flow? On signal physiology in functional MRI of human brain activation. NMR Biomed 1994;
7:45–53
12. Van Gelderen P, Ramsey NF, Liu G, et al. Three-dimensional
functional magnetic resonance imaging of human brain on a clinical 1.5-T scanner. Proc Natl Acad Sci 1995;92:6906–6910
13. Krings T, Reul J, Spetzger U, Klusmann A, Roessler F, Gilsbach JM, et al. Functional magnetic resonance mapping of sensory
motor cortex for image-guided neurosurgical intervention. Acta neurochirurgica 1998;140:215–222
14. Kraut MA, Marenco S, Soher BJ, Wong DF, Bryan RN.
Com-parison of functional MR and H215O positron emission
to-mography in stimulation of the primary visual cortex. AJNR Am J Neuroradiol 1995;16:2101–2107
15. Jack CR, Thompson RM, Butts RK, et al. Sensory motor cortex:
correlation of presurgical mapping with functional MR im-aging and invasive cortical mapping. Neuroradiology 1994;190:
85–92
16. Beisteiner R, Comiscek G, Erdler M, Teichtmeister C, Moser E, Deeke L. Comparing localization of conventional functional
magnetic resonance imaging and magnetoencephalography. Eur J Neurosci 1995;7:1121–1124
17. Grimm C, Schreiber A, Kristeva-Feige R, Mergner T, Hennig J, Lu¨cking CH. A comparison between electric source localization
and fMRI during somatosensory stimulation. Electroenceph Clin Neurophysiol 1998;106:22–29
18. Krings T, Buchbinder BR, Butler WE, et al. Functional magnetic
resonance imaging and transcranial magnetic stimulation: Complementary approaches in the evaluation of cortical mo-tor function. Neurology 1997;48:1406–1416
19. Friston KJ, Ashburner J, Frith CD, Poline JB, Heather JD, Frac-kowiak RSJ. Spatial registration and normalization of images.
Human Brain Mapping 1995;3:165–189
20. Yousry TA, Schmid UD, Alkahdi H, et al. Localization of the
motor hand area to a knob on the precentral gyrus. A new landmark. Brain 1997;120:141–157
21. Duvernoy HM, Delon S, Vannson JL. Cortical blood vessels of
the human brain. Brain Res Bull 1981;7:519–579
22. Lai S, Hopkins AL, Haacke EM, et al. Identification of
vas-cular structures as a major source of signal contrast in high resolution 2D and 3D functional activation imaging of motor cortex at 1.5T: Preliminary results. Magn Reson Med 1993;
30:387–392
23. Weisskoff RM, Zuo C, Boxerman JL, Rosen BR. Microscopic
susceptibility variation and transverse relaxation: theory and experiment. Magn Reson Med 1994;31:601–610
24. Boxerman JL, Bandettini PA, Kwong KK, et al. The
intravas-cular contribution of fMRI signal change: Monte Carlo mod-eling and diffusion-weighted studies in vivo. Magn Reson Med
1995;34:4–10
25. Boxerman JL, Hamberg LM, Rosen BR, Weisskoff RM. MR
con-trast due to intravascular magnetic susceptibility perturba-tions. Magn Reson Med 1995;34:555–566
26. Buchbinder BR, Cosgrove GR. Cortical activation MR studies
in brain disorders. MRI Clin North Am 1998;6:67–93
27. Gati JS, Menon RS, Ugurbil K, Rutt BK. Experimental
deter-mination of the BOLD field strength dependence in vessels and tissue Magn Reson Med 1997;38:296–302
28. Hendrick RE, Haacke EM. Basic physics of MR contrast agents
and maximization of image contrast. J Magn Reson Imaging
1993;3:137–148
29. Pawlik G, Rackl A, Bing RJ. Quantitative capillary topography
and blood flow in the cerebral cortex of cats: an in vivo mi-croscopic study. Brain Res 1981;208:35–58
30. Malonek D, Grinvald A. Interactions between electrical activity
and cortical microcirculation revealed by imaging spectros-copy: Implications for functional brain mapping. Science 1996;
272:551–554
31. Turner R, Grinvald A. Direct visualization of patterns of
de-oxygenation and rede-oxygenation in monkey cortical vasculature during functional brain activation. Thirteenth Annual Meeting
of the Society of Magnetic Resonance 1994 S:430
32. Lee AT, Glover GH, Meyer CH. Discrimination of large venous
vessels in time-course spiral blood-oxygen-level-dependent magnetic resonance functional neuroimaging. Magn Reson Med
1995;33:745–754
33. Erberich SG, Fellenberg M, Krings T, Kemeny S, Willmes K, Reith W. Unsupervised time course analysis of functional
mag-netic resonance imaging (fMRI) using self-organizing maps (SOM). Proc SPIE Med Imag 1999, in press
34. Brooks RA, Di Chiro G. Magnetic resonance imaging of
sta-tionary blood: a review. Med Phys 1987;14:903–913
35. Frahm J, Merboldt KD, Ha¨nicke W. Functional MRI of human
brain activation at high spatial resolution. Magn Reson Med
1993;29:139–144
36. Fisel CR, Ackerman JL, Buxton RB, et al. MR contrast due to