Proceedings of the Workshop on Distributional Semantics and Compositionality (DiSCo’2011), pages 33–37,
Identifying Collocations to Measure Compositionality :
Shared Task System Description
Ted Pedersen
Department of Computer Science University of Minnesota Duluth, MN 55812 USA [email protected]
Abstract
This paper describes three systems from the University of Minnesota, Duluth that partici-pated in the DiSCo 2011 shared task that eval-uated distributional methods of measuring se-mantic compositionality. All three systems approached this as a problem of collocation identification, where strong collocates are as-sumed to be minimally compositional. duluth-1 relies on the t-score, whereas duluth-2 and duluth-3 rely on Pointwise Mutual Informa-tion (pmi). duluth-1 was the top ranked
sys-tem overall in coarse–grained scoring, which
was a 3-way category assignment where pairs were assigned values of high, medium, or low compositionality.
1 Introduction
An ngram or phrase that means more than the sum of its parts is said to be non-compositional. Well known examples include kick the bucket (i.e., to die) and red tape (i.e., bureaucratic steps). The ability to measure the degree of semantic compositionality in a unit of text is a key capability of NLP systems, since non-compositional phrases can be treated as a single unit, rather than as a series of individual words. This has a tremendous impact on word sense disambiguation systems, for example, since a non-compositional phrase will often have just one pos-sible sense and thereby be reduced to a trivial case, whereas the combination of possible sense assign-ments for the words that make up a phrase can grow exponentially.
Identifying collocations is another key capability of NLP systems. Collocations are generally
consid-ered to be units of text that occur with some regular-ity and may have some non-compositional meaning. The Duluth systems that participated in the DiSCo 2011 shared task (Biemann and Giesbrecht, 2011) seek to determine the degree to which collocation identification techniques can be used to measure se-mantic compositionality. In particular, these systems are based on the following hypothesis:
An ngram that has a high score accord-ing to a measure of association (for iden-tifying collocations) will be less composi-tional (and less literal) than those that have lower scores.
The intuition underlying this hypothesis is a high score from a measure of association shows that the words in the ngram are occurring together more of-ten than would be expected by chance, and that a non-compositional phrase is unlikely to occur in such a way that it looks like a chance event.
2 System Development
The Duluth systems were developed by identify-ing collocations based on frequency counts obtained from the WaCky English corpus (Baroni et al., 2009), hereafter referred to as the corpus. The part of speech tags were removed from the corpus, and the text was converted to lower case. A set of 139 training pairs was provided by the task organizers that had been manually rated for compositionality. This gold standard data was used to select which measures of association would form the basis of the Duluth systems. Thereafter a separate set of 174 test pairs were provided by the organizers for evaluation.
2.1 Collocation Discovery
The Ngram Statistics Package (Text::NSP) (Baner-jee and Pedersen, 2003) was used to measure the association between the training pairs based on fre-quency count data collected from the corpus. All thirteen measures in the Ngram Statistics Package were employed, including the Log-likelihood Ra-tio (ll) (Dunning, 1993), Pointwise Mutual Informa-tion (pmi) (Church and Hanks, 1990), Mutual Infor-mation (tmi) (Church and Hanks, 1990), Poisson-Stirling (ps) (Church, 2000), Fisher’s Exact Test (leftFisher, rightFisher, and twotailed) (Pedersen et al., 1996), Jaccard Coefficient (jaccard), Dice Coef-ficient (dice), Phi CoefCoef-ficient (phi), t-score (tscore) (Church and Hanks, 1990), Pearson’s Chi-Squared Test (x2), and the Odds Ratio (odds).
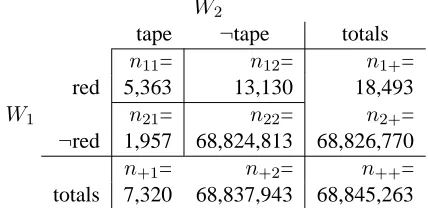
These measure the co-occurrence of word pairs (bigrams) relative to their individual frequencies and assess how likely it is that the word pair is occurring together by chance (and is therefore likely composi-tional) or has some significant pattern of occurrence as a pair (in which case it is non-compositional). More formally, many of these methods compare the observed empirical data with a model that casts the words in the bigram as independent statistical events. The measures determine the degree to which the observed data deviates from what would be ex-pected under the model of independence. If the ob-served data differs significantly from that, then there is no evidence to support the hypothesis that the bi-gram is a chance event, and we assume that there is some interesting or significant pattern that implies non-compositionality. In some cases the training and test pairs are not adjacent (e.g., reinvent wheel for reinvent the wheel), and so window sizes of 2, 4, and 10 words were used when measuring the asso-ciation between pairs of words. This means that 0, 2 and 8 intervening words were allowed, respectively. Frequency count data for the word pairs are tabu-lated as shown in the example in Figure 1. The vari-ableW1 represents the presence or absence of red
in the first position of each word pair, andW2
rep-resents the presence or absence of tape in the sec-ond position. This table tells us, for example, that
red tape occurs 5,363 times (n11), that red occurs
18,493 times (n1+), and that bigrams that contain
neither red nor tape occur 68,824,813 times (n22).
The total number of bigrams found in the corpus is 68,845,263 (n++). Note that these counts are based
on a window size of 2. Counts increase with a larger window size. If the window size were 10, thenn11
would tell us how many times red and tape occurred within 8 words of each other (in order).
W1
W2
tape ¬tape totals
n11= n12= n1+=
red 5,363 13,130 18,493
n21= n22= n2+= ¬red 1,957 68,824,813 68,826,770 n+1= n+2= n++=
[image:2.612.317.531.174.278.2]totals 7,320 68,837,943 68,845,263
Figure 1: Contingency Table Counts
2.2 Scoring Word Pairs
The training pairs were ranked according to each of the measures in Text::NSP, where high scores in-dicate that two words (w1 and w2) are not
occur-ring together by chance, and that there is a non-compositional meaning. However, high scores in the shared task meant exactly the opposite; that a word pair was highly compositional (and literal). In addi-tion, the fine grained scoring in the shared task was on a scale of 0 to 100, and it was required that partic-ipating systems use that same scale. Thus, the scores from the measures were converted to this scale as follows:
Let the maximum value of the Text::NSP mea-sure for all the pairs in the set under consideration be
max(m(W1, W2)), wheremrepresents the specific
measure being used. Then the score for each word pair is normalized by dividing it by this maximum value, and subtracted from 1 and then multiplied by 100. More generally, the fine grained score for any word pair (w1, w2) as computed by a specific
duluth-x system isdx(w1, w2)and is calculated as follows:
dx(w1, w2) = 100∗(1−
m(w1, w2) max(m(W1, W2))
) (1)
Table 1: Text::NSP Rank Correlation with Gold Standard - duluth-1 corresponds to t-score window 10, duluth-2 with pmi window 10 and duluth-3 with pmi window 2
Window Size
Measure 2 4 10
tscore 0.1484 0.2114 0.2674
tmi 0.1335 0.1908 0.2361
ll 0.1336 0.1913 0.2358
frequency 0.1865 0.2100 0.2126
ps 0.0992 0.1554 0.1874
x2 0.1157 0.1172 0.1654
phi 0.1157 0.1167 0.1646
jaccard 0.1253 0.1255 0.1602
dice 0.1253 0.1255 0.1602
odds 0.0216 0.0060 0.0257
pmi -0.0241 -0.0145 0.0143
rightFisher -0.1768 -0.0817 0.0740 leftFisher 0.1316 0.0686 -0.0870 twotailed -0.1445 -0.0651 -0.1064
2.3 Correlation of Word Pairs
Before the evaluation period, it was decided that duluth-1 (our flagship system) would be based on the measure of association that had the highest Spear-man’s rank correlation with the fine grained gold standard annotations of the training pairs. As can be seen from Table 1, that measure was the t-score based on a window size of 10.
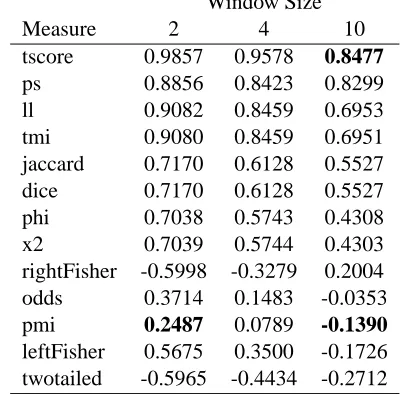
As an additional experiment, the ranking of the training pairs according to each measure in Text::NSP was compared to the frequency ranking in the corpus. As can be seen in Table 2, once again it was the t-score that had the highest correlation.
While the correlation with the training pairs by the t-score was encouraging, the correlation with frequency was something of a surprise, and in fact caused some concern. Could a measure that corre-lated so highly with frequency really be successful in measuring semantic compositionality? However, upon reflection it seemed that correlation with fre-quency might be quite desirable, and led to the for-mulation of a second hypothesis:
Very frequent word pairs are more likely to be compositional (i.e., highly literal) than are less frequent word pairs.
Table 2: Text::NSP Rank Correlation with Frequency -duluth-1 corresponds to t-score window 10, duluth-2 with pmi window 10 and duluth-3 with pmi window 2
Window Size
Measure 2 4 10
tscore 0.9857 0.9578 0.8477
ps 0.8856 0.8423 0.8299
ll 0.9082 0.8459 0.6953
tmi 0.9080 0.8459 0.6951
jaccard 0.7170 0.6128 0.5527
dice 0.7170 0.6128 0.5527
phi 0.7038 0.5743 0.4308
x2 0.7039 0.5744 0.4303
rightFisher -0.5998 -0.3279 0.2004 odds 0.3714 0.1483 -0.0353 pmi 0.2487 0.0789 -0.1390
leftFisher 0.5675 0.3500 -0.1726 twotailed -0.5965 -0.4434 -0.2712
The assumption that underlies this hypothesis is that the most frequent word pairs tend to be very literal and non-compositional (e.g., for the, in that) and it would (in general) be a surprise to expect a compo-sitional pair (e.g., above board, rip saw) to attain as high a frequency.
3 duluth-1 (t-score in a 10 word window)
The duluth-1 system is based on the t-score in a 10 word window, and was selected because of its high correlation to the gold standard annotations of the training pairs and to the frequency ranking of the training pairs. The t-score optimizes both of our previous hypotheses, which suggests it should be a good choice for measuring compositionality.
By way of background, the t-score (t) is formu-lated as follows (Church et al., 1991), using the no-tation introduced in Figure 1 :
t= n11√−m11
n11
(2)
wheren11 is the observed count of the word pair,
andm11is the expected value based on the
hypothe-sized model of independence between variablesW1
andW2. As such,
m11=
n1+∗n+1 n++
[image:3.612.90.286.107.316.2]If there is little difference between the observed and expected values, then the t-score is closer to zero (or even less than zero) and the pair of words can be judged to occur together simply by chance (i.e., the hypothesis of independence is true).
The t-scores for the test pairs were converted fol-lowing equation (1), and then submitted for evalu-ation. duluth-1 placed in the middle ranks in the fine grain evaluation according to mean distance, and was the top ranked system according to the label precision evaluation of coarse grained scoring.
4 duluth-2 (pmi with window size of 10)
In studying Tables 1 and 2, it’s clear that Point-wise Mutual Information (pmi) deviates rather sig-nificantly from frequency and the t-score. At the time of the evaluation, we did not know if our hy-potheses that motivated the use of the t-score would prove to be true. If they did not, it seemed sensible to include the most opposite measure to the t-score, as a kind of fail safe mechanism for our systems over-all. In addition, pmi has a fairly significant history of use in identifying collocations and features for other NLP tasks (e.g., (Pantel and Lin, 2002)), and so it seemed like a credible candidate.
pmi has a well known bias towards identifying words that only occur together, and tends to prefer less frequent word pairs, and this is why it diverges so significantly from the t-score and frequency. In-terestingly, pmi is also based on the same observed and expected valuesn11 andm11 as used in the
t-score (and many of the other measures), and is cal-culated as follows:
pmi=logn11 m11
(4)
If there is little difference between the observed and expected values, then pmi tends towards 0 and we treat the word pairs as independent and compo-sitional.
duluth-2 relies on a window size of 10, since it di-verges dramatically from the t-score and frequency.
5 duluth-3 (pmi with window size of 2)
duluth-3 is a very close relative of duluth-2, and dif-fers only in that it requires word pairs to be adjacent. Given the wider window sizes in duluth-2, it is clear
that if a pair has a high pmi score, they must only oc-cur (mostly) together. duluth-3 only considers adja-cent words, and so the words that make up the pairs may also appear elsewhere in the corpus. As such duluth-3 may tend to assign higher pmi scores than the more exacting duluth-2 (where high scores mean low compositionality). And in fact this is what oc-curred. In the coarse scoring scheme, duluth-1 only identified 2 low compositional word pairs, whereas duluth-2 identified 46 and duluth-3 identified 70.
Despite the difference in the window size the rank correlation between duluth-2 and duluth-3 is rela-tively high (.9330). Both performed comparably in the evaluation, being near the bottom of both the fine and coarse grained evaluations. By comparison, duluth-1 and duluth-2 have a relatively low rank cor-relation of .1756, and duluth-1 and duluth-3 have a modest correlation of .3438.
6 Conclusions
The Duluth systems seek to evaluate the degree to which measures of collocation are able to measure semantic compositionality as well. The results of this shared task suggest that the t-score is well suited to make coarse grained distinctions between high, medium, and low levels of compositionality, since duluth-1 was the top ranked system in the coarse grained evaluation. While this success might be considered surprising due to the simplicity of the approach, it should not be underestimated. There are two separate hypotheses that underly the t-score and its use in measuring semantic compositionality. These hold that word pairs with high measures of as-sociation are more likely to be non–compositional, and that more frequent word pairs are more likely to be compositional. Of the measures evaluated in this study, the t-score was best able to optimize both of these conditions.
7 Acknowledgements
References
S. Banerjee and T. Pedersen. 2003. The design, imple-mentation, and use of the Ngram Statistics Package. In Proceedings of the Fourth International Conference
on Intelligent Text Processing and Computational Lin-guistics, pages 370–381, Mexico City, February.
M. Baroni, S. Bernardini, A. Ferraresi, and E. Zanchetta. 2009. The WaCky wide web: A collection of very large linguistically processed web-crawled corpora.
Language Resources and Evaluation, 43(3):209–226.
C. Biemann and E. Giesbrecht. 2011. Distributional semantics and compositionality 2011: Shared task description and results. In Proceedings of DiSCo–
2011 in conjunction ACL HLT 2011, Portland, Oregon,
June. Association for Computational Linguistics. K. Church and P. Hanks. 1990. Word association norms,
mutual information and lexicography. In
Proceed-ings of the 28th Annual Meeting of the Association for Computational Linguistics, pages 76–83.
K. Church, W. Gale, P. Hanks, and D. Hindle. 1991. Us-ing statistics in lexical analysis. In U. Zernik, editor,
Lexical Acquisition: Exploiting On-Line Resources to Build a Lexicon. Lawrence Erlbaum Associates,
Hills-dale, NJ.
K. Church. 2000. Empirical estimates of adaptation: The chance of two noriegas is closer to p/2 than p2. In Proceedings of the 18th International Conference
on Computational Linguistics (COLING-2000), pages
180–186, Saarbr¨ucken, Germany.
T. Dunning. 1993. Accurate methods for the statistics of surprise and coincidence. Computational Linguistics, 19(1):61–74.
P. Pantel and D. Lin. 2002. Discovering word senses from text. In Proceedings of ACM SIGKDD
Confer-ence on Knowledge Discovery and Data Mining-2002.
T. Pedersen, M. Kayaalp, and R. Bruce. 1996. Signifi-cant lexical relationships. In Proceedings of the
Thir-teenth National Conference on Artificial Intelligence,