Munich Personal RePEc Archive
Are There Nutrient-based Poverty
Traps? Evidence on Iron Deficiency and
Schooling Attainment in Peru
Chong, Alberto and Cohen, Isabelle and Field, Erica and
Nakasone, Eduardo and Torero, Maximo
University of Ottawa, Duke University, CMF, IFPRI, IFPRI
October 2014
Online at
https://mpra.ub.uni-muenchen.de/61301/
Are There Nutrient-based Poverty Traps?
Evidence on Iron Deficiency and Schooling Attainment in Peru
Alberto Chong, Isabelle Cohen, Erica Field, Eduardo Nakasone and Maximo Torero∗
October 10, 2014
Abstract
A key question in development economics is whether nutritional deficiencies generate in-tergenerational poverty traps by reducing the earnings potential of children born into poverty. To assess the causal influence on human capital of one of the most widespread micronutrient deficiencies, supplemental iron pills were made available at a local health center in rural Peru and adolescents were encouraged to take them up via classroom media messages. Re-sults from school administrative records provide novel evidence that reducing iron deficiency results almost immediately in a large and significant improvement in school performance. For anemic students, an average of 10 100mg iron pills over three months improves average test scores by 0.4 standard deviations and increases the likelihood of grade progression by 11%. Supplementation also raises anemic students’ aspirations for the future. Both results indicate that cognitive deficits from iron-deficiency anemia contribute to a nutrition-based poverty trap. Our findings also demonstrate that, with low-cost outreach efforts in schools, supplementation programs offered through a public clinic can be both affordable and effective in reducing rates of adolescent IDA.
∗
1
Introduction
One of the fundamental questions in development economics is whether a significant fraction of the world’s poor are caught in nutrition-based poverty traps that make them likely to remain poor over generations. In particular, the poor are frequently deprived of the micronutrients they need to function at their physical optimum, which may affect their short- or long-run earn-ings potential through reduced productivity at work or in school. Although empirical evidence suggests limited potential for calorie-based poverty traps in less developed countries (largely because calorie consumption is sufficient in most regions of the world), it is possible that deficits of specific micronutrients contribute to cycles of poverty.
One potential culprit is underconsumption of the micronutrient iron. An estimated 50% of women and children in developing countries are believed to suffer from iron deficiency anemia (IDA), and adolescents are a particularly vulnerable subpopulation [World Health Organization,
2011].1 Iron deficiency, which decreases the circulation of oxygen in the blood, reduces aerobic capacity and hence may contribute to lower earnings among malnourished individuals.2 It is also believed to result in lower cognitive function, memory, and attention span, and as a result, may significantly increase the cost of human capital accumulation in impoverished settings, and hence contribute directly tointergenerational poverty traps.3 That is, if IDA significantly lowers the return to schooling, it may be impossible for those who are too poor to afford an iron-rich diet to pull their children out of poverty by investing in their human capital.
We can learn about the potential for IDA to trap families in a low-human-capital equilib-rium by investigating whether reducing IDA has a causal effect on schooling attainment, which would indicate that returns to schooling investment are significantly lower for anemic individu-als. Indeed, a number of studies provide evidence that iron-deficient children and adolescents, particularly those who qualify as anemic, perform worse on cognitive tests (Luo et al., 2011;
1
This is because iron needs are especially high during periods of physical growth. The highest rates of IDA are found among children under 5 and pregnant women, followed by female adolescents between 12 and 15 [World Health Organization,2011].
2
Specifically, iron deficiency affects physical activity through two pathways. First, as hemoglobin levels decline, the maximum amount of oxygen that the body can use (aerobic capacity) declines. Second, as iron stores are depleted, the amount of oxygen available to muscles declines, reducing endurance, and the heart must work harder to produce the same amount of activity.
3
Pollitt et al.,1985; Hutchinson et al., 1997; Webb and Oski, 1973;Halterman et al.,2001). In addition, there is strong evidence that lower scores on tests of memory, learning and attention can be improved or even reversed with short-term iron supplementation.4 This evidence has motivated the World Health Organization (WHO) to recommend that countries with endemic anemia adopt costly large-scale Weekly Iron and Folic Acid Supplementation (WIFS) programs for children and adolescents, and several countries have embarked on such efforts over the past decade.5
However, while the benefit of supplementation on cognitive functioning has been well-established with clinical trials, the contribution of these findings to our understanding of poverty persistence is less straightforward, and depends on one key outstanding question. Namely, does reducing iron deficiency have a large enough effect on cognition to result in tangible increases in human capital accumulation? Although the tests employed in experimental studies of iron supplementation are often similar to scholastic achievement tests, the benefits of supplementation on human capital accumulation may be far lower than the benefits on cognitive functioning measured in clinical settings. If in real life anemic students are motivated to engage in compensatory behaviors or exert extra effort in order to maintain rates of school progression, differences in performance captured in a clinical setting – where there is little incentive to exert effort on cognitive tests – will overstate improvements in actual schooling outcomes or learning that would result from reducing IDA. Put differently, it may be the case that family background and expectations of academic achievement are such overwhelming determinants of academic success that small changes in cognitive capacity have little effect on human capital attainment, even when such differences can be captured in a clinical trial.
The answer to this question is not only important for evaluating the returns to costly sup-plementation efforts such as WIFS, but is critical for understanding the myriad of ways in which micronutrient deficiencies contribute to poverty and underdevelopment. Previous research has shown the detrimental effect of iron deficiency on adult labor force productivity [Thomas et al.,
2006]6, but to date there is no rigorous evidence that IDA is an important contributing factor
4
See, for instance:Seshadri et al.[1982];Pollitt et al.[1985];Soemantri et al.[1985];Groner et al.[1986];Kashyap and Gopaldas[1987];Seshadri and Gopaldas[1989];Soemantri [1989];Bruner et al.[1996]. One large study in Thailand could not replicate the beneficial effects of iron supplementation found in other settings (Pollitt et al.,
1989;Sungthong et al.,2004). 5
See http://www.wpro.who.int/publications/docs/FORwebPDFFullVersionWIFS.pdf for a detailed overview of six such programs.
6
to low rates of human capital accumulation and hence an important source of intergenerational persistence of poverty in developing countries.7
A second outstanding question in the literature is how to make weekly supplementation programs for adolescents feasible in resource-constrained settings. The evidence from clinical studies indicates that iron supplementation is cost-effective as long as it reaches those who are anemic. Yet targeting is difficult to achieve given that diagnosis through blood tests is rarely feasible in impoverished settings. Furthermore, adolescents are a difficult population to reach for preventive care given their infrequent contact with health professionals. This fact has motivated many policy-makers to favor expensive doorstep policy approaches that deliver pills directly to adolescents. These policies are out of reach for many local governments and likely not even cost-effective. Meanwhile, little effort has gone into evaluating whether supplement programs can be made affordable with simple interventions that encourage adolescents to actively seek preventive health services offered through a public clinic. Since iron is only beneficial for those who suffer from IDA, there is a particular need to establish whether streamlined approaches can reach enough of those in need on a high-enough frequency basis to be efficacious.
Our study addresses both of these gaps in the current literature by providing iron sup-plements through a village health clinic in rural Peru, and implementing a simple, scalable classroom-based media program that encourages adolescents to take up the supplements. The goals of the study were twofold: To evaluate the contribution of low dietary iron intake to hu-man capital attainment by measuring the causal effect of reducing adolescent anemia on school progression, and to assess whether adolescents in disadvantaged settings could be encouraged to take advantage of preventive health programs offered through the village clinic with a low-cost intervention. With respect to the first objective, our study breaks new ground in tracking, in ad-dition to clinical assessments of anemia and cognitive function, administrative records of school performance and progression, and thereby provides rigorous evidence on the causal influence of IDA on human capital accumulation.
Our clinical test results corroborate previous evidence on the impact of IDA on cognitive
poverty traps. For a comprehensive review seeStrauss and Thomas[1998]. 7
functioning, with the gains concentrated among visualization and analytical skills. More im-portantly, administrative data from schools provide strong evidence that the improvements in cognitive skills are substantial enough to have a significant influence on school performance and learning. For students who were anemic at baseline, an average of 10 100mg iron pills taken over three months improves average test scores by 0.4 standard deviations and increases the likelihood of grade progression by 11%.
In addition, we provide novel evidence on the positive influence of iron supplementation on aspirations of upward mobility. In particular, iron supplementation is associated with a 16% improvement in previously anemic students’ aspirations for the future. This result suggests that small changes in own ability are salient and that aspirations adapt quickly to changes in performance, which is encouraging for interventions that target older children and young adults. It also suggests that human capital gains are likely to be compounded by improvements in intrinsic motivation to succeed in school among those who benefit from reductions in IDA. More fundamentally, both results indicate that learning deficits from IDA have the potential to generate a nutrition-based poverty trap. In particular, they indicate that returns to schooling are lower for impoverished students simply because they are nutrient deprived, which implies a non-convexity in the returns to schooling with respect to income.
In addition to providing the first experimental evidence on iron supplementation and school progression, our study demonstrates that, by introducing a low-cost encouragement intervention, supplementation programs offered through a public clinic can be effective in reaching anemic adolescents in impoverished settings. Although targeting is far from perfect, a sufficient number of iron deficient adolescents take up pills at a high enough frequency to observe a significant reduction in rates of IDA. Among anemic students, the reduction in IDA is 50% larger when me-dia messages are added to the supplementation program, which suggests that direct-to-patient marketing is an essential compliment to any clinic-level distribution scheme targeting adoles-cents.
benefits of media messages are further multiplied through spillover effects within families.
2
Study Design
2.1 Setting
Our study took place among all 219 students of one rural secondary school in the Cajamarca district of Peru during the 2009 school year. The burden of iron deficiency is high throughout the developing world, and Peru is no exception: A 2008 study by UNICEF found that 39% of adolescents in rural Peru are affected by anemia [UNICEF, 2008].8 Among students in our study, 42% of boys and 41% of girls were anemic at the onset of the study. Figure 1 shows the distribution of hemoglobin (Hg) levels among male and female students at baseline, along with the anemia cutoff points. The figure shows a high fraction of both male and female students below the cutoff for anemia, but also high densities of students slightly above both cutoff points, indicating that, while not necessarily anemic, the majority of both boys and girls in the study are vulnerable to iron deficiency.9
Overall, Cajamarca is one of the lowest performing districts in Peru based on UNICEF’s childhood development index [UNICEF, 2008]. With respect to schooling achievement, 91% of adolescents in Cajamarca have skills at least one grade below the basic level for their age-appropriate grade in math, which is 5 percentage points worse than the national average [UNICEF, 2008]. The students who participated in our study ranged in age from 11 to 19, and encompassed five secondary school grade levels. The distribution of students across grades is shown in Figure 2. Forty-eight percent of the sample was female, and there were slightly more males than females in most grade levels.10 Consistent with overall district performance, in our study school drop-out rates before high school completion (Grade 5) are relatively high: In the class that graduated in 2010, less than half of students on the roster in their first year
8
In contrast, in the United States (U.S.), only approximately 9% of females aged 12-19 years were anemic between 2003 and 2006 [Cogswell et al., 2009], and the Center for Disease Control’s National Health and Nutrition Examination Survey (NHNES) suggests that less than 7% of non-pregnant women of reproductive age in the United States are anemic [de Benoist et al.,2008].
9
Prior to our experiment iron supplements were not readily available through public or private clinics or stores, and there were no reports in our baseline survey of individuals consuming iron pills.
10
Figure 1: Hemoglobin Density at Baseline relative to Anemia Cutoff, by Gender
even entered their fourth year of school.11 Males and females drop out in roughly equivalent proportions.
2.2 Experiment
Our efforts to reduce anemia among adolescents in our study involved stocking the village clinic with iron supplements for ten weeks from October to December 2009, and training the local staff to distribute one iron pill free of charge to any adolescent who requested one in person on any day of the study.1213 The nurse was also trained to discuss the benefits of iron supplementation for anemic individuals, although she did not provide any diagnostic services to better target pills towards those who were or were likely to be anemic. The health center was located in the
11
Similar dropout rates were found in adjacent classes. 12
To record take-up, the nurse had access to a computerized database that contained all students’ IDs, pictures and names. In addition, she was told to make the pill available to anyone not in the database who fell into that age category.
13
Figure 2: School Enrollment by Grade and Gender
village center, 0.3 kilometers from the school, and was open from 10am to 5pm Monday through Saturday.14
Our collaboration with a public health clinic meant that iron pills had to be made equally available to all adolescents in the village. Hence, in order to create experimental variation, the study used an encouragement design that randomly varied students’ exposure to promotional materials emphasizing the benefits of supplementation and encouraging them to visit the clinic daily to take an iron pill. In particular, over the course of the 10-week study, students were exposed multiple times to one of the following three 1-2-minute videos: The first video showed a popular soccer player encouraging iron supplements to maximize energy; the second showed a doctor encouraging iron supplements for overall health; and the third “placebo” video did not mention iron at all and instead featured a dentist encouraging oral hygiene.15 The first two videos served both to explain the benefits of iron to the children, and to remind them to take the iron pills. Each video lasted between 70 and 100 seconds, and on average students viewed
14
We monitored the presence of a nurse through her logins on the laptop, which revealed that she was continuously present during business hours throughout the study period.
15
the same one of the three videos 5.75 times over the 10-week period. Appendix FigureA.1shows the distribution of video sessions across the entire sample.16
[image:10.612.150.483.289.532.2]The videos were shown in conjunction with a school program that provided students free access to the Internet during scheduled sessions in the classroom after school hours.17 Videos were shown to students upon logging into the computer and before they could access the Internet, so there was strong incentive for students to sit through the videos.18 Within each grade, students were randomly assigned to one of the three videos, with one third assigned to each. Randomization was achieved at the student level by assigning each student a unique login code that triggered one of the three videos to be shown upon each login.
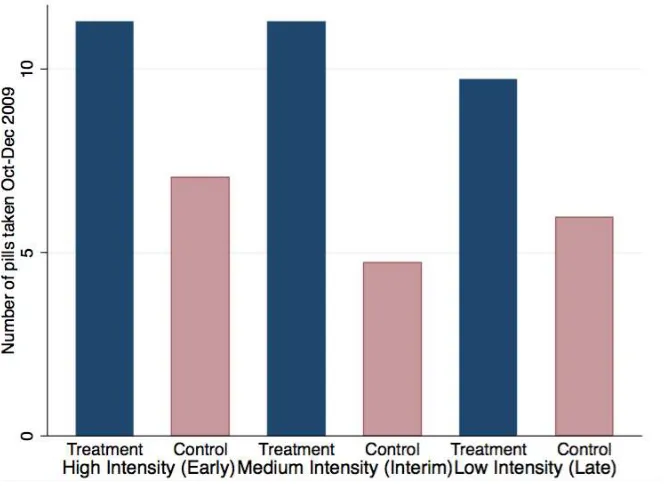
Figure 3: Pill Take-up by Number of Video Sessions
Throughout the analysis, students shown the first two videos are considered to be in the treatment group, and students shown the third video are considered to be in the control group. Students were also assigned to different intensities of exposure by randomly varying the number
16
Extensive computer logs tracked both log-ins and site access of each student, making it possible to calculate the number of sessions attended by each student and, consequently, the number of times they viewed the encouragement videos and the amount of time they spent on the computers.
17
The sessions, which included an on-site computer instructor to help students, were scheduled after school and on Saturdays. Students were randomly assigned to particular sessions of 20 students each, and the schedule was posted on the school bulletin board.
18
of computer sessions they could attend. However, since the difference across treatment and control video groups in terms of take-up of pills is relatively constant across degrees of exposure (Figure3), in this analysis we differentiate treatment only by the content of the video, grouping together all students assigned to the iron videos into the treatment group and all students assigned to the placebo video into the control group. As there was no difference across treatment and control in terms of the number of computer sessions attended, we can safely infer that our experimental manipulation isolates the influence of public health messaging and not of computer activity more generally (Appendix FigureA.1).
Data for the experimental analysis come from baseline and follow-up surveys conducted one month prior to and 10 weeks after the onset of supplementation efforts, and academic records from the 2009 school year.19 Both baseline and follow-up involved a questionnaire administered individually to each student that included questions on academic aspirations and perceptions, subjective health, and daily activities, and a separate questionnaire administered to the household head of each student (or closest relative living in the same home) that largely captured information on family background and socio-economic status.20
In addition, students in our study played video games designed to measure cognitive ability. The Wii game, Big Brain Academy: Wii Degree, encompassed five distinct tests of cognitive ability: identification, memorization, analysis, computation, and visualization. The games were played by students while they were at school in December 2009. Finally, anthropometric data were collected from each study subject at baseline (September 2009) and follow-up (December 2009) by the nurse at the health clinic, including height, weight, abdominal circumference, and blood hematocrit levels, a common means of determining anemia.21
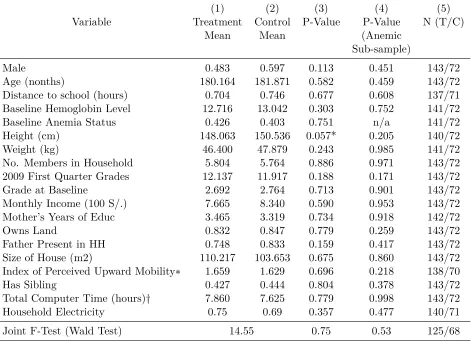
Table 1 presents summary statistics from our sample of students. Overall, the students come from relatively impoverished households as indicated by household income, maternal education, electrification and household size. Still, it is worth noting that the sample is fairly representative
19
The baseline survey was administered in August 2009 and the follow-up survey was conducted in December 2009, and academic records are from December 2009.
20
To obtain informed consent, before the collection of the baseline survey data, parents were gathered in the school and explained the basic objectives of the study. A physician explained that we would collect blood samples to measure nutrition, along with the minimal risk involved in this procedure. The following day, consent forms for participation were delivered to students at school, who were asked to bring them back with parents’ signature (whether affirmative or negative). Only two students failed to return the consent form, and were excluded from the study.
21
Table 1: Summary Statistics by Treatment Group
(1) (2) (3) (4) (5)
Variable Treatment Control P-Value P-Value N (T/C)
Mean Mean (Anemic
Sub-sample)
Male 0.483 0.597 0.113 0.451 143/72
Age (nonths) 180.164 181.871 0.582 0.459 143/72
Distance to school (hours) 0.704 0.746 0.677 0.608 137/71 Baseline Hemoglobin Level 12.716 13.042 0.303 0.752 141/72
Baseline Anemia Status 0.426 0.403 0.751 n/a 141/72
Height (cm) 148.063 150.536 0.057* 0.205 140/72
Weight (kg) 46.400 47.879 0.243 0.985 141/72
No. Members in Household 5.804 5.764 0.886 0.971 143/72
2009 First Quarter Grades 12.137 11.917 0.188 0.171 143/72
Grade at Baseline 2.692 2.764 0.713 0.901 143/72
Monthly Income (100 S/.) 7.665 8.340 0.590 0.953 143/72
Mother’s Years of Educ 3.465 3.319 0.734 0.918 142/72
Owns Land 0.832 0.847 0.779 0.259 143/72
Father Present in HH 0.748 0.833 0.159 0.417 143/72
Size of House (m2) 110.217 103.653 0.675 0.860 143/72
Index of Perceived Upward Mobility∗ 1.659 1.629 0.696 0.218 138/70
Has Sibling 0.427 0.444 0.804 0.378 143/72
Total Computer Time (hours)† 7.860 7.625 0.779 0.998 143/72
Household Electricity 0.75 0.69 0.357 0.477 140/71
Joint F-Test (Wald Test) 14.55 0.75 0.53 125/68
∗Index of Perceived Upward Mobility is an index of whether the student plans to leave their hometown after graduation, and whether they plan to continue their education after graduation.
†Total Computer Time refers to the number of hours the student spent on a computer through the program.
ofruralPeru in terms of overall poverty and anemia. Table 1 also reveals that random assignment to the experimental arms achieved comparison groups that are balanced on observable baseline characteristics. Importantly, three key outcomes in the study – iron deficiency, academic grades and perceptions of upward mobility – are almost identical across treatment and control groups at baseline. Only one out of eighteen variables – height – is imbalanced across treatment and control at a level approximating statistical significance, and the difference is small in magnitude and negative in sign (individuals assigned to the treatment group are shorter), indicating it would bias downward rather than upward experimental estimates of the causal effect of iron supplements on health.22 An F-test of joint significance confirms that the two samples are balanced on observables at baseline. Furthermore, the sample is balanced on all observables among the subsample of students that are anemic at baseline (column 4), among whom we expect the treatment effects to be concentrated and on which we conduct our primary subgroup analysis.
2.2.1 Take-up of iron
Throughout the distribution period, the nurse who distributed pills in the clinic carefully tracked each student’s name and unique ID, the date of the visit, the time of the visit, and whether the student was given an iron pill. Overall, the experiment was successful in distributing iron pills to study subjects, although take-up was far from universal. On average, students received 9.3 pills over the course of the study. Seventy-six percent of students went to the clinic at least once to receive an iron pill, and 53% went at least 5 times, and so received at least 500 mg of iron over 10 weeks. Thus we estimate that at least half of the sample received enough iron to improve health status and potentially improve cognition. Although below the official recommended dose, several studies conducted among school-aged children have demonstrated the efficacy of an intermittent iron supplementation schedule of at least 60 mg per week for 8 weeks [Schultink et al.,1995].23
Furthermore, as shown in Table 2, although the manipulation was relatively subtle, our encouragement design was successful in generating significant differences across experimental
22
In particular, if the height difference reflects underlying differences in socio-economic status we would expect those in the treatment group to have lower and not higher school performance in the absence of the intervention. 23
Table 2: Number of Pills Taken
(1) (2) (3) (4) (5)
Pills Taken ≥500 mg iron
Treatment 4.732∗∗∗ 4.237∗∗∗ 0.177∗∗ 0.219∗∗
(1.515) (1.465) (0.0715) (0.0937)
Treatment: Soccer 3.949∗∗
(1.760)
Treatment: Physician 5.484∗∗∗
(1.742)
Male Student -2.411∗
(1.390)
Monthly Income (100 S/.) -0.0175
(0.0809)
Time (hr.) to School -4.063∗∗∗
(1.033)
Age in Months -0.133∗∗
(0.0590)
Anemic at Baseline x Treatment -0.0980
(0.146)
Anemic at Baseline -0.000767
(0.121)
N. of obs. 215 215 215 215 215
Control Mean 5.944 5.944 5.944 0.417 0.417
Standard errors in parentheses Full sample from cajamarca study.
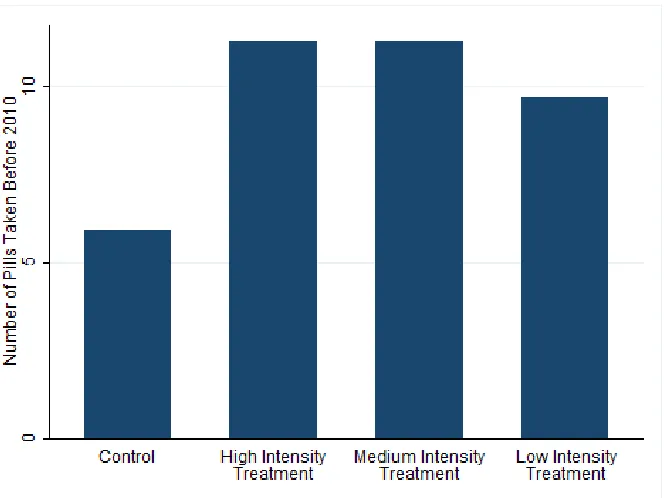
Figure 4: Pill Take-up by Exposure Intensity
arms in take-up of iron pills. On average, students assigned to the treatment took roughly 80% more pills than the control group, a difference that was strongly significant with and without controls (column 1, column 3). Furthermore, approximately 42% more students in the treatment group took at least 500 mg of iron over the course of the study, a level that has been demonstrated in previous studies to reverse iron deficiency among the anemic.24 As shown in column 4, among the treatment group, 60% of students took at least 500 mg of iron (the minimum that has been shown in existing studies to be effective in reducing anemia), while among the control group that number was only 42%.25 Column 5 shows that anemic students were equally as likely as non-anemic students to take this level of supplementation in both treatment and control, which makes sense given that students were not informed about the results of theirHg tests.
These results demonstrate that regularly watching short videos that focused on the benefits of iron and reminded children to take the iron pills led to a significant increase in the number of pills taken. However, the exact content of the videos did not seem to make a difference. As
24
A study of female Indonesian adolescents in Indonesia also found improved hemoglobin concentrations following administration of 480 mg of iron over a 2 month period [?].
25
seen in column 2, the average difference in take-up between the two treatment videos was close to zero, although we cannot rule out potential compositional changes in the set of responders that depend on video content. In addition to treatment exposure, we observe that age, gender and distance to town center, but not income, are strong predictors of take-up (column 3). In particular, older girls living close to the clinic are most likely to seek iron pills, the first two factors contributing positively to the program’s ability to achieve optimal self-targeting without screening for anemia.
2.3 Econometric Specification
In the analysis that follows, we estimate a model with the following basic linear regression:
Yi =a+β1Ti+ωXi+e (1)
where Yi is the outcome of interest; Ti is a binary variable for assignment to the treatment
group andXi is a set of controls.
A key feature of our empirical analysis is to look separately at the effect of supplementation on students who are anemic versus non-anemic at baseline, as is standard in the literature. This is because, for all outcomes, we anticipate no treatment effects on the non-anemic subpopulation who – based on evidence from existing studies – should receive no benefit from additional iron intake, especially with regard to cognitive outcomes.26 This allows non-anemic students to serve as a quasi-control group in our estimating equation in a difference-in-difference specification. In particular, to allow for differential response among the anemic and non-anemic students in our regression estimates and thereby test directly whether outcomes change only for those who are anemic at baseline, iron status at baseline is modeled as a linear spline function with a knot at theHg cutoff for anemia:
Yi =a+β1Ti+β2Ai+β3Ti∗Ai+ωXi+e (2)
In the above specification, Ai represents a linear spline for baseline iron deficiency, which takes on a value of 0 if the student was not anemic at the time of the baseline, and is a continuous
26
Several studies show that the provision or encouragement of iron pills only substantively affects those who are already anemic. These include: Falkingham et al.[2010],Bobonis et al.[2006],Soemantri [1989],Gera et al.
variable representing the severity of anemia in terms ofHglevel if the student was anemic at the time of the baseline. Ti∗Ai is an interaction between the binary treatment assignment variable
and the anemic spline. That is, we assume the dose-response to iron supplementation increases linearly below the anemia threshold with no predicted response above the threshold for iron deficiency. Because the treatment effect may not be linear in Hg deficiency below the cutoff for outcomes other than IDA status and cognitive gains, for all other outcomes we estimate a simpler specification in whichAi is simply an indicator of anemia at baseline andβ3captures the average treatment effect on the anemic subpopulation.27 In both cases, we test the hypotheses that ˆbeta1= 0 and ˆbeta3 >0.
In accordance with the WHO guidelines on anemia, the threshhold level of hematocrit at or below which a student is considered to be in the anemic subsample differs for male and female participants. Male students are considered anemic at 13g/cc hemoglobin or below, whereas fe-male students are considered anemic at 12g/cc hemoglobin or below [World Health Organization,
2001]. To account for any slight imbalances and increase the precision of our treatment effect estimates, all regressions control for gender and grade, which are first-order determinants of both anemia and schooling outcomes. In addition, we present regression results for all outcomes with and without the following additional control variables for socio-economic status, measured at baseline: total household labor income, whether the household has access to electricity, and mother’s years of schooling. Since performance measures can be influenced by differences in grading standards or practices across teachers, in all regressions we also include class fixed effects.
3
Results and Discussion
3.1 Anemia and Cognitive Function
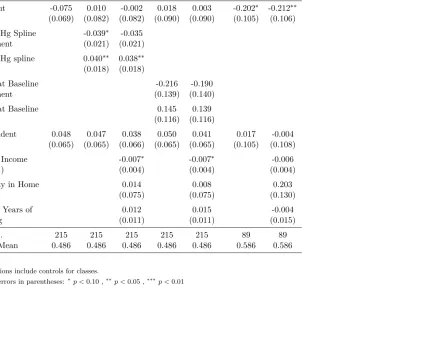
We begin by exploring in Table 3 the impact of treatment on reductions in iron deficient anemia and related improvements in cognitive functioning, the channel through which supplementation has the potential to improve school performance. The first outcome of interest is a dummy indicator of whether a student was anemic according to hemoglobin tests measured at endline. Although the overall rate of anemia is not significantly lower in the treatment group at
follow-27
Figure 5: Hemoglobin Density at Endline relative to Anemia Cutoff, by Gender and Treatment
up, media messages succeeded in reducing anemia among students who were sufficiently iron depleted at baseline (columns 2-5). In particular, previously anemic students exposed to the treatment were approximately 34% less likely to be anemic at the time of the follow-up survey. This result is consistent in magnitude to the effects of the intervention on take-up of iron pills. Figure 5 shows the distributions of hemoglobin levels at endline across control and treatment groups. Distributions for both boys and girls in the study are shifted rightwards, revealing substantial reductions in the density of both male and female students that are classified as anemic.
We do not find any significant treatment effect on self-reported measures of physical health that were collected at follow-up, including days of school missed due to illness, endurance (num-ber of minutes individual can run), or daily hours of sleep (Appendix Tables A.1, A.2, and
Table 3: Anemia
Full Sample Subsample
(1) (2) (3) (4) (5) (6) (7)
Treatment -0.075 0.010 -0.002 0.018 0.003 -0.202∗ -0.212∗∗
(0.069) (0.082) (0.082) (0.090) (0.090) (0.105) (0.106)
Baseline Hg Spline -0.039∗ -0.035
x Treatment (0.021) (0.021)
Baseline Hg spline 0.040∗∗ 0.038∗∗
(0.018) (0.018)
Anemic at Baseline -0.216 -0.190
x Treatment (0.139) (0.140)
Anemic at Baseline 0.145 0.139
(0.116) (0.116)
Male Student 0.048 0.047 0.038 0.050 0.041 0.017 -0.004
(0.065) (0.065) (0.066) (0.065) (0.065) (0.105) (0.108)
Monthly Income -0.007∗ -0.007∗ -0.006
(100 S/. ) (0.004) (0.004) (0.004)
Electricity in Home 0.014 0.008 0.203
(0.075) (0.075) (0.130)
Mother’s Years of 0.012 0.015 -0.004
Schooling (0.011) (0.011) (0.015)
N. of obs. 215 215 215 215 215 89 89
Control Mean 0.486 0.486 0.486 0.486 0.486 0.586 0.586
All regressions include controls for classes.
Standard errors in parentheses: ∗p <0.10 ,∗∗ p <0.05 ,∗∗∗p <0.01
Table 4: Cognitive Function
Full Sample Subsample
(1) (2) (3) (4) (5) (6) (7)
Treatment 30.055 5.804 -1.953 -8.637 -13.471 86.639∗∗ 80.765∗∗
(24.654) (29.637) (28.452) (32.112) (30.825) (40.980) (39.675)
Baseline Hg Spline 11.549 12.427∗
x Treatment (7.766) (7.470)
Baseline Hg spline -10.142 -11.361∗
(6.580) (6.345)
Anemic at Baseline 93.629∗ 90.963∗
x Treatment (49.772) (47.865)
Anemic at -82.755∗∗ -89.455∗∗
Baseline (41.262) (39.616)
Male Student 64.378∗∗∗ 62.536∗∗∗ 66.784∗∗∗ 63.090∗∗∗ 67.356∗∗∗ 110.789∗∗∗ 102.739∗∗
(23.381) (23.596) (22.690) (23.317) (22.403) (40.975) (40.263)
Monthly Income -0.307 -0.229 -0.653
(100 S/. ) (1.289) (1.290) (1.599)
Electricity in Home 78.709∗∗∗ 81.338∗∗∗ 59.011
(25.760) (25.621) (48.032)
Mother’s Years of 12.328∗∗∗ 11.960∗∗∗ 17.540∗∗∗
Schooling (3.926) (3.890) (5.758)
N. of obs. 208 208 208 208 208 87 87
Control Mean 460.486 460.486 460.486 460.486 460.486 405.786 405.786
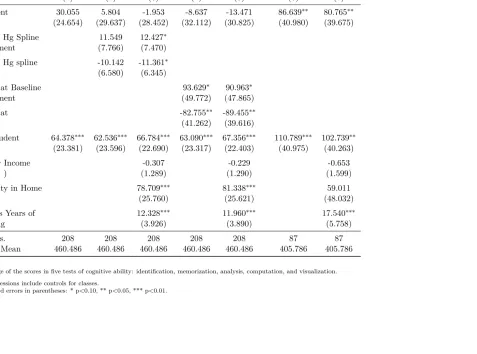
1Average of the scores in five tests of cognitive ability: identification, memorization, analysis, computation, and visualization.
All regressions include controls for classes.
Standard errors in parentheses: * p<0.10, ** p<0.05, *** p<0.01.
We next examine the influence of iron supplementation on cognitive functioning. As de-scribed in Section 2.2, cognitive ability is measured as the sum of a student’s score on the cognitiveWii game, with performance increasing in score.28 Once again, there is no significant
difference in average test scores across the treatment and control groups, but strong evidence of improvements in cognitive functioning among those who were iron deficient at baseline. As shown in columns 8-10, among the anemic subsample, treatment was associated with a 21% increase in cognitive test scores. This pattern of results is consistent with the fact that the vast majority of studies do not find cognitive improvements from increasing iron levels in non-iron deficient participants. Appendix Tables A.4, A.5,A.6, A.7, and A.8 show that these improve-ments were concentrated in games measuring analysis and visual identification skills, while there is no significant effect of treatment on scores in mathematics or memory games. Our findings of improvement in visual identification skills and the absence of findings on improvements in mathematical skills are broadly consistent with results from clinical studies on the impact of iron supplementation on cognitive abilities (Bruner et al.,1996;Lambert et al.,2002).29
Treatment effect estimates for both anemia and cognitive functioning are robust to the inclusion of family background controls.
3.2 School Performance
As described earlier, the main caveat of these and similar results in the literature on supple-mentation is that it is unclear the extent to which these changes in cognitive test scores are associated with improvements in school performance. Hence, we next examine the central out-come of interest in this study - whether these potentially small changes in cognitive functioning impact academic achievement. Our measure of academic achievement is a standardized average of a student’s grades from the fall semester in the following subjects: math, foreign language, social sciences, science and communications. The other five school subjects – art, religion, phys-ical education, vocational education, and human relations – are excluded from the grade index
28
In particular, we recorded individual scores for five different tasks performed inWii Brain Academy. Because the weights for each task are not obvious, we simply added the five scores such that every task is given the same weight in the overall score. Seven individuals, including two anemic individuals, were absent on the day that games were played, so are excluded from the regressions.
29
due to the fact that grades in these subjects are based largely on attendance and assignment completion, and hence are not anticipated to be influenced by cognitive ability.30 As such, the excluded subjects form the basis of a placebo check in which we verify that there is indeed zero effect of treatment on grades in these subjects.
Given that the end of the study period coincided with the end of the 2009 academic year, we also measure grade promotion by whether a student who was enrolled in school at the end of the 2009 academic year proceeded to the next grade at the onset of the 2010 academic year, roughly three months after the study period ended. Although drop out during the school year is high, the vast majority of students who complete the academic year reenroll the following academic year (that is, drop out is concentrated during the first half of the academic year), so a reasonably accurate measure of promotion can be constructed from school records in 2010.
Table5 suggests that the increased take-up of iron pills lead to a marginal but insignificant increase in grades across the full sample. However, consistent with all previous results, treatment has a large and significant impact on grades for students who are anemic at baseline (column 2). Average grades of the treated anemic subsample improved over 0.45 standard deviations (columns 4-5) and the result is statistically significant. This is also reflected in the significant positive coefficient estimate on the interaction between treatment and level of iron deficiency in columns 2 and 3. Although we did not make any predictions as to which subjects would be improved by the treatment, a post-hoc breakdown is available in Appendix Tables A.9, A.10,
A.11, A.12, and A.13. The improvements were concentrated in English (foreign language), science and social science classes, although the coefficients on treatment are positive across all subjects. Reassuringly, there is no indication of a treatment effect of iron supplementation among the subpopulation of non-anemic students, who provide a form of quasi-control group in that they should not experience any physiological benefits from greater iron availability. This provides evidence against Hawthorne effects contributing to the change in outcomes, which is always a concern in unblinded experiments.
30
Table 5: Grades and Promotion Outcomes
(1) (2) (3) (4) (5) (6) (7) (8) (9) (10)
Grades Grade Promotion
Full Sample Subsample Full Sample Subsample
Treatment 0.091 -0.089 -0.108 0.455∗∗ 0.434∗∗ 0.0712∗ 0.0851∗ 0.0628 0.114∗ 0.105∗
(0.140) (0.182) (0.182) (0.218) (0.215) (0.0366) (0.0443) (0.0457) (0.0572) (0.0582)
Anemic at Baseline 0.451 0.478∗ -0.00640 -0.00475
x Treatment (0.283) (0.284) (0.0114) (0.0116)
Anemic at Baseline -0.413∗ -0.446∗ 0.00352 0.00214
(0.234) (0.235) (0.00953) (0.00970)
Male Student -0.454∗∗∗ -0.457∗∗∗ -0.464∗∗∗ -0.283 -0.338 -0.0117 -0.00989 -0.00609 0.0729 0.0650
(0.132) (0.132) (0.133) (0.217) (0.218) (0.0348) (0.0354) (0.0357) (0.0571) (0.0591)
Monthly Income (100 S/.) -0.004 -0.010 -0.00120 -0.00183
(0.008) (0.009) (0.00204) (0.00235)
Electricity in Home 0.000 0.171 0.0255 0.0886
(0.153) (0.264) (0.0419) (0.0722)
Mother’s Years of Schooling 0.054∗∗ 0.082∗∗∗ 0.00755 0.00866
(0.023) (0.031) (0.00612) (0.00842)
N. of obs. 215 215 215 89 89 206 206 206 86 86
Control Mean 11.51 11.51 11.51 11.12 11.12 0.886 0.886 0.886 0.862 0.862
1. Standard errors (in parentheses). All regressions include dummy controls for classes.
2. Average grades of five subjects (math, foreign language, social science, science, and communication) in the third and fourth quarters of 2009. 3. Averages have been standardized (Yi−µy)/σy.
4. Control mean and standard deviation of the original (non-standardized) grades.
∗p <0.10,∗∗ p <0.05,∗∗∗ p <0.01
Anemic students exposed to promotional videos were also considerably more likely to be promoted to the next grade level in 2010 (columns 6-10).31 These results hold weakly across the full sample, but the gains are clearly concentrated and driven by the anemic subsample. Based on the control mean, anemic students are less likely than non-anemic students to advance to the next grade (86% versus 91%). However, anemic students in the treatment, whose likelihood of grade promotion increased by 11% on account of iron supplements, achieved a rate of promotion slightly higher than non-anemic students.32
3.3 Aspirations
Our final outcome of interest is the impact of iron supplementation on students’ aspirations for the future. We construct a measure of perceived upward mobility based on two outcomes from the student survey: 1) whether a student intended to leave his or her home town after high school and 2) whether a student intended to continue in either college or technical school following graduation from secondary school. The index takes on a value of 0, .5 or 1 based on students’ answers to these two questions. At baseline, 82% of students reported planning to leave town after high school and 83% of students reported planning to attend college or technical school, and 68% report both.
The regression results reported in TableA.17reveal that iron supplementation also brought about a significant increase of 11% in perceived upward mobility. Consistent with the previous pattern of results, the effect is increasing in level of iron deficiency at baseline, although the slope is only significant in the specification with family background controls. Among previously anemic students, treatment results in a 27% increase in expectations for the future and the effect is significant at the 1% level. However, only one of the individual measures – leaving town – is significant on its own. While it is possible that the information provided in the videos reinforced
31
Grade progression is gleaned from class records from the 2010 academic year. Students in Grade 5 who completed all 4 quarters of the year and do not appear in the roster in 2010 are assumed to have progressed. Nine students (3 anemic) below Grade 4 fail to reenroll and are thus treated as missing, as it is difficult to determine whether they would have progressed had they not dropped out. However, since there is no significant treatment effect on whether students leave school at the end of the 2009 school year (Appendix Table A.16), this assumption is unlikely to bias the results. Moreover, the results are robust to calculating based on grades whether each of these 9 individuals appears eligible to progress to the next grade, and to assuming that students that completed Grade 5 but who failed at least 1 class do not progress.
32
supplement-takers’ beliefs about the returns to iron pills and hence contributed to changes in their perceptions of economic mobility, the fact that changes in beliefs are only experienced by anemic students who take pills (and anemia is likely to be unobservable to the student) suggests that at least some of the effect is a response to real improvements in cognition or academic achievement.
This result is striking because it indicates that not only are small differences in own cogni-tive ability immediately salient to individuals, but that aspirations for the future adapt almost immediately to changes in ability. One could imagine that self-confidence is far more entrenched and reinforced by parental and teacher expectations and perceptions of ability, which are un-likely to adjust quickly to treatment exposure. If aspirations are an important determinant of achievement, this suggests that small differences in cognitive ability have the potential to help individuals attain economic mobility even when the reversal occurs relatively late in life when individual identity is fairly well formed.
Table 6: Index of Perceived Upward Mobility
(1) (2) (3) (4) (5) (6) (7) (8) (9)
Index of Perceived Upward Mobility Leave Hometown Continue School
Full Sample Subsample
Treatment 0.077∗ 0.010 0.020 0.175∗∗∗ 0.170∗∗∗ 0.289∗∗ 0.297∗∗ 0.0645 0.0489
(0.042) (0.054) (0.055) (0.0616) (0.0642) (0.110) (0.115) (0.0753) (0.0775)
Anemic at Baseline 0.160∗ 0.154∗
x Treatment (0.086) (0.087)
Anemic at Baseline -0.102 -0.100
(0.072) (0.073)
Male Student -0.019 -0.022 -0.020 0.0454 0.0485 0.0232 0.0280 0.0600 0.0552
(0.040) (0.039) (0.040) (0.0608) (0.0657) (0.109) (0.117) (0.0754) (0.0803)
Monthly Income (100 S/.) 0.002 0.000530 0.000584 0.000532
(0.002) (0.00248) (0.00450) (0.00304)
Electricity in Home -0.078∗ 0.0127 -0.0655 0.113
(0.046) (0.0817) (0.142) (0.0990)
Mother’s Years of Schooling 0.000 -0.00298 0.00207 -0.00768
(0.007) (0.00929) (0.0168) (0.0113)
N. of obs. 202 202 202 81 81 82 82 82 82
Control Mean 0.731 0.731 0.731 0.660 0.660 0.462 0.462 0.846 0.846
1. Standard errors in parentheses. All regressions include dummy controls for classes.
2. Index of Perceived Upward Mobility is an index of whether the student plans to leave their hometown after graduation, and whether they plan to continue their education after graduation.
∗ p <0.10,∗∗ p <0.05,∗∗∗ p <0.01
3.4 Peer Effects
As shown in Table 7, we also see evidence of spillover effects of the media messages within households.33 Among students that had a sibling at the same school (42% of students), those whose sibling was randomly assigned to the intervention experienced a significant improvement in grades relative to those whose sibling was notover and abovethe direct benefit they experienced from being exposed to the messages themselves. This result is apparent in the full sample of students, and even larger when estimated on only the subset of households in which at least one sibling is anemic (columns 3-4). Among the anemic subsample, having a sibling treated had almost the same effect on grade attainment as did being treated alone, and was additive in own exposure to media messages.34 This impact is also reflected in analogous regressions on anemia
at endline (unreported): Having a sibling exposed to promotional videos is associated with a 31% reduction in amemia at follow-up, although the effect is noisily estimated.35
This suggests that not only are siblings sharing information about the media messages they receive (such that being exposed directly is indistinguishable from having a sibling exposed), but they are also increasing the likelihood of pill take-up through other channels such as encouraging one another to go to the clinic (such that there is an additional effect of having a sibling treated even when you were treated). This pattern implies that promotional videos are not only cheap on a per capita basis, but have a multiplier effect that makes them even more cost effective. That is, one individual’s exposure to a promotional message is equivalent to exposing more than one individual to that message by way of positive take-up externalities. These are likely to be particularly important among adolescents, whose decision to visit a clinic may be highly dependent on the take-up behavior of friends or siblings.
The results are consistent with a number of other findings in the literature that document significant positive peer effects on education outcomes, although the mechanism we highlight is different than that most often discussed in the literature on sibling spillovers.36 While most of
33
There may also be important peer effects among friends and neighbors, but we cannot observe those links in our data. Spillovers within classrooms are also possible, but there are too few classrooms in our data to investigate this empirically.
34
However it is worth pointing out that the estimates are not precise enough to rule out substantially smaller indirect (peer) effects relative to the direct effects.
35
Some of the higher overall treatment effect estimates are due to the fact that this subsample of students with siblings at school are relatively worse off in terms of family background, as is reflected in the significant negative coefficient estimate on the indicator for “Has Sibling”.
36
the existing literature emphasizes learning from peers, our results indicate that peer effects on pill take-up in this setting operate mainly through reducing transportation costs or encouraging imitation, which we deduce from the fact that sibling effects are equally large regardless of whether the second sibling has been exposed to the same information.
Table 7: Grade Outcomes with Siblings1
Full Sample Subsample
(1) (2) (3) (4)
Treatment 0.116 0.106 0.359∗∗ 0.341∗∗
(0.140) (0.142) (0.172) (0.159) Has Sibling 0.536∗∗∗ 0.478∗∗ 0.560∗∗∗ 0.399∗∗
in Treatment (0.199) (0.210) (0.198) (0.197) Has Sibling -0.421∗∗ -0.402∗ -0.428∗∗ -0.372∗
(0.201) (0.207) (0.170) (0.198) Male Student -0.454∗∗∗ -0.461∗∗∗ -0.265 -0.303
(0.121) (0.119) (0.184) (0.193)
Monthly Income -0.003 -0.008
(100 S/. ) (0.005) (0.005)
Electricity in Home -0.001 0.170
(0.192) (0.212)
Mother’s Years of 0.046∗∗ 0.065∗∗∗
Schooling (0.022) (0.023)
N. of obs. 215 215 89 89
Control Mean2 11.510 11.510 11.179 11.179 Standard Deviation2 1.261 1.261 1.051 1.051
1Average grades of five subjects (math, foreign language, social science, science, and communication) in the third and fourth quarters of 2009. Averages have been standardized (Yi−µy)/σy.
2Control mean and standard deviation of the original (non-standardized) grades.
All regressions include controls for classes.
Standard errors are clustered at the household level: * p<0.10, ** p<0.05, *** p<0.01.
3.5 Selective Take-up
Our results show that simple low-cost promotional materials can dramatically increase the take-up of iron pills made available through a public clinic. While only 35% of students who were not exposed to video messages promoting iron supplementation took up the minimum required dose (600mg) over the course of the study, 56% of those exposed to the videos took at least this much iron over the 10-week period. Among anemic students, the rate rose from 41% to 50%.
These rates mean that resource-constrained governments that are unable to deliver iron supplements directly to adolescents can achieve very high coverage simply by reminding students of the benefits of supplementation on a regular basis. This intervention could be scaled up fairly cheaply by providing video materials to be shown in classrooms, as was done in our experiment, through television spots aired at moments of prime adolescent viewership, or in public Internet kiosks.
Since the program achieved high but not universal coverage, one important question is whether media messages improve or worsen the targeting of supplements to those who have the potential to benefit. That is, what type of students are encouraged by media messages to take up iron pills on a high enough frequency basis to potentially matter for school performance? We can learn something about selection into treatment from a simple comparison of baseline observable characteristics across those who do and do not take up iron pills in the treatment versus the control group, which reveals how the average characteristics of responders changes when we include those who are influenced to take up pills from the clinic on account of media messages.
high performers in terms of school grades at baseline, but have relatively low aspirations for the future. Hence, while treatment does not succeed in encouraging those who are disproportionately anemic to seek supplements, it does not influence only those who are sufficiently iron replete. In this sense (reaching the relatively poor), the intervention manages to achieve some degree of positive self-targeting, which is a standard hurdle for information-based interventions given that they tend to work best among the relatively well-off.
Table 8: Five or Fewer Pills versus More than Five
Variable Treatment Group Control Group
≤5 Pills >5 Pills P-Value N ≤5 Pills >5 Pills P-Value N Diff-in-Diff
Mean Mean Mean Mean P-Value
Male 0.565 0.420 0.087* 62/81 0.617 0.560 0.644 47/25 0.557
Age (months) 184.474 176.864 0.029** 62/81 181.969 181.688 0.961 47/25 0.253
Distance to school (hours) 0.854 0.591 0.024** 59/78 0.827 0.587 0.175 47/24 0.914
Baseline Hemoglobin Level 12.617 12.792 0.634 61/80 13.326 12.507 0.139 47/25 0.129
Baseline Anemia Status 0.492 0.375 0.167 61/80 0.362 0.480 0.337 47/25 0.115
Height (cm) 149.049 147.301 0.241 61/79 151.830 148.104 0.103 47/25 0.458
Weight (kg) 47.126 45.846 0.405 61/80 48.902 45.956 0.144 47/25 0.525
No. Members in Household 5.806 5.802 0.990 62/81 5.574 6.120 0.288 47/25 0.347
2009 First Quarter Grades 11.900 12.343 0.021** 62/81 11.974 11.808 0.548 47/25 0.071
Grade at Baseline 2.855 2.568 0.209 62/81 2.745 2.800 0.869 47/25 0.397
Monthly Income (1000 S/.) 8.704 6.870 0.240 62/81 7.148 10.583 0.060* 47/25 0.042
Mother’s Years of Educ 2.952 3.862 0.084* 62/80 3.085 3.760 0.293 47/25 0.789
Owns Land 0.774 0.877 0.106 62/81 0.830 0.880 0.579 47/25 0.639
Father Present in HH 0.758 0.741 0.815 62/81 0.830 0.840 0.913 47/25 0.826
Size of House (m2) 115.581 106.111 0.656 62/81 110.468 90.840 0.192 47/25 0.755
Index of Perceived Upward Mobility∗ 1.672 1.649 0.799 61/77 1.543 1.792 0.083* 46/24 0.098
Has Sibling 0.419 0.432 0.880 62/81 0.447 0.440 0.957 47/25 0.896
Total Computer Time (hours)† 6.371 9.000 0.007*** 62/81 6.617 9.520 0.044** 47/25 0.872
∗Index of Perceived Upward Mobility is an index of whether the student plans to leave their hometown after graduation, and whether they plan to continue their education after graduation.
†Total Computer Time refers to the number of hours the student spent on a computer through the program.
∗ p <0.10,∗∗ p <0.05,∗∗∗ p <0.01
4
Conclusion
A key question in development economics is the degree to which nutrition-based poverty traps, which arise when economic outcomes are predetermined by the amount of nutrients an individual consumes, constrain households or regions from escaping poverty. Our results indicate that iron deficiency, which is thought to be the most prevalent micronutrient deficiency in the world, is a significant deterrent to human capital accumulation among adolescents in developing countries, and hence a potentially important barrier to economic growth.
Furthermore, our results indicate that brief media messages are a highly effective means of encouraging adolescents to take advantage of supplements made available through public clinics. In 1993, the World Health Organization (WHO) recommended actions for the development of assessment, advocacy, prevention, and control initiatives in most countries to reduce anemia among adolescent girls. Yet, while effective, national WIFS programs are extremely costly to implement and thus out of the question in many resource-poor settings. Furthermore, even when such programs are put into place, it may be difficult to reach adolescents who are not in school. Our results demonstrate that the passive distribution of iron supplements through health clinics can achieve very high rates of compliance among anemic adolescents with the addition of simple, low-cost media messages delivered on a regular basis. Similar programs could be implemented at scale in much of the world at a fraction of the cost of current WIFS recommendations.
References
Harold Alderman and Hoyt Bleakly. Child health and educational outcomes. In Paul Glewwe, editor, Education Policy in Developing Countries. University of Chicago Press, 2013. 7
Sarah Baird, Aislinn Bohren, Craig McIntosh, and Berk Ozler. Designing experiments to measure spillover and threshold effects. Working Paper, 2012. 36
Felipe Barrera-Osorio, Marriane Bertrand, Leigh Linden, and Francisco Perez-Calle. Improving the design of conditional cash transfer programs: Evidence from a randomized education experiment in colombia. American Economic Journal: Applied Economics, 3:167–195, 2012.
36
GH Beaton and GP McCabe GP. Efficacy of intermittent iron supplementation in the control of iron deficiency anaemia in developing countries: an analysis of experience: final report to the micronutrient initiative. Technical report, Ottawa: Micronutrient Initiative, 1999. 23
Gustavo J. Bobonis, Edward Miguel, and Charu Puri Sharma. Anemia and school participation. Journal of Human Resources, 41:692–721, 2006. 7,26
Ann B Bruner, Alain Joffe, Anne K Duggan, James F Casella, and Jason Brandt. Randomised study of cognitive effects of iron supplementation in non-anaemic iron-deficient adolescent girls. The Lancet, 348:992–996, 1996. 4,3.1
Mary E. Cogswell, Anne C Looker, Christine M Pfeiffer, James D Cook, David A Lacher, John L Beard, Sean R Lynch, and Laurence M Grummer-Strawn. Assessment of iron deficiency in us preschool children and nonpregnant females of childbearing age: National health and nutrition examination survey 2003-2006. American Journal of Clinical Nutrition, 89(13):1334–1342, 2009. 8
Bruno de Benoist, Eric McLean, Ines Egli, and Mary Cogswell. Worldwide prevalence of anaemia, 1993-2005. Technical report, World Health Organization, 2008. 8
Martin Falkingham, Asmaa Abdelhamid, Peter Curtis, Susan Fairweather-Tait, Louise Dye, and Lee Hooper. The effects of oral iron supplementation on cognition in older children and adults: a systematic review and meta-analysis. Nutrition Journal, 9(4), 2010. 26
Eliana Garces, Duncan Thomas, and Janet Currie. Longer term effects of head start. The American Economic Review, 92:999–1012, 2002. 36
Tarun Gera, H.P.S. Sachdev, Penelope Nestel, and Sudeep Singh Sachdev. Effect of iron supple-mentation of haemoglobin response in children: systematic review of randomised controlled trials. Journal of Pediatric Gastroenterology and Nutrition, 44:468–486, 2007. 26
Judith A. Groner, Neil A. Holtzman, Evan Charney, and E. David Mellitis. A randomized trial of oral iron on tests of short-term memory and attention span in young pregnant women. Journal of Adolescent Health Care, 7:44–48, 1986. 4
Jill S. Halterman, Jeffrey M. Kaczorowski, C. Andrew Aligne, Peggy Auinger, and Peter G. Szi-lagyi. Iron deficiency and cognitive achievement among school-aged children and adolescents in the united states. Pediatrics, 107, 2001. 1
S. E. Hutchinson, C. A. Powell, S. P. Walker, S. M. Chang, and S. M. Grantham-McGregor. Nutrition, anaemia, geohelminth infection and school achievement in rural jamaican primary school children. European Journal of Clinical Nutrition, 51:729–735, 1997. 1
Anthony Lambert, Karrin Knaggs, Robert Scragg, Patricia Metcalf, and David Schaaf. Effects of iron treatment on cognitive performance and working memory in non-anaemic, iron-deficient girls. New Zealand Journal of Psychology, 31:19–28, 2002. 3.1
Renfu Luo, Linxiu Zhang, Chengfang Liu, Qiran Zhao, Yaojiang Shi, Grant Miller, Elaine Yu, Brian Sharbono, Alexis Medina, Scott Rozelle, and Reynaldo Martorell. Anemia among students of rural china’s elementary schools: Prevalence and correlates in ningxia and qinghai’s poor countries. Journal of Health, Population and Nutrition, 29:471–485, 2011. 1
K. Macours and R. Vakis. Changing households’ investments and aspirations through social interactions: Evidence from a randomized transfer program in a low-income country. Policy Research Working Paper 5137, 2009. 3.3
Sarah Miller and Paul Connolly. A randomized controlled trial evaluation of time to read, a volunteer tutoring program for 8- to 9- year olds. Educational Evaluation and Policy Analysis, 35:23–37, 2013. 3.3
Trang Nguyen. Information, role models and perceived returns to education: Experimental evidence from madagascar. mimeo, MIT, 2008. 3.3
Ernesto Pollitt, AG Soemantri, F Yunis, and NS Scrimshaw. Cognitive effects of iron deficiency anemia. The Lancet, 325:158, 1985. 1,4
Ernesto Pollitt, Phongjan Hathirat, Nittaya J Kotchabhakdi, Lavon Missell, and Aree Valya-sevi. Iron deficiency and educational achievement in thailand. American Journal of Clinical Nutrition, 50:687–697, 1989. 4
Javaeria Qureshi. Additional returns to investing in girls’ education: Impact on younger sibling human capital. mimeo, University of Chicago, 2011. 36
W. Schultink, R. Gross, M. Gliwitz, D. Karyadi, and P. Matulessi. Effect of daily vs twice weekly iron supplements in indonesian preschool children with low iron status. American Journal of Clinical Nutrition, 61:111–115, 1995. 2.2.1
S Seshadri and T Gopaldas. Impact of iron supplementation on cognitive functions in pre-school and school aged children: the indian experience. American Journal of Clinical Nutrition, 50: 675–686, 1989. 4
S Seshadri, K Hirdoe, P Nalik, and S Malhotra. Behavioural responses of young anemic indian children to iron-folic acid supplements. British Journal of Nutrition, 48:233–240, 1982. 4
A.G. Soemantri. Preliminary findings on iron supplementation and learning achievement of rural indonesian children. American Journal of Clinical Nutrition, 50:698–702, 1989. 4,26
Rebecca J. Stoltzfus, Luke Mullany, and Robert E. Black. Iron deficiency anaemia. In Majid Ezzati, Alan D. Lopez, Anthony Rodgers, and Christopher J.L. Murray, editors,Comparative Quantification of Health Risks: Global and Regional Burden of Disease Attributable to Selected Major Risk Factors, pages 163–210. World Health Organization, 2004. 7
John Strauss and Duncan Thomas. Health, nutrition and economic development. Journal of Economic Literature, 36:766–817, 1998. 6
Rassamee Sungthong, Ladda Mo-Suwan, Virasakdi Chongsuvivatwong, and Alan F. Geater. Once weekly and 5-days a week iron supplementation differentially affect cognitive function but not school performance in thai children. The Journal of Nutrition, 134:2349–2354, 2004.
4
Duncan Thomas, Elizabeth Frankenberg, Jed Friedman, Jean-Pierre Habicht, Mohammed Hakimi, Jaswadi, Nathan Jones, Christopher McKelvey, Gretel Pelto, Bondan Sikoki, Teresa Seeman, James P. Smith, Cecep Sumantri, Wayan Suriastini, and Siswanto Wilopo. Causal effect of health on labor market outcomes: Experimental evidence from indonesia. On-Line Working Paper Series 070, California Center for Population Research, 2006. 1,26
UNICEF. Situation of children in peru. Technical report, Canadian International Development Agency, 2008. 2.1,2.1
Thomas E. Webb and Frank A. Oski. Iron deficiency anemia and scholastic achievement in young adolescents. The Journal of Pediatrics, 85:827–829, 1973. 1
World Health Organization. Iron deficiency anemia assessment, prevention and control: A guide for programme managers, 2001. 2.3
World Health Organization. Prevetion of iron deficiency anaemia in adolescents: Role of weekly iron and folic acid supplementation. Technical report, Regional Office for South-East Asia, 2011. 1
Table A.1: Health - School Days Missed to Illness
Full Sample Subsample
(1) (2) (3) (4) (5) (6) (7)
Treatment 0.609 0.201 0.230 0.268 0.260 0.993 1.175
(0.647) (0.754) (0.773) (0.834) (0.855) (1.140) (1.189)
Baseline Hg Spline 0.178 0.178
x Treatment (0.207) (0.211)
Baseline Hg spline 0.092 0.094
(0.176) (0.180)
Anemic at Baseline 0.783 0.876
x Treatment (1.319) (1.346)
Anemic at Baseline 0.434 0.393
(1.084) (1.102)
Male Student 0.174 -0.044 -0.001 0.116 0.159 0.376 0.201
(0.617) (0.618) (0.634) (0.621) (0.636) (1.205) (1.251)
Monthly Income 0.023 0.025 0.010
(100 S/. ) (0.053) (0.053) (0.090)
Electricity in Home 0.086 0.089 -0.591
(0.715) (0.726) (1.548)
Mother’s Years of -0.070 -0.067 -0.305∗
Schooling (0.105) (0.105) (0.163)
N. of obs. 152 152 152 152 152 61 61
Control Mean 2.642 2.642 2.642 2.642 2.642 2.900 2.900
All regressions include controls for classes
Standard errors in parentheses: ∗p <0.10 ,∗∗ p <0.05 ,∗∗∗p <0.01
Table A.2: Health - Number of Minutes that Student Can Run
Full Sample Subsample
(1) (2) (3) (4) (5) (6) (7)
Treatment -3.991 -4.268 -4.349 -5.512 -5.780 -0.333 -1.260
(3.188) (3.757) (3.801) (4.090) (4.140) (5.059) (5.175)
Baseline Hg Spline 0.528 0.433
x Treatment (1.045) (1.062)
Baseline Hg spline -1.389 -1.268
(0.893) (0.911)
Anemic at Baseline 5.097 5.082
x Treatment (6.467) (6.552)
Anemic at Baseline -6.414 -6.026
(5.337) (5.400)
Male Student 0.342 0.967 0.949 0.362 0.347 3.731 4.582
(3.023) (3.009) (3.046) (3.010) (3.044) (5.078) (5.311)
Monthly Income -0.150 -0.156 -0.339
(100 S/. ) (0.174) (0.176) (0.205)
Electricity in Home 1.177 1.512 1.693
(3.519) (3.535) (6.412)
Mother’s Years of -0.416 -0.495 -0.006
Schooling (0.530) (0.530) (0.758)
N. of obs. 207 207 207 207 207 83 83
Control Mean 25.229 25.229 25.229 25.229 25.229 21.370 21.370
All regressions include controls for classes.
Standard errors in parentheses: ∗p <0.10 ,∗∗ p <0.05 ,∗∗∗p <0.01
Table A.3: Health - Hours of Sleep
Full Sample Subsample
(1) (2) (3) (4) (5) (6) (7)
Treatment 1.013 -0.485 -0.637 -0.520 -0.766 3.217 3.076
(1.013) (1.178) (1.204) (1.290) (1.318) (2.178) (2.325)
Baseline Hg Spline 0.742∗∗ 0.768∗∗
x Treatment (0.336) (0.341)
Baseline Hg spline -0.272 -0.276
(0.291) (0.296)
Anemic at Baseline 3.854∗ 4.204∗∗
x Treatment (2.051) (2.087)
Anemic at Baseline -1.960 -2.057
(1.685) (1.708)
Male Student -1.125 -1.357 -1.486 -1.162 -1.286 -2.274 -3.266
(0.968) (0.959) (0.981) (0.964) (0.985) (2.284) (2.447)
Monthly Income -0.037 -0.038 -0.134
(100 S/. ) (0.083) (0.084) (0.170)
Electricity in Home 0.161 0.246 1.004
(1.112) (1.126) (2.927)
Mother’s Years of -0.036 -0.041 -0.078
Schooling (0.166) (0.168) (0.337)
N. of obs. 187 187 187 187 187 75 75
Control Mean 5.758 5.758 5.758 5.758 5.758 4.440 4.440
All regressions include controls for classes.
Standard errors in parentheses: ∗p <0.10 ,∗∗ p <0.05 ,∗∗∗p <0.01