2532
Automatic learner summary assessment for reading comprehension
Menglin Xia
Amazon Research Cambridge∗ [email protected]
Ekaterina Kochmar ALTA Institute Computer Laboratory University of Cambridge [email protected]
Ted Briscoe ALTA Institute Computer Laboratory University of Cambridge
Abstract
Automating the assessment of learner sum-maries provides a useful tool for assessing learner reading comprehension. We present a summarization task for evaluating non-native reading comprehension and propose three novel approaches to automatically assess the learner summaries. We evaluate our mod-els on two datasets we created and show that our models outperform traditional approaches that rely on exact word match on this task. Our best model produces quality assessments close to professional examiners.
1 Introduction
Summarization is a well-established method of measuring reading proficiency in traditional En-glish as a second or other language (ESOL) assess-ment. It is considered an effective approach to test both cognitive and contextual dimensions of read-ing (Weir et al.,2013). However, due to the high time and cost demands of manual summary assess-ment, modern English exams usually replace the summarization task with multiple choice or short answer questions that are easier to score ( Alder-son,2005). Automating the assessment of learner summarization skills provides an efficient evalua-tion method for the quality of the learner summary and can lead to effective educational applications to enhance reading comprehension tasks.
In this paper, we present a summarization task for evaluating non-native reading comprehension and propose three novel machine learning ap-proaches to assessing learner summaries. First, we extract features to measure the content simi-larity between the reading passage and the sum-mary. Secondly, we calculate a similarity matrix based on sentence-to-sentence similarity between
∗
The work by the first author was done at the University of Cambridge prior to joining Amazon Research.
the reading passage and the summary, and apply a Convolutional Neural Network (CNN) model to assess the summary quality using the similarity matrix. Thirdly, we build an end-to-end summa-rization assessment model using the Long Short Term Memory (LSTM) model. Finally, we com-bine the three approaches in a single system using a simple parallel ensemble modeling technique. We compiled two datasets to evaluate our models, and we release this data with the paper. We show that our models outperform traditional approaches that rely on exact word match on the task and that our best model produces quality assessments close to professional examiners.
2 Related Work
Most of the previous studies on summary assess-ment are aimed at evaluating automated summa-rization systems (Lin,2004;Lin and Hovy,2003; Nenkova et al., 2007). In contrast to this line of work, our goal is to assess human-written sum-maries rather than machine-generated ones.
po-tential implications for the clarity of the narrative.
The work that is most similar to ours is the au-tomatic scoring of a summarization task by Mad-nani et al.(2013), who designed a task to measure the reading comprehension skills of American stu-dents. In their experiments, students were asked to write a four-sentence summary for each of the two three-paragraph reading passages, with the first sentence summarizing the whole passage and the following three sentences summarizing each para-graph. To build an automated system to score the summaries, they randomly select a student sum-mary with the highest score as the reference, and use 8 feature types to train a logistic regression classifier to predict the summary score. They train a separate classifier for each of the two passages, and obtain accuracy scores of 65% and 52% re-spectively, outperforming the most-frequent-score baselines of51% and32%. Most of the features used inMadnani et al.(2013) are based on verba-tim overlap. Although such metrics prove to be effective in various tasks, they cannot capture the content similarity when paraphrasing or a higher level of abstraction are used in the summary.
Few studies have addressed summarization as-sessment at a higher level. More recently, Ruseti et al.(2018) have used Recurrent Neural Networks (RNNs) to automatically score summaries. In their model, a concatenated representation of the sum-mary and the text built from two separate RNNs as well as a complexity score of the text are fed to a fully connected layer to predict a real number be-tween[0,1]. This number is then mapped to3 dis-crete classes representing the quality of the sum-mary using linear regression. Their best model achieves55.24%in accuracy on a dataset of 636
summaries collected using Mechanical Turk.
In this paper, we address several limitations of previous work. We build a system that uses verbatim features as well as features capturing higher level of abstraction. First, we aim to build a generic system that can evaluate the qual-ity of a summary without having to train a sepa-rate model for each text. Second, whereas Mad-nani et al. (2013) use a student summary with the highest score as the reference to evaluate the candidate summary, our goal is to build a fully-automated system that does not require selecting a pre-defined reference. Third, we aim to explore features and structures capable of better modeling semantic similarity beyond verbatim overlap.
3 Data
This section outlines the summarization task used in our experiments. First, learners, regardless of their proficiency level, were asked to read three reading passages extracted from the Cam-bridge English Exams dataset ofXia et al.(2016) at the lower (B1), upper intermediate (B2), and advanced (C1) levels of the Common European Framework of Reference for Languages (CEFR). Then they were asked to write a summary of50,
100, and120words for each of the three tasks.1
3.1 Pilot study with simulated learner data
Before launching the experiments with the actual language learners and in order to develop the auto-mated summary evaluation system, we first ran a pilot study and collected “simulated learner” sum-maries from50members of our university. Since most participants of this study would speak En-glish at an advanced (C1-C2) level, we asked them to write a “good summary” and a “bad summary” for each reading passage, mimicking a learner. The participants were asked to produce grammat-ically correct sentences and to write a “bad” sum-mary in a way that a learner who does not fully understand the original passage might produce. In total,300summaries were collected (with 150
good summaries and 150 bad ones). The simu-lated learner data was then used to train binary classification systems to assess whether a sum-mary captures the passage content properly or not.
3.2 Real learner data
Learner levels Count
B1 40
B2 40
C1-C2 57
[image:2.595.361.473.524.599.2]Total 137
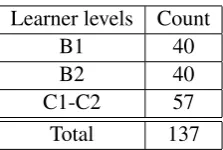
Table 1: The distribution of the learner proficiency lev-els in the real learner data
Next, we collected summaries from second lan-guage learners at B1, B2 and C1-C2 levels of pro-ficiency.2In total,411summaries from137 learn-ers were collected. The distribution of the learner proficiency levels is shown in Table1.
1
The word limits on the summarization tasks are set to keep a relatively constant compression ratio between the summary and the length of the original passage.
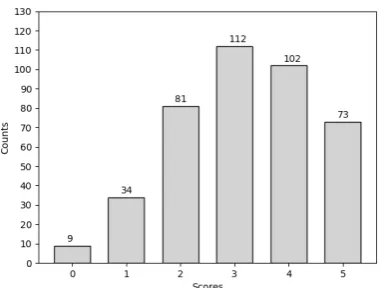
Figure 1: A histogram illustrating the score distribution in the real learner data
The summaries were then scored by three pro-fessional ESOL annotators using a 6-point scale defined as follows:
Band 5:The summary demonstrates excellent understand-ing of the original passage: Content covers all the main points of the passage. All content included is accurate, with no irrelevant details or repetitions. Target reader is fully informed.
Band 4:Performance shares features of Bands 3 and 5.
Band 3: The summary demonstrates acceptable under-standing of the passage: Most of the main points are in-cluded. Most of the content is relevant and paraphrased, with some irrelevant details, repetitions or inaccuracy of content. Target reader is on the whole informed.
Band 2:Performance shares features of Bands 1 and 3.
Band 1: The summary demonstrates very little under-standing of the passage: Most of the content is of limited relevance, with repetitions or verbatim borrowing from the original text. In some paraphrased parts of the text, inac-curacy of content or omissions of main points are evident. Target reader is minimally informed.
Band 0:No understanding of the passage is demonstrated. The content is totally irrelevant to the original passage. Target reader is not informed.
Figure 1 shows the distribution of the scores for the learner summaries. The pairwise correla-tion between annotators ranges between0.690and
0.794. To derive the final score for each summary, we take the average of the scores by the three an-notators. This results in a set of real-valued aver-age scores on the scale of[0,5] and allows us to treat this task as a regression problem and make use of the continuity of the assessment scale. The goal of the experiments on this data is then to train a regression model to predict a score that corre-lates well with the annotators’ judgments.
4 Methods
In this section, we introduce three different ap-proaches to the automated evaluation of the learner summaries.
4.1 Measures for summary assessment
First of all, we extract a number of features to de-scribe the similarity of the summary and the read-ing text and apply a machine learnread-ing model to predict the summary quality.
The summarization task for reading comprehen-sion examines the content relevance and the ability to convey the main ideas of the text in the mary. To automatically assess the learner sum-mary, we compare the candidate summary against a reference to assess the quality of its content.
We experiment with two types of references to evaluate the candidate summary: firstly, we com-pare the candidate summary against the original passagedirectly, and secondly, we extract key sen-tences from the original text with an automated extractive summarizer and compare the candidate summary to the set of key sentences. Ideally, an extractive summarizer extracts a subset of sen-tences from the passage that are highly represen-tative of the original text. Although the extracted key sentences are not necessarily coherent among themselves, they provide a representation of the main ideas of the text. Comparing the candidate summary against the key sentences allows us to examine the content relevance and the coverage of the main ideas in the candidate summary. We com-pare two popular summarizers in selecting the key sentences for reference: TextRank (Mihalcea and Tarau,2004) andMEAD(Radev et al.,2004). We also compare the extractive summarizers against the baseline of using a random selectionof sen-tences as the reference.
After obtaining the reference, we derive four types of linguistic features to evaluate the quality of the learner summary: (1) verbatim features, (2) semantic similarity features, (3) features based on distributed vector representations of the summary, and (4) features that describe discourse and other textual characteristics of the summary.
4.1.1 Verbatim features
ref-erence. We use the following metrics to mea-sure verbatim similarity: ROUGE (Lin, 2004), BLEU (Papineni et al., 2002), and METEOR (Denkowski and Lavie, 2011). The three metrics are commonly used to assess automated summa-rization systems. ROUGE and BLEU are based on exact word match of N-grams, and METEOR ex-tends the exact word match with stem, synonym, and paraphrase matches extracted from the Word-Net (Miller, 1995) and a background dictionary, which allows for more flexible expressions.
4.1.2 Semantic similarity features
Although verbatim overlap metrics prove to be ef-fective in various tasks, they fail to capture the content similarity when paraphrasing and higher levels of abstraction are used in the summary. To compensate for this, word embeddings and sen-tence embeddings are used to model semantic sim-ilarity at the word and the sentence level. We mea-sure the semantic similarity between words and sentences in the texts and combine the scores into a measure of document-level semantic similarity.
1. Word similarity:Word2vec(Mikolov et al., 2013) is a model for learning distributed vec-tor representations of words from a large cor-pus of text. We use embeddings pre-trained on Wikipedia to compute word-to-word co-sine similarity between the candidate sum-mary and the reference. We experiment with three scoring functions to construct the text-level semantic similarity measures from the word-to-word scores:
(1) average word similarity on every word pair in the candidate summary and the refer-ence;
(2)a greedy method (Mihalcea et al.,2006) that finds the best-matching word with max-imum similarity scores and computes the av-erage over the greedily selected pairs;
(3) optimal matching (Rus and Lintean, 2012) that finds the optimal alignment of word pairs and then takes the average over the alignment.
2. Sentence similarity: Skip-thought (Kiros et al., 2015) is a model for learning dis-tributed representations of sentences. It uses an RNN-encoder to compose the sentence vector, and a decoder conditioned on the re-sulting vector that tries to predict the
previ-ous and the next sentences in the context. We use the model pre-trained on the BookCorpus (Zhu et al., 2015) to generate our sentence vectors. Additionally, we experiment with composing the sentence vectors using word embedding summation and taking the aver-age (average word embeddings). We use the same functions for word-level similarity to compute the text semantic similarity from the sentence vectors.
4.1.3 Distributed vector representations of the summary
In addition to the word and sentence similarities, we investigate methods to model the content simi-larity between the candidate summary and the ref-erence directly at the document level.
Specifically, we use the following five ap-proaches to construct vector representations of learner summaries:
TF-IDFis a common method to construct docu-ment representations in information retrieval. TF-IDF weighted document vectors are frequently used for measuring query-document similarity.
Doc2Vec (Le and Mikolov, 2014) is a neural network model for learning distributed representa-tion of documents. We use the “distributed mem-ory of paragraph vectors (PV-DM)” variant of the model to construct our vector representation of the summary. The PV-DM model maps the document to a vector space and uses a combination of the document vector and the vectors of surrounding words to predict a target word.
Latent Semantic Analysis (LSA) (Landauer, 2006) applies singular value decomposition (SVD) on the term-document matrix to obtain vec-tor space representation of documents.
Latent Dirichelet Allocation (LDA) (Blei et al.,2003) represents the documents as mixtures of topics. It can be used to measure the content similarity and topical relevance of documents.
We also make use of theaverage word embed-dingsto encode the summary.
We use the Simple English Wikipedia corpus3 as our background resource to learn the document representations. The Simple English Wikipedia data is used to train the models because its doc-uments are rendered simple for English learners. Therefore, the lexical usage and syntactic struc-ture in Simple English Wikipedia are more simi-lar to the summaries written by learners. We take
the cosine similarity between the candidate and the reference vectors to evaluate their similarity.
4.1.4 Discourse and other textual features
Apart from the content-based measures of the summary, the textual quality of the summary is also important for its overall quality estimation. For instance, good summaries tend to be more co-herent and logically consistent. We extract lexi-cal chain-based discourse measures to assess the coherence of the text. Lexical chains model the semantic relations among entities throughout the text. We implement the lexical chaining algorithm developed by Galley and McKeown (2003) and extract7lexical chain-based features.4
We also measure the following superficial tex-tual features:
Length: Number of words in the summary. Compression ratio: The ratio of the number of words in the summary to the number of words in the reading passage.
Type-token ratio: The ratio of the number of unique words to the total number of words in the summary.
Text readability: The reading difficulty (the CEFR level) of the passage to be summarized.
After the features are extracted, we train a Sup-port Vector Machine (SVM) (Cortes and Vapnik, 1995) model for the classification task (Section 3.1) and a Kernel Ridge Regression (KRR) ( Saun-ders et al., 1998) model for the regression task (Section3.2).
4.2 Assessing summary using similarity matrix
Secondly, we construct a sentence similarity ma-trix between the candidate summary and the orig-inal reading passage and apply a Convolutional Neural Network (CNN) model on the similarity matrix to predict the quality of the summary.
Lemaire et al.(2005) proposed a computational cognitive model for assessing extractive summa-rization. In their experiments, they presented278
American school students with two reading pas-sages and asked them to underline three to five sentences that they considered the most important in the texts. The underlined sentences were com-pared against the set of all the sentences from the
4Features include: number of lexical chains per
docu-ment, number of lexical chains normalized by text length, av-erage/maximum lexical chain length, avav-erage/maximum lex-ical chain span, and the number of long chains.
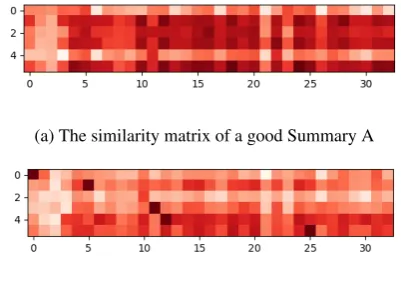
(a) The similarity matrix of a good Summary A
[image:5.595.314.515.70.212.2](b) The similarity matrix of a bad Summary B
Figure 2: Similarity matrices of two summaries for the same reading passage from the simulated learner data. Summary A is a good summary and Summary B is a bad summary. The rows of the matrix represent sen-tences in the summary and the columns of the matrix represent sentences in the reading passage.
original passage. They observed that the impor-tant sentences selected by the students are highly connected to the rest of the sentences in the text, where the connection is defined by the semantic similarity of the sentences.
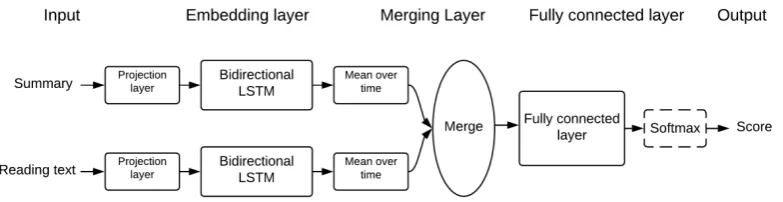
Figure 3: The merged LSTM model
sentence from the original text. We use the two sentence similarity models described in Section 4.1.2, skip-thought and average word embeddings, to build the sentence vectors.
According to our hypothesis, the quality of the summary corresponds to different patterns in the similarity matrix. The similarity matrix can be viewed as a heat map “image” from which we can learn patterns to detect the quality of the sum-mary. Figure2demonstrates the similarity matri-ces of two summaries for the same reading passage from the simulated learner data. The shade of the coloured map indicates the degree of similarity be-tween two sentences: the darker the shade is, the more similar the sentences are. In this example, Summary A is an example of a good summary, and Summary B is an example of a bad summary. We can see that sentences in Summary A are similar to a number of sentences in the original text, result-ing in a well-distributed heat map. By contrast, sentences in Summary B are similar to five par-ticular sentences in the text and are less similar to other sentences, which is reflected by the isolated dark patches in the image. On the whole, Sum-mary A has higher similarity scores than SumSum-mary B, which makes its heat map darker. These two examples illustrate how different patterns may be observed in the heat map of the summaries of dif-ferent quality.
To learn these patterns automatically, we apply a CNN model on the similarity matrix to predict the quality of the summary. However, it should be noted that CNNs usually work best when a large amount of training data is available, whereas the summary data we have collected represents a rel-atively small dataset. We compare the results of the CNN model against the feature extraction ap-proach to investigate how well the model can learn from the limited amount of data.
4.3 Assessing summary using LSTM-based models
Thirdly, we experiment with several LSTM-based neural network models for assessing the summary quality. The LSTM-based models are used to learn representations of the summary and estimate its quality automatically, without having to manually extract features from it.
Recurrent neural networks with LSTM units (Hochreiter and Schmidhuber,1997) have shown impressive results on various NLP tasks (Wang and Jiang, 2016; Rockt¨aschel et al., 2015). In essence, they are capable of embedding long text sequences into a vector representation which can later be decoded for use in various applications.
4.3.1 Merged LSTM model
Inspired by the recent advances with LSTMs in NLP tasks, we propose a merged LSTM model (see Figure 3) for assessing learner summaries. The merged LSTM model encodes the summary and the reading text separately with two bidirec-tional LSTMs, and merges the embedded sum-mary and embedded reading text representations into a joint representation to predict the summary score. We explore four functions to merge the en-coded vectors, includingconcatenation, addition,
dot productandlinear combination.
4.3.2 Attention-based LSTM model
Figure 4: Attention mechanism architecture in the attention-based LSTM model for summary assessment
The attention mechanism was first introduced by Bahdanau et al. (2014) for machine transla-tion. In general, the attention model learns a soft alignment between the input and the output in the encoder-decoder framework. The attention mechanism allows the model to learn what to at-tend to in the input states and mitigates the long-dependency bottleneck of the LSTM.
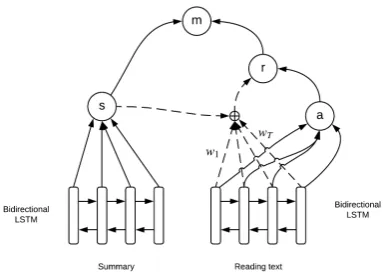
In the attention-based model for summary as-sessment, the original text and the summary are still encoded using two separate LSTMs. How-ever, the text representation is formed by a weighted sum of the hidden states of the text en-coder, where the weights can be interpreted as the degree to which the summary attends to a particu-lar token in the text. The summary representation and the text representation are combined with a nonlinear function into a joint representation and then fed into the fully connected layer to predict the summary quality. Figure 4 is an illustration of the attention mechanism between the embedded summary and the embedded input text.
Mathematically, supposesis the encoded sum-mary vector and a(t) is the hidden state of the LSTM for the text at each tokent. Then the final representationr of the encoded text is a weighted sum ofa(t):
r =a·w= T
X
t=1
a(t)w(t)
The weight for each tokenw(t)is computed by:
w(t) = PTexp(α(t)) t=1exp(α(t))
where
[image:7.595.85.277.69.207.2]α(t) =Waα·a(t) +Wsα·s
Figure 5: Combining three approaches using ensemble modelling
is an alignment model.
The joint representationmof the summary and the text is a combination of the summary vectors
and the weighted input text vectorr.
m=tanh(Wsm∗s+Wrm∗r+b)
where Wsm, Wrm andb are the parameters of a
linear combination function.
4.4 Ensemble modelling
Ensemble modelling combines several machine learning techniques into one model in order to im-prove the stability and accuracy of the prediction. We explore combining the three different models (see Figure 5) into a single model by taking the majority vote from the binary classification mod-els and taking the average value of the predicted scores from the regression models. We compare the performance of the combined models against the individual models to investigate if and to what extent ensemble modelling is useful for assessing the summaries.
5 Experiments and Results
5.1 Experimental set-up
We evaluate our models on the real learner data and on the simulated learner data, for consistency, using 5-fold cross validation. In each fold, 60%
of the data is used as the training set,20%as the development set, and20%as the test set.5
We compare our models against five baselines:
most frequent baseline,random baseline,ROUGE
5We choose the best model based on the development set,
[image:7.595.318.512.76.189.2]Models Variants Accuracy
Baseline Baseline type
most-frequent 50.0%
random 50.0%
ROUGE 59.3%
BLEU 51.7%
ROUGE + BLEU 59.6%
SVM reference type
random 58.8%
TextRank 63.8%
MEAD 62.9%
original text 65.6%
CNN similarity matrix type avg word embeddings 65.8% skip-thought vectors 63.4%
LSTM Merged LSTM
merging concatenation 68.0% addition 68.1%
function multiplication 69.1% linear combination 70.4%
Attention LSTM 71.1%
[image:8.595.144.458.59.336.2]Combined model SVM+CNN+LSTM 75.3%*
Table 2: Model performance on the simulated learner data. We use the bold font to indicate the best model for each method. The asterisk sign indicates the best performance across all models.
baseline,6 BLEU baseline, andROUGE + BLEU
baseline.
We use accuracy to evaluate the models on the simulated learner data, and on the real learner data, we report scores of two evaluation metrics: Pear-son correlation coefficient (PCC) and Root Mean Square Error (RMSE), which are commonly used for evaluating regression models.
5.2 Results
Table2 shows the results of the baseline and the four types of models on the simulated learner data, and Table3reports the results of the models on the real learner data.
On the simulated learner data, the best vari-ants from all three methods outperform the base-lines. The improvement is statistically signifi-cant (p<0.05) using t-test for all three methods. We combine the best variants from the three ap-proaches into a single system by taking the ma-jority vote from the models. The resulting system achieves the best accuracy of75.3%in predicting the binary type of the summary on the simulated learner data.
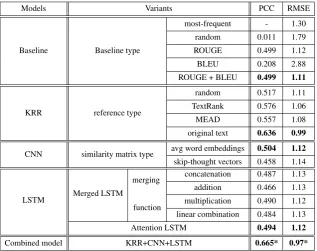
On the real learner data, we found that the feature extraction-based model outperforms the
6A baseline trained on ROUGE features only.
CNN model and LSTM-based models, which also significantly outperform the baselines. The re-sults suggest that the neural network-based mod-els are not as effective as the traditional feature extraction-based method for the regression task, at least when the training data is limited in size.
However, although the CNN and LSTM models are not the best-performing models individually, a combination of the three methods (KRR, CNN and LSTM) still improves the performance. We believe that this is because the three independent models capture different aspects of the summary quality that are complementary to each other. In addition, the combined model is more robust to outliers. For example, when two models agree on an instance while the third model does not, the combined model will select the majority vote or the average score of the model estimations, hence achieving a better performance in estimating the summary quality. Overall, the best model perfor-mance is close to human perforperfor-mance.
Models Variants PCC RMSE
Baseline Baseline type
most-frequent - 1.30
random 0.011 1.79
ROUGE 0.499 1.12
BLEU 0.208 2.88
ROUGE + BLEU 0.499 1.11
KRR reference type
random 0.517 1.11
TextRank 0.576 1.06
MEAD 0.557 1.08
original text 0.636 0.99
CNN similarity matrix type avg word embeddings 0.504 1.12 skip-thought vectors 0.458 1.14
LSTM Merged LSTM
merging concatenation 0.487 1.13 addition 0.466 1.13
function multiplication 0.490 1.12 linear combination 0.484 1.13
Attention LSTM 0.494 1.12
[image:9.595.142.460.61.312.2]Combined model KRR+CNN+LSTM 0.665* 0.97*
Table 3: Results of the regression model performance on the learner data. We use the bold font to indicate the best model for each method. The asterisk sign indicates the best performance across all models.
is typically judged by the word overlap, therefore missing the bits of text where topical words occur less often.
6 Conclusion
In this paper, we introduce a summarization task for testing reading comprehension of learners and present several automated systems to assess the quality of the learner summary. We collected sum-maries from members of our university and from the real learners to evaluate our systems. We pro-pose and compare three approaches to assess the summaries, including the feature extraction-based model, the CNN-based model using similarity ma-trix, and the LSTM-based model. The best system, built using a combination of three models, yields an accuracy of 75.3% on the simulated learner data, andP CC = 0.665,RM SE = 0.97on the real learner data. Although not directly compara-ble to other studies, we note that these results are higher than those reported in previous work.
Our systems are generalizable and address the limitations of the previous research in this area as: (1) they are capable of evaluating the quality of a summary without the need of being trained on each input text separately, (2) they do not re-quire a pre-defined reference, and (3) they are ca-pable of capturing content similarity beyond ver-batim overlap, taking into account paraphrasing
and higher levels of abstraction.
We believe that although the application pre-sented in this paper focuses on assessing learner summaries, these techniques may also be useful for benchmarking automated summarization sys-tems. Evaluation of these techniques for bench-marking automated summarization systems is one direction for our future research.
We make the summary data available at
https://www.cl.cam.ac.uk/˜ek358/ learner-summaries.html.
Acknowledgments
This paper reports on research supported by Cam-bridge Assessment, University of CamCam-bridge. We also thank Cambridge Assessment for their assis-tance in the collection of the real learner data. We are grateful to the anonymous reviewers for their valuable feedback.
References
J. Charles Alderson. 2005. Assessing reading. Cam-bridge University Press.
David M. Blei, Andrew Y. Ng, and Michael I. Jordan. 2003. Latent dirichlet allocation. Journal of Ma-chine Learning Research, 3(Jan):993–1022.
Corinna Cortes and Vladimir Vapnik. 1995. Support-vector networks. Machine learning, 20(3):273–297.
Michael Denkowski and Alon Lavie. 2011. Meteor 1.3: Automatic metric for reliable optimization and evaluation of machine translation systems. In Pro-ceedings of the Sixth Workshop on Statistical Ma-chine Translation, pages 85–91. Association for Computational Linguistics.
Michel Galley and Kathleen McKeown. 2003. Improv-ing word sense disambiguation in lexical chainImprov-ing. InInternational Joint Conference on Artificial Intel-ligence, volume 3, pages 1486–1488.
Sepp Hochreiter and J¨urgen Schmidhuber. 1997. Long short-term memory. Neural computation, 9(8):1735–1780.
Ryan Kiros, Yukun Zhu, Ruslan R. Salakhutdinov, Richard Zemel, Raquel Urtasun, Antonio Torralba, and Sanja Fidler. 2015. Skip-thought vectors. In Ad-vances in Neural Information Processing Systems, pages 3294–3302.
Thomas K. Landauer. 2006. Latent semantic analysis. Wiley Online Library.
Quoc V. Le and Tomas Mikolov. 2014. Distributed representations of sentences and documents. In In-ternational Conference on Machine Learning, vol-ume 14, pages 1188–1196.
Benoit Lemaire, Sonia Mandin, Philippe Dessus, and Guy Denhiere. 2005. Computational cognitive mod-els of summarization assessment skills. In Proceed-ings of the 27th Annual Meeting of the Cognitive Sci-ence Society, pages 1266–1271.
Chin-Yew Lin. 2004. Rouge: A package for auto-matic evaluation of summaries. InProceedings of the Workshop on Text Summarization Branches Out, volume 8, pages 74–81. Association for Computa-tional Linguistics.
Chin-Yew Lin and Eduard Hovy. 2003. Auto-matic evaluation of summaries using n-gram co-occurrence statistics. In Proceedings of the 2003 Conference of the North American Chapter of the Association for Computational Linguistics: Human Language Technologies, volume 1, pages 71–78. As-sociation for Computational Linguistics.
Nitin Madnani, Jill Burstein, John Sabatini, and Tenaha OReilly. 2013. Automated scoring of a summary writing task designed to measure reading compre-hension. Proceedings of the Eighth Workshop on In-novative Use of NLP for Building Educational Ap-plications, pages 163–168.
Rada Mihalcea, Courtney Corley, and Carlo Strap-parava. 2006. Corpus-based and knowledge-based measures of text semantic similarity. InProceedings of the 21st National Conference on Artificial Intelli-gence, volume 1, pages 775–780.
Rada Mihalcea and Paul Tarau. 2004. TextRank: Bringing order into texts. In Proceedings of the 2004 Conference on Empirical Methods in Natural Language Processing, pages 404–411. Association for Computational Linguistics.
Tomas Mikolov, Ilya Sutskever, Kai Chen, Greg S Cor-rado, and Jeff Dean. 2013. Distributed representa-tions of words and phrases and their compositional-ity. InAdvances in Neural Information Processing Systems, pages 3111–3119.
George A Miller. 1995. WordNet: a lexical database for English. Communications of the ACM, 38(11):39–41.
Ani Nenkova, Rebecca Passonneau, and Kathleen McKeown. 2007. The pyramid method: Incorpo-rating human content selection variation in summa-rization evaluation. ACM Transactions on Speech and Language Processing, 4(2):4.
Kishore Papineni, Salim Roukos, Todd Ward, and Wei-Jing Zhu. 2002. BLEU: a method for automatic evaluation of machine translation. In Proceedings of the 40th Annual Meeting of the Association for Computational Linguistics, pages 311–318. Associ-ation for ComputAssoci-ational Linguistics.
Dragomir R. Radev, Timothy Allison, Sasha Blair-Goldensohn, John Blitzer, Arda Celebi, Stanko Dimitrov, Elliott Drabek, Ali Hakim, Wai Lam, and Danyu Liu. 2004. MEAD - A platform for multi-document multilingual text summarization. In Pro-ceedings of the Fourth International Conference on Language Resources and Evaluation.
Tim Rockt¨aschel, Edward Grefenstette, Karl Moritz Hermann, Tomas Kovcisky, and Phil Blunsom. 2015. Reasoning about entailment with neural at-tention. arXiv preprint arXiv:1509.06664.
Vasile Rus and Mihai Lintean. 2012. A comparison of greedy and optimal assessment of natural language student input using word-to-word similarity metrics. InProceedings of the Seventh Workshop on Building Educational Applications Using NLP, pages 157– 162. Association for Computational Linguistics.
Stefan Ruseti, Mihai Dascalu, Amy M. Johnson, Danielle S. McNamara, Renu Balyan, Kathryn S. McCarthy, and Stefan Trausan-Matu. 2018. Scoring Summaries Using Recurrent Neural Networks. In
Intelligent Tutoring Systems, pages 191–201, Cham. Springer International Publishing.
David Wade-Stein and Eileen Kintsch. 2004. Sum-mary Street: Interactive computer support for writ-ing. Cognition and Instruction, 22(3):333–362.
Shuohang Wang and Jing Jiang. 2016. Machine com-prehension using match-lstm and answer pointer.
arXiv preprint arXiv:1608.07905.
Cyril J. Weir, Ivana Vidakovic, and Evelina Galaczi. 2013. Measured constructs. Cambrdige University Press.
Denise Whitelock, Debora Field, Stephen Pulman, John T. E. Richardson, and Nicolas Van Labeke. 2013. OpenEssayist: an automated feedback sys-tem that supports university students as they write summative essays. In Proceedings of the 1st Inter-national Conference on Open Learning: Role, Chal-lenges and Aspirations.
Menglin Xia, Ekaterina Kochmar, and Ted Briscoe. 2016. Text readability assessment for second lan-guage learners. In Proceedings of the 11th Work-shop on Building Educational Applications Using NLP, pages 12–22. Association for Computational Linguistics.