Abstract— Nowadays, there is a wide variety of network benchmarking tools, giving researchers and network administrators many choices to work with. However, this variety tends to difficult the selection process of the appropriate tool. Furthermore, sometimes users are forced to try several tools in order to find the one that calculates a given gauge, so they have to learn how to manipulate different tools and how to interpret obtained results. This paper offers a compilation of currently used network benchmarking tools, with the intention of guiding the selection of one tool over others, by outlining their main features, strengths and weaknesses.
Index Terms—Benchmarks, Performance Evaluation, Traffic Generation, Network Monitoring.
I. INTRODUCTION
It is common that researchers and/or network administrators need to measure different network indicators. Several tools are available for this purpose, but not all of them have the same characteristics and evaluate the same performance parameters.
Sometimes, researchers are obliged to use a number of these tools in order to complete experiments and find significant results. According to the test to be performed, and to the network or device under test, one benchmarking tool can be more appropriated than another. This can complicate and delay the evaluation process, since researchers would have to learn to use different tools. For example, Gamess and Velásquez [5] had to use two different performance tools and write their own benchmarks in order to evaluate the forwarding performance on different operating systems.
This paper presents an up-to-date survey on currently used network benchmarking tools, as a way to help researchers and network administrators to make a decision about the more appropriated tool for their needs. Additionally, this paper outlines desirable features for benchmarking tools to be developed in the future.
The rest of the paper is organized as follow. In Section II, we
Manuscript received July 15, 2009.
K. Velásquez is with the Laboratory of Communications and Networks at Central University of Venezuela, Los Chaguaramos, Caracas - Venezuela (phone: +58-212-6051685; e-mail: [email protected]).
E. Gamess is with the School of Computer Science at Central University of Venezuela, Los Chaguaramos, Caracas - Venezuela (phone: +58-212-6051061; e-mail: [email protected]).
introduce previous works related to our study. Section III contains a deep study and description of eight popular benchmarking tools. Section IV shows a comparative analysis of the eight tools. Conclusions and future work are discussed in Section V.
II. RELATED WORKS
Botta et al. [2] present an exhaustive survey on available bandwidth estimation tools as a state-of-the-art. They divided the tools in three categories: (1) end-to-end capacity estimation tools, (2) available bandwidth estimation tools, and (3) TCP throughput and bulk transfer capacity measurement tools. They also introduce a tool called BET (Bandwidth Estimation Tool) and compare it with other performance tools, in terms of accuracy and total time used to complete the measurement process. Ubik and Král [16] summarize their experience with bandwidth estimation tools; they focus on finding the size and location of bottlenecks. They present a classification of end-to-end bandwidth estimation tools based on a number of properties, including determining bandwidth (installed bandwidth) vs. throughput (available bandwidth), sender only software vs. sender and receiver software, etc. They also describe properties of a few selected tools, present results of measurement with one tool (pathload) on a high-speed scenario and results of combined measurements with several tools over a real fast long-distance network. Gupta et al. [6] perform an experimental comparison study of both passive and active bandwidth estimation tools for 802.11-based wireless networks, and conclude that for wireless networks a passive technique provides greater accuracy.
Strauss et al. [15] describe Spruce, a simple tool for measuring available bandwidth, and then compare it with other existing tools over many different Internet paths. Their study is based on accuracy, failure patterns, probe overhead, and implementation issues. Montesino [10] presents a comparative analysis of state-of-the-art active bandwidth estimation techniques and tools. He offers a short overview of a set of tests performed over different conditions and scenarios, which were done with the aim of assessing the performance of active bandwidth estimation tools. Mingzhe et al. [9] present WBest, a wireless bandwidth estimation tool designed for accurate estimation of available bandwidth in IEEE 802.11 networks, explaining that most of the existing tools were not designed for wireless networks. They define the algorithm employed by
WBest and present a set of experiments and analysis of the
A Comparative Analysis of Network
Benchmarking Tools
results. They also compare their tool with others like pathchirp
[13] and pathload [7].
III. NETWORK BENCHMARKING TOOLS
For our study, we selected eight different throughput and bulk capacity measurement tools: Netperf, D-ITG, NetStress,
MGEN, LANforge, Network Traffic Generator, Rude & Crude, and WlanTV. We chose these tools for their popularity and because they are active projects. Many performance tools available in Internet have no updated versions and seem to be dead. These eight tools also offer different features, so they provide us with a wider range for our analysis.
Our aim is to present a clear description of the available tools that can help in choosing one of them for a given experiment. Additionally, we figure out desirable features for a throughput and bulk transfer capacity measurement tool since our goal is to develop a new network benchmarking tool from scratch.
During the analysis, each necessary step, questions that arose, efforts it took to find answers to them, features that were helpful or confusing, and necessary time were carefully recorded. Progress and experience were discussed among the authors.
According to [12], the tools included in our study belong to the group of Throughput and Bulk Transfer Capacity (BTC) measurement tools, which are benchmarking tools that use large TCP and/or UDP transfers to measure the available throughput in an end-to-end path. The experiences with each tool are described below. For tools requiring a Unix environment, tests were conducted under Linux Debian 5.0 (Lenny) with kernel version 2.6.26. For Windows, tests were performed under Windows XP Professional SP3.
A. Netperf
Netperf1 is an open source benchmarking tool that can be used to measure various aspects of networking performance. Its primary focus is on bulk data transfer and request/response performance using either TCP or UDP and the BSD socket interface.
Netperf is designed around the basic client-server model. There are two executables (netperf and netserver). The
netserver program can be invoked by inetd (the system daemon), or can be run as a standalone daemon. In the first method, users must have administrator privileges; the second method implies that users must remember to run the program explicitly. Unless users want to change the default port (option
-p) or want to work with IPv6 (option -6) instead of IPv4, the server is invoked without options.
1) Installation and Documentation
We installed Netperf using Aptitude, a Debian package management utility. In order to do so, we had to edit the
/etc/apt/sources.list file (root privileges are required), to add the non-free branch indicator in the listed mirrors, so the package could be found. Installation from source files is also possible when the binary distribution is not available. For our
1 http://www.netperf.org
Debian, the compilation of the source code was quite easy. Documentation can be found at the official website. It includes detailed information on how to install the tool using the source files and a general description of the tool. It also describes how different tests can be done, including bulk data transfer and request/response performance experiments. Finally, it has a section with examples and some troubleshooting recommendations.
Information reported in the man pages was not accurate. In fact, many described options are inconsistent with their actual use in the tool. We suppose that the man pages have not been upgraded with new releases of the tool and correspond to an old release. So, we recommend to follow indications from the tool’s help (invoked with the -h option) instead of using the man pages.
2) Testing and Usability
Netperf can be executed from a console using the command
netperf -H <hostName|IPAddress>, specifying the remote host name or IP address. When netperf is executed, a control connection is established to the remote system (netserver) to pass test configuration parameters and results to and from the remote system. The control connection is a TCP connection using BSD sockets.
The duration of the test can be configured. Final report includes sender and receiver socket size in bytes, sent message size in bytes, duration of the test in seconds, and throughput. Results are reported as a table. It is possible to change units for the output, but it has to be set at the beginning of the test.
3) Supported Platforms and Protocols
Netperf is only supported by Unix platforms. It is possible to use IPv4 or IPv6 as the network layer protocol, just by specifying the option -4 or -6 respectively. It allows the usage of both TCP and UDP as the transport layer protocol.
B. D-ITG
D-ITG2 (Distributed Internet Traffic Generator) is an open source packet level traffic generation platform to produce IPv4/IPv6 traffic for variable inter-departure time and packet size. It is conceived to be used as a distributed performance tool, able to measure one-way-delay (OWD), round-trip-time (RTT), packet loss rate, jitter and throughput [1].
D-ITG follows the client-server model. There are four basic executables that implement the platform components:
ITGSend, ITGRecv, ITGLog, and ITGDec. ITGSend acts as the client, and can generate several data flows simultaneously as specified by the input file (configuration file). ITGRecv acts as the server and can receive several data flows from different clients simultaneously. ITGLog is the log server for the platform, and receives information from ITGSend and
ITGRecv. ITGDec is a utility to analyze the results of the experiments. Additionally there are two more executables,
ITGPlot and ITGapi. ITGPlot is an Octave3 based tool to plot data contained in log files obtained with ITGDec (such as
delay.dat, bitrate.dat, jitter.dat and packetloss.dat), which 2 http://www.grid.unina.it/software/ITG/index.php
contain an average of the delay, bit rate, jitter and packet loss rate, respectively, that is calculated each millisecond and reported in the respective file. ITGapi is a C++ API that enables the remote control of traffic generation.
When D-ITG is executed, a control connection is established to the remote system, to pass test configuration parameters such as network protocol to use.
1) Installation and Documentation
We downloaded the D-ITG-2.3-Familiar.zip file for our Linux, which contains the precompiled binaries to execute this tool. This version did not work on our system. Then we tried with the D-ITG-2.6.1d.zip file, which contains the source files for compilation. Following compilation instructions included in the distribution, we used the make command and could not compile the source files. We presume incompatibility issues between the tool and our Linux system version. Finally, we tried on an older version of Debian, with 2.6.24 kernel; this time we could compile the source files without problems, and transfer the resulting binary files to our original system, where they were executed correctly.
We downloaded files D-ITG-2.6.1d-WINbinaryIPv4.zip and
D-ITG-2.6.1d-WINbinaryIPv6.zip for Windows. They contain the binary files ready for execution. No installation process is required.
Documentation can be found at the official website. It includes a manual (which can also be accessed from the tool with -h option) and several examples of use.
2) Testing and Usability
D-ITG is able to measure one-way-delay, round-trip-time, packet loss rate, jitter and throughput.
The tool can work in two modes: single mode and script mode. The single mode allows the generation of a single flow of packets from a client (ITGSend) to the server (ITGRecv). The script mode enables ITGSend to simultaneously generate several flows from a single client. Each flow is managed by a single thread, and an additional thread is acting as master and coordinates the other threads. To generate n flows, the script file (input file) has to contain n lines, each of which is used to specify the characteristics of one flow.
Execution is started via console (no GUI is offered) using different options provided by the tool, which can be consulted with the -h option. Some configurable parameters include TTL (Time to Live), inter-departure time, payload size and protocol type.
3) Supported Platforms and Protocols
D-ITG is available for Unix platforms as well as Windows platforms. IPv4 and IPv6 are both supported as network layer protocols; in Unix, to select one or the other users must specify the right type of IP address (IPv4 address or IPv6 address) with the –a option in ITGSend. In Windows there are two different binary files for IPv4 support and IPv6 support.
By default, UDP is used as the transport layer protocol, but it is possible to use TCP and even ICMP. Upper layer protocols supported include Telnet, DNS, and RTP for VoIP applications.
C. NetStress
NetStress4 is a simple benchmarking tool used to measure network performance for both wired and wireless networks. It employs bulk data transfer using TCP. Network performance is reported in terms of throughput. Once again, the client-server model is used during the testing process.
1) Installation and Documentation
NetStress installation is very easy. Once downloading the setup file, we only executed it and follow the installation assistant’s instructions.
At the official website there is a link to the NetStress help file that contains a brief description of the tool and its purpose, the system requirements, and explanations about how to run the server and the client. Additionally, it includes a section on how to interpret the results. This help can also be accessed within the application, in the Help menu choosing the Contents option.
2) Testing and Usability
NetStress only measures the maximum network throughput. It provides a GUI where users can select from different options. Once started, a mode must be selected: server or client. The server listens for network packets, whereas the client transmits network packets. The tool reports the amount of bytes sent, bytes received, and the throughput, in text mode and graphically.
There is no stop button, no way to specify the duration of the experiment or the amount of data to transfer, so users must close the application to stop the experiment.
3) Supported Platforms and Protocols
NetStress was developed for Windows platforms. It employs IPv4 at the network layer and TCP at the transport layer. It does not offer support for other protocols.
D. MGEN
The Multi-Generator5 (MGEN) is an open source benchmark developed by the PROTocol Engineering Advanced Networking (PROTEAN) research group at the Naval Research Laboratory (NRL). MGEN provides the ability to perform IP network performance tests and measurements using UDP/IP traffic. It supports both, unicast and multicast traffic generation. It follows the client-server model, using the same program for both ends.
Currently, two different versions (3.X and 4.X) are available, which are not interoperable. Some versions of MGEN (such as 3.X) have a graphical user interface. MGEN version 4.X must currently be launched from the command-line.
1) Installation and Documentation
Two packages are available for Linux platforms: source code and a precompiled version. We installed it from the source files to guarantee system compatibility. We started to uncompress the tar ball and used the command make –f Makefile.linux, since there are several makefiles for Unix systems and one must be chose according to the target system. For Windows platforms there is no need for installation, since the ZIP file includes an executable file ready to use.
The distribution contains an HTML file with extensive documentation. It explains the tool’s usage and different options. It also offers several examples on how to use the tool to evaluate performance.
2) Testing and Usability
Input files (configuration files) can be used to drive the generated loading patterns over the time. A command-line option is also available.
Input files can be used to specify the traffic patterns of unicast and/or multicast UDP/IP applications. Defined data flows can follow periodic (CBR), Poisson, and burst patterns. These data flows can be modified during the experiment, since the input file allows changing a given data flow in a determined time. Some fields of the IP header can be set. When a multicast flow is defined, users can specify the TTL (Time to Live) value. For both unicast and multicast flows, the ToS (Type of Service) value can also be specified. For IPv6 flows, a Flow Label value can be defined. For multicast flows, users can control when to join or leave the multicast group, indicating the IP address of the multicast group to join or to leave and the time.
Results are shown on standard output, or can be redirected to a logfile for later analysis. These results are only the report of the packets exchanged; no additional information is given.
To obtain statistics, users must record the results in a logfile, which can be later used as the input of the trpr6 (Trace Plot Real-time) program. trpr analyzes the output of MGEN and creates an output suitable for plotting. It also supports a range of functionalities for specific use of the gnuplot7 graphing program. Important results, such as throughput, delivery latency, loss rate, message reordering, and multicast join/leave latency can be calculated from the information in the output logfile. However, it is left to users to do this calculation.
3) Supported Platforms and Protocols
The updated version of the MGEN toolset, MGEN 4.0, provides support for Win32 platforms in addition to a broad base of Unix-based platforms, including MacOS X.
Several enhancements are planned, including support for TCP, since MGEN currently only supports UDP. IPv4 and IPv6 can be used as the network layer protocol.
E. LANforge
Candela Technologies’ LANforge8 consists of two tools:
LANforge-FIRE configuration, used for traffic generation that simulates the edge of the tested network; and LANforge-ICE
feature set that is used to simulate the core of a network.
LANforge is a proprietary tool that can be purchased at its website. Candela Technologies offers several options of purchase. To obtain this tool we subscribed and created an account which enabled us to download a trial version of the tool.
1) Installation and Documentation
To install LANforge in a Linux platform, the
LANforgeServer-X.Y.Z_Linux-x64.tar.gz file is needed (where 6 http://pf.itd.nrl.navy.mil/protools/trpr.html
7 http://www.gnuplot.info
8 http://www.candelatech.com/lanforge_v3/datasheet.html
X.Y.Z stands for the version, in our case it was version 5.0.9). Once uncompressed, we executed the install.bash file. A home directory for the tool is required. As a default, /home/lanforge
is used, but users can change it by executing install.bash –d <directory>. Once executed install.bash, we had to run the
lfconfig script (with the --cwd options) from the tool’s home directory. Both scripts are self explanatory, giving users enough feedback. For the GUI (Graphic User Interface), we had to install the LANforgeGUI_X.Y.Z_Linux.tar.bz2 package, and execute the lfgui_install.bash file.
For the installation in the Windows platform, we downloaded two files: LANforge-Server-X.Y.Z-Installer.exe
and LANforge-GUI-X.Y.Z-Installer.exe.Then, we just followed the installation assistant’s instructions. The installation process is easy and fast.
There is complete documentation available at the website, including an user guide, an installation guide, and an upgrade guide for every package. The installation guide includes a step-by-step description of the installation process; and a troubleshooting section. Also, there are tutorials available at the website. These include explicit examples on how to use the tool for different scenarios, completed with detailed screenshots to describe the configuration and testing process.
2) Testing and Usability
LANforge is a tool that allows simulating networks and performing tests over them. It includes a GUI that makes the test process easier. There are several tests that can be performed with this tool, including configuration of virtual routers (only for the Linux version). Some of the results that can be obtain with this tool are bytes received and transmitted, packets received and transmitted, bits per second (bps) received and transmitted, collisions and errors; these results are shown in text and graphically, in real time.
Users can configure many details of the test, including number of packets to send, interface type of the endpoint to simulate (ISDN, T1, modem, etc), and even custom payloads can be defined. LANforge also incorporates a VoIP Call Generator which currently supports H.323 and SIP (Session Initiated Protocol). The voice payload is transmitted with RTP (Real-time Transport Protocol) which runs over UDP. RTCP (Real-time Transport Control Protocol) is used for latency and other accounting. Jitter buffers are used to smooth out network jitter inherent in RTP traffic.
WAN links can also be simulated and tested. These are able to add various characteristics to the traffic flowing though them, including maximum bandwidth, latency, jitter, dropped packets, duplicated packets, bit and byte errors, etc. Results are reported in text and graphically, using a vertical bar graph.
The LANforge GUI has many tabs grouping different test, and can be confusing trying to use it because of the many options offered. However, there is a detailed description of each tab at the GUI User Guide that can be found at the website. This guide shows several examples and screenshots that clarify the process.
3) Supported Platforms and Protocols
platforms (Solaris platform was not included in this research). Supported protocols include, but are not limited to, raw Ethernet, MPLS, IPv4, IPv6, ICMP, OSPF, BGP, UDP, TCP, FTP, HTTP, and HTTPS.
F. Network Traffic Generator
Network Traffic Generator9 is an open source tool that generates TCP or UDP traffic from client(s) to server(s) to stress routers and firewalls under heavy network load. It does not report performance results (bandwidth, delay, packet loss rate), but only sends traffic in order to saturate network devices. The tool uses the client-server model. The tar ball includes two executable files: trafserver and trafclient, which are the command-line server and client, respectively. There are plans to include a GUI soon.
1) Installation and Documentation
Installation process is simple following instructions from the
README file included in the tar ball. We used the autoconf
and configure scripts. Then we started the compilation with the
make command. Root privileges are required for installation. Documentation is offered via a README file included in the tar ball, and also in the tool’s help, that can be accessed by executing the client without parameters. No man pages are offered.
2) Testing and Usability
All parameters are provided via console, there is no option to create an input file (configuration file) in order to accelerate the testing process for repeated tests. It is possible to specify the protocol to use (TCP or UDP), the payload size, and the number of clients to send traffic.
3) Supported Protocols and Platforms
Network Traffic Generator works on Unix platforms. Supported transport protocols are UDP and TCP. IPv6 is not supported, only IPv4.
G. Rude & Crude
Rude10 (Real-time UDP Data Emitter) is a small program that generates network traffic, and Crude (Collector for Rude) receives and logs the traffic generated by Rude, following the client-server paradigm. Currently, they only generate and measure UDP traffic.
1) Installation and Documentation
To install Rude we downloaded the package and uncompress it. Then, we used the configure script to create a makefile, and use it by executing the commands: make and make install. Root privileges are required for installation.
Documentation is offered via man pages which are available once the tool is installed. Also, installation instructions can be found at the website.
2) Testing and Usability
The operation and configuration is similar to MGEN, but these two projects do not share any code. Users must write an input file (configuration file) that outlines the experiment. Multiple flows can be defined in the input file. An example file
9 http://sourceforge.net/projects/traffic 10 http://rude.sourceforge.net
is included in the documentation, and it is also described in the man pages. Reports are shown in the standard output by default, but can be redirected to a log file in order to process results later on. Results include statistics of number of received packets, number of received packets out of sequence, lost packets, total bytes received, average delay, jitter, and throughput. For the average delay report, clocks of computers must be synchronized.
3) Supported Platforms and Protocols
The tool runs over Unix platforms. Supported protocols are UDP/IPv4.
H. WLAN Traffic Visualizer
WLAN Traffic Visualizer11 (WlanTV for short) provides measurement of traffic load and visualization of sequence of frames in IEEE 802.11 WLANs [16]. WlanTV is published under the GPL terms. It is developed in Java and both source and JAR distributions are available for download at the website.
1) Installation and Documentation
WlanTV requires Wireshark 12 (Windows) or TShark (Linux), and JRE 1.6 (Java Runtime Environment) or later for building and running the program. Only standard Java packets are needed. It uses Tshark to parse the log files and to do live captures. We installed WlanTV from the JAR distribution and used the command java –jar wlantv.jar, which opens a GUI from where users can run the experiments.
Documentation is not very extensive. The distribution includes a very small README file with few instructions about system prerequisites and not many instructions about installation and execution. However, an example of capture is available for download at the website.
2) Testing and Usability
This tool does not use the client-server model. Only one computer is needed to conduct the experiments. It sniffs the traffic of an IEEE 802.11 network and reports results from that capture. For the experiments, users can employ a file from a previous capture, or they can start a new live capture. In the later option, users must stop the live capture in order to observe the results; which include frame count, byte count, capture duration, transmission rate during the capture, detailed information for each packet (protocols, length, addresses, etc.), and bandwidth distribution. Results are shown in text mode and graphically.
3) Supported Platforms and Protocols
WlanTV is available for Linux and Windows platforms. This tool reports statistics for 802.11 protocols.
IV. COMPARATIVE ANALYSIS
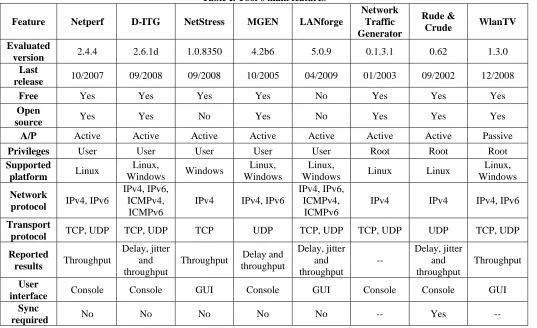
Table I presents the main characteristics of the reviewed tools. We consider some interesting features such as: date of the last release, A/P, privileges, supported platforms, protocols, reported results, and clock synchronization.
Table I. Tool’s main features
Feature Netperf D-ITG NetStress MGEN LANforge Network
Traffic Generator
Rude &
Crude WlanTV
Evaluated
version 2.4.4 2.6.1d 1.0.8350 4.2b6 5.0.9 0.1.3.1 0.62 1.3.0
Last
release 10/2007 09/2008 09/2008 10/2005 04/2009 01/2003 09/2002 12/2008
Free Yes Yes Yes Yes No Yes Yes Yes
Open
source Yes Yes No Yes No Yes Yes Yes
A/P Active Active Active Active Active Active Active Passive
Privileges User User User User User Root Root Root
Supported
platform Linux
Linux,
Windows Windows
Linux, Windows
Linux,
Windows Linux Linux
Linux, Windows
Network
protocol IPv4, IPv6
IPv4, IPv6, ICMPv4,
ICMPv6
IPv4 IPv4, IPv6
IPv4, IPv6, ICMPv4,
ICMPv6
IPv4 IPv4 IPv4, IPv6
Transport
protocol TCP, UDP TCP, UDP TCP UDP TCP, UDP TCP, UDP UDP TCP, UDP
Reported
results Throughput
Delay, jitter and throughput
Throughput Delay and throughput
Delay, jitter and throughput
--
Delay, jitter and throughput
Throughput
User
interface Console Console GUI Console GUI Console Console GUI
Sync
required No No No No No -- Yes --
The date of the last release is important since it can point out how active is the project. The A/P category indicates if the tool is Active (A) or Passive (P). Active tools will affect the normal traffic in the network, by injecting their own packets; while passive tools only capture the traffic that pass through the interface. Row Privileges gives information about the user permission required to install or run the application. We limited the study of supported platforms to Linux and Windows. For protocols, we concentrated on network and transport layer protocols. For the Reported results we include delay, jitter and throughput. In the row labeled Sync required, we indicate if clock synchronization is required between computers that run some of the processes involved in tests. We used ‘--’ for features not available or supported by some tools.
According to Table I, some projects are more active than others. It seems that Rude & Crude and Network Traffic Generator have not been active for a while, since the last version was released more than 6 years ago. Another important issue is the pricing. Most of the evaluated tools are free, except
LANforge. LANforge pricing starts at $1999 (USD); this could be an impediment for some researchers or network administrators. It is also important to notice if the tool is active or passive. Among the studied tools, only WlanTV does not include additional overhead to the network by injecting traffic; however this also implies that this tool is not able to measure the throughput, but only reports results of the transmission rate for the captured packets during the test.
We also noticed that Network Traffic Generator and Rude &
Crude expect root privileges for installation; while with
WlanTV users must have root privileges for execution since the tool requires to set the network interface card in promiscuous mode. We can say that Linux stands out as the most popular platform in this group of tools. Also, we can see that most of the studied tools already have IPv6 support. Network throughput is the most common reported result; followed by delay and jitter.
Network Traffic Generator does not report any results, since its main objective is to inject traffic into the network to stress switches and routers.
In relation to the user interface, just a few tools have a GUI (NetStress, LANforge, and WlanTV). To facilitate the testing process, some tools (D-ITG, MGEN, and Rude & Crude) use an input file that contains the parameters for the tests and the description of the streams, which is more flexible than the traditional command line arguments.
One last issue of great importance is the clock synchronization, especially when measuring delays. Manual clock synchronization is not recommended because of its poor accuracy. One solution is using NTP (Network Time Protocol); this requires additional knowledge and configuration.
V. CONCLUSIONS AND FUTURE WORK
In this paper, we presented the results of an analysis in which we evaluated and compared several current network benchmarking tools. We studied eight tools: Netperf, D-ITG,
& Crude, and WlanTV. Evaluation was categorized in installation and documentation, testing and usability, and supported platforms and protocols. Table I summarizes the results of our study. We have seen that none of the eight tools is a clear winner, so in general, users must install several of these tools to perform basic performance tests. Netperf is a simple tool and users can easily learn how to use it; however results of testing are limited to throughput. D-ITG is a more powerful tool and reports more results, such as jitter, delay, and throughput; however, times reported by D-ITG for delay are not realistic. In our experiments, we had delays of over one hour. It was not an installation problem, since there are some tests reported in the
D-ITG manual with similar times. Furthermore, users must face some problems during installation in some Debian versions.
NetStress is an easy-to-work-with tool that also offers a GUI; but has poor protocols support, and tests cannot be neither parameterized nor stopped. MGEN allows the parameterization of tests, and also offers a complete documentation; however, it’s not that simple to learn how to use it, because of the many options it offers. Moreover, it does not show results directly, and users must calculate them from the information of the exchanged packets.
LANforge provides support for many different protocols and tests; it is easy to install and offers good documentation.
Network Traffic Generator can be used to stress devices (switches and routers), even though it does not reports results.
Rude & Crude is very easy to use and offers many different gauges to evaluate network performance. WlanTV is a passive tool that offers relevant indicators of performance for traffic captured in a WiFi network.
For future works, we plan to design and implement our own network benchmarking tool that incorporates the strengths of the evaluated tools, but eliminates their weaknesses, following the client-server model. Our tool would be compliant with RFCs 1242 [3], 2544 [4] and 5180 [11], where a set of recommendations are given to develop benchmarks. One of our main interests is to offer support for IPv6 protocol. Also, it will be distributed under the GNU General Public License, allowing users to modify the source code for any particular requirements. Among the features we plan to include in our tool is the determination of packet loss rate, throughput and RTT for different protocols (e.g. TCP, UDP, ICMP, and IP). Tests also would be parameterized, allowing users to define traffic generation following different models (random variables), including CBR, burst traffic, Poisson, Exponential and Pareto. Also, users should be able to specify values for some header fields, such as TTL and ToS in IPv4, and CoS (Class of Service), Hop Limit and Flow Label in IPv6.
As shown in our analysis, most of the tools do not have specific supports for WiFi. For IEEE 802.11, only end-to-end performance evaluation is offered. Users have no way to obtain results of performance (bandwidth, delay, packet loss rate) between a mobile station and an access point (or wireless router). So we also plan to adapt the tool that we will develop for use in access points. This development will be made for
access points that are supported by DD-WRT13 or OpenWrt14, two free Linux-based firmware for several wireless routers. Both projects are considered third-party firmware solution designed to replace the firmware that ships pre-installed on many commercial wireless routers.
ACKNOWLEDGMENT
We would like to thank Candela Technologies for the trial version of their tool (LANforge), which allowed us to include it in our study.
REFERENCES
[1] A. Botta, A. Dainotti, and A. Pescapé. Multi-Protocol and Multi-Platform Traffic Generation and Measurement. INFOCOM 2007 Demo Session. May 2007.
[2] A. Botta, A. Pescapé, and G. Ventre. On the Performance of Bandwidth Estimation Tools. In proceedings of the 2005 Systems Communications (ICW’05). August 2005.
[3] S. Bradner. Benchmark Terminology for Network Interconnection Devices. RFC 1242. July 1991.
[4] S. Bradner and J. McQuaid. Benchmarking Methodology for Network Interconnect Devices. RFC 2544. March 1999.
[5] E. Gamess and K. Velásquez. IPv4 and IPv6 Forwarding Performance Evaluation on Different Operating Systems. XXXIV Conferencia Latinoamericana de Informática (CLEI 2008). September 2008. [6] D. Gupta, D. Wu, P. Mohapatra, and C. Chuah. Experimental Comparison
of Bandwidth Estimation Tools for Wireless Mesh Networks. IEEE INFOCOM Mini-Conference. April 2009.
[7] M. Jain and C. Dovrolis. Pathload: A Measurement Tool for End-to-End Available Bandwidth. In Proceedings of Passive and Active
Measurements (PAM) Workshop. March 2002.
[8] V. Kumar, M. Korpi, S. Sengodan, and V. Kumar. IP Telephony with H.323: Architectures for Unified Networks and Integrated Services. Wiley; 1st edition. March 2001.
[9] L. Mingzhe, M. Claypool, and R. Kinicki. WBest: a Bandwidth Estimation Tool for IEEE 802.11 Wireless Networks. In Proceedings of 33rd IEEE Conference on Local Computer Networks (LCN). October 2008.
[10] F. Montesino. Assessing Active Bandwidth Estimation Tools in High Performance Networks. TERENA Networking Conference. June 2004. [11] C. Popoviciu, A. Hamza, G. Van de Velde, and D. Dugatkin. IPv6
Benchmarking Methodology for Network Interconnect Devices. RFC 5180. May 2008.
[12] R. Prasad, M. Murray, C. Dovrolis, and K. Claffy. Bandwidth Estimation: Metrics, Measurement Techniques, and Tools. IEEE Network, vol. 17 No. 6, Nov-Dec 2003, pp. 27-35. April 2004.
[13] V. Ribeiro, R. Riedi, R. Baraniuk, J. Navratil, and L. Cottrell. pathChirp: Efficient Available Bandwidth Estimation for Network Paths. In Proceedings of Passive and Active Measurements (PAM) Workshop. April 2003.
[14] J. Rosenberg, H. Schulzrinne, G. Camarillo, A. Johnston, J. Peterson, R. Sparks, M. Handley, and E. Schooler. SIP: Session Initiation Protocol. RFC 3261. June 2002.
[15] J. Strauss, D. Katabi, and F. Kaashoek. A Measurement Study of Available Bandwidth Estimation Tools. IMC2003. October 2003. [16] S. Ubik and A. Král. End-to-End Bandwidth Estimation Tools. CESNET
Technical Report. 25/2003. November 2003.
[17] H. Unander and W. Wenjuan. Accurate Measurement and Visualization of Traffic Load in IEEE 802.11 WLANs. Master Thesis. University of Agder. Norway. May 2008.