Automated Facial Expression System using PCA
Algorithm
Noreen Akram
Telecommunication Engineering Department
Sir Syed University of Engineering and Technology
Karachi, Pakistan
Naeem Abbas,
PhD
Electrical and Power Engineering
National University of Sciences and Technology
Karachi, Pakistan
ABSTRACT
Facial expressions are important aspect of human communication. Human beings can identify facial expressions without any difficulty but this job is very difficult for computers to do. The purpose of this research paper is to develop such system which can identify the facial expressions of human beings in real time with minimum error. For the FER (i.e. Facial Expression Recognition), three steps are used; face detection, facial feature extraction and finally classification of expression. Technique used for facial feature extraction is Principal Component Analysis (PCA).
General Terms
Facial Expression Recognition, Principal Component Analysis
Keywords
Facial expression recognition; PCA (Principal Component Analysis); Japanese Female Facial Expression (JAFFE) database
1.
INTRODUCTION
In non-verbal communication, facial expression plays a major role since the thoughts and feelings of one’s personality are reflected by the expressions on one’s face.
According to the study, facial expressions make up 55% [1] of the overall human interaction.During the last few years, a lot of investigation has been done to develop resourceful methods for detection of human expressions. Face Expression recognition approach (As per Anastasios et al. [[1]) can be sub-divided into three major steps. To extract facial features, a number of methods have been developed like Principal Component Analysis (PCA), Linear Discriminate Analysis (LDA), Gabor Filter/Energy, Neural Network and Independent Component Analysis (ICA), Local Binary Pattern (LBP), Support Vector Machine, Active Appearance Model (AAM) [3] and by using SIFT descriptor. Yang and Zhang suggested a method with the idea of two-dimensional Principal Component Analysis i.e. 2DPCA. In this technique [4] 2D image matrices are utilized instead of linear vector. Principal Component Analysis is to be done in new approach of 2- dimensional Principal Component Analysis. It is proposed by Turk and Pentland [5] in 1991 that Image faces can be detected by using residual errors and Eigen faces methods.
A shortcoming of using 2DPCA is that more coefficients are needed in the representation phase of image in the 2DPCA subspace and higher order vector of the image are ignored because of the linear nature of 2DPCA.
2.
PROPOSED FACIAL EXPRESSION
RECOGNITION SCHEME
The seven basic emotions, namely happy, disgust, neutral, anger, sad, surprise and fear can be identified by the system.
[6]JAFFE (The Japanese Female Facial Expression)
Database is used in the proposed method.
3.
PCA ALGORITHM DEVELOPMENT
The PCA algorithm for the face recognition system [7] is developed in following three phases.
Training phase
Testing phase
Recognition phase
3.1 Training Phase
3.1.1 Acquire a set of data
Hence the training set becomes: p1, p2, p3....pM. It can be generalized as
𝑥𝑖= 𝑝1… 𝑝𝑁 𝑇 , 𝑖 = 1, … . . , 𝑀 (1)
3.1.2
Mean
The mean image is calculated by
𝑚 = 1
𝑀 𝑥𝑖
𝑀
𝑖=1 (2)
3.1.3
Mean subtraction
𝑤𝑖= 𝑥𝑖− 𝑚 (3)
3.1.4
Calculation of the co-variance matrix
𝜆𝑖= 𝑀1 𝑒𝑖𝑇𝑤𝑛 2 𝑀
𝑛=1 (4)
It has been shown that the ei’s and λi’s are given by the eigenvectors and eigen values of the covariance matrix
𝐶 = 𝑊𝑊𝑇 (5)
3.1.5
Calculation of eigenvectors and eigenvalues
of the covariance matrix
A common theorem in linear algebra states that the vectors eiand scalars λi can be obtained by solving the eigenvectors and eigenvalues of the M x M matrix WTW.
Let di and μibe the eigenvectors and eigenvalues of WTW, respectively.
𝑊𝑇𝑊𝑑
𝑖= 𝜇𝑖𝑑𝑖 (6)
Multiplying both sides by W,
𝑊𝑊𝑇 𝑊𝑑
𝑖 = 𝜇𝑖 𝑊𝑑𝑖 (7)
3.1.6
Calculation of Eigen faces
33
3.1.7
Projection of training images
Ω= 𝑣1𝑣2… 𝑣𝑀 (9)
3.2
Testing Phase
3.2.2
Projection of input image
𝛺𝑟= 𝑣1𝑣2… 𝑣𝑀 T (10)
Where,
𝑣
𝑖= 𝑒
𝑖 𝑇(𝑤
𝑟
− 𝑚)
3.3
Recognition Phase
Recognition is done by performing below step.
3.3.1
Find the Euclidean Distance
є𝑟= || (𝛺 − 𝛺𝑟) || (11)
If єr is less than some predefined threshold, a face is classified as belonging to the class r.
3.4
Flow Diagram of Facial Expression
[image:2.595.330.530.68.331.2]Recognition
Fig 1: Flow Diagram of Facial Expression Recognition
3.5
Proposed Facial Expression
Recognition scheme
[image:2.595.58.293.246.515.2]Following cases presented in the Figure 2 are proposed by using PCA algorithm.
Fig.2: Expression Recognition Layout
3.5.1
Full Face Database
Now the same algorithm (tested for face recognition) is tested for the facial expression recognition. The image size 256x256 is considered in different approaches for the Full face database .These approaches are described by considering following cases.
3.5.1.1
Case I: (Single Trained, Single tested)
Fig 3: Case I of FULL FACE
In the first case, algorithm is tested on a single subject. The system runs to compare the Euclidean distance of the trained images and the test images, for determining their closest match.
The recognition process is defined by a block diagram in Figure 3.
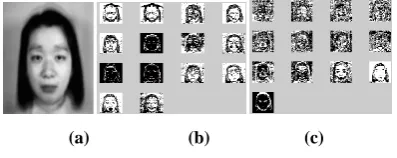
Firstly, 14 images of S1 subject are trained by calculating their mean. Then each image is subtracted from mean image to find the mean centered images. On the basis of these subtracted images, eigen faces are calculated. This complete trained process is shown by Figure 4
(a) (b) (c)
Fig 4: (a) Mean Image (b) Subtracted Images (c) Eigen Faces
Trained
Tested
Recognition
S1 14
07
FULL FACE
CASE I
Single trained
Single tested
CASEII
Multiple trained
Multiple tested
CASE III
Single trained
Multiple tested
CASE IV
Multiple trained
Multiple tested
EXRESSION RECOGNITION SYTEM
Training
Database Read Database Images Mean Image
Eigen Faces
Euclidean Distance
Projected Training Image
Projected Test Image
Surprise Angry
Disgust
Happy
Fear Neutral
[image:2.595.321.526.424.526.2] [image:2.595.330.529.664.743.2]In the testing phase, rest 7 images of subject S1 are subtracted to find the projection. After finding the projection of input images onto eigen faces, Euclidean distance is calculated to recognize facial expressions. 7 input images are matched with 14 trained images. 5 images are recognized correctly out of 7 input images. The accuracy of this trial is 71.4286%.
The reason for performing this task was to check the performance of the system with single subject. If the 14 images of a subject are trained and seven images are used as tested images, then the system is capable of recognizing expressions with good accuracy.
3.5.1.2
Case II: (Multiple Trained Subjects,
Multiple Tested Subjects)
(a)
(b)
Fig5: Block Diagram of Case II (a) First Trial (b) Second Trial
In case II, multiple subjects are trained and recognition is done by using the test images of the same subjects as shown in the above Figure 5 .In this case, four experimental trials are considered which are explained in this section.
1. In the first trial, two subjects are considered. Therefore 28 images (14 images of subject S1 and 14 images of subject S2) are trained and 14 images (7 images of S1 and 7 images of S2) are tested as shown in Figure 5(a). The accuracy of this trial is 78.5714%.
2. In the second trial, three subjects (S1, S2 and S3) are considered and the same process described in trail 1 is performed as shown in Figure 5(b) and the databases are shown in Table 3.2. The system accuracy is 76.1905%. 3. The accuracy of the third trial is found to be 75%. 4. In the fourth trial, the accuracy is 60%.
3.5.1.3
Case III: (Single Trained Subject,
Multiple Tested Subjects)
Fig6: Block Diagram of Case III
[image:3.595.59.284.194.446.2]The reason for considering this approach was to find the accuracy of the system when trained subjects are of different persons and they are tested with different persons and then compare its performance with the previous two cases.
Table 1: Trained Images
Expressions Trained Images
of Subject S1
Angry
Disgust
Fear
Happy
Neutral
Sad
Surprise
In this case, the database of 10 Japanese girls are considered having seven different emotions i.e. angry, disgust, fear, happy, neutral, sad and surprise. Each girl emotion image is taken in 3 different poses. So in the database, there are 210 images. The training images of Subject S1 are displayed in Table 1. Firstly, mean of these S1 images is calculated by summing all S1 images. Secondly, each image of S1 is subtracted from mean image. The threshold value is set so that the 20 Eigen faces with highest eigen values can be selected. In the next step, the projection of training images (i.e. S1) onto eigen faces is calculated.
In the testing phase, 9 subjects (189 images) are considered and tested simultaneously. Tested subjects of each Japanese girl are shown in Table 2. This process is described by the block diagram in Figure 6.29 images are correctly recognized in this case so the accuracy of these 29 images out of 189 is 15.3439%.
Trained
Tested
Recognition S1
S2 S3 S4 S5 S6 S7 S8 S9 S10
Tested
Recognition S2
14
07
07
14 14
07
S1 S3
Trained Trained
Tested
Recognition
S2
14
07 07 14
[image:3.595.54.279.631.742.2]35
Table 2: Test Subjects
Subjects S2 S3 S4 S5
Test
Database
S6 S7 S8 S9 S10
3.5.1.4
Case IV: (Multiple Train Subject, Multiple
[image:4.595.334.521.252.476.2]Test Subjects)
Fig 7: Block Diagram of case IV
In this case same ten subjects are considered (i.e. ten subjects of case III) and experiment is performed in eight trails. Trained subjects and tested subjects are different i.e. system is trained by different persons and tested with different persons (as it is done in case III). It is shown in Fig 7. Each subject has 21images (i.e. 7expressions images with 3 different poses). Description of training and testing images is given below.
In the first trial 42 images are trained (i.e. 21 images of subject1 and 21 images of subject2) and tested with the images of other 8 subjects (i.e. 21*8= 168 images).
In the second trial 63images are trained (i.e. 21 images of subject1, 21images of subject2 and 21images of subject3) and tested with other 7 subjects (i.e. 21*7= 147) And so on….
It is observed that no of subjects are increased in training phase and no of subjects are decreased in testing phase in each trial. This experiment is performed for two reasons. First reason is that if the trained image subjects and tested image subjects are different, does the system is capable of recognizing expressions correctly? , And the second reason is that what will be the accuracy if the no of subjects are ten. The accuracy of this case is found to be 21%. When this accuracy is compared with previous two cases I and II, it is observed that only few expression are recognized because due to trained and test subjects are different. Therefore the value of Euclidean distance is greater, so all expressions are not recognized. That’s why this approach was not practical because of its worst accuracy. Since the accuracy is not good by increasing the number of subject in FULL FACE database.
4.
RESULTS AND DISCUSSION
In this section, results obtained by performing different experimental trials are discussed.
4.1
Full Face Database
In FULL FACE database, five cases were considered. The results obtained by considering these cases are discussed below:
4.1.1
CASE I and CASE II:
In Case I, single subject is considered for training and testing. The accuracy of Case I is 71.428%. In Case II, multiple subjects are considered and trained and tested with same subjects. The experimental results demonstrate for Case II is that the accuracy is 78.57%. Results of Case I and II are shown in the following fig8
Fig8: Accuracy of Case I and Case II
4.1.2
CASE III and CASE IV:
In Case III, single subject has trained and tested with multiple subjects.
The accuracy achieved in this case III is 15.34%. In Case IV, multiple subjects have trained and tested with multiple subjects. The accuracy for this case IV is 21.14%.
Results of these cases are shown in Fig9.
0 10 20 30 40 50 60 70
10 20 30 40 50 60 70 80
Eigen Faces
A
c
c
u
r
a
c
y
Test Img=07 Test Img=14 Test Img=21 Test Img=28 Test Img=35 Trained
Tested
Recognition S1 S2
S3 S4 S5 S6 S7 S8 S9 S10
Fig9: Accuracy of Case III and Case IV
4.1.3
Drawbacks of Cases I, II, III and IV:
The major drawback of these cases is that, all the subjects are trained simultaneously. If new subject is added to database then all subjects needs to be trained again. This is a time consuming process.
Due to this major drawback, another methodology is applied in which each subject is trained individually.
4.1.4
CASE V
In this Case, each subject is trained individually and compared with tested subjects. The accuracy for considering five subjects is in between 71.42% - 100%
Fig10: Accuracy of Case V
Finally the results of all cases are shown below
Table3: Accuracy of all cases
CASE I CASE II CASE III CASE IV CASE V
71.42% 78.57% 15.34% 21.41%
71.428%-100%
5.
CONCLUSION
In this research work, the most well-known technique of Principal Component Analysis has been implemented. The existing PCA based face recognition systems can be upgraded for Facial Expression Recognition too. The advantage of the proposed approach is that system efficiency is even good for the large database.
6.
REFERENCES
[1]. K. Matsuno, C-W Lee, S. Kimura, S. Tsuji. Automatic Recognition of Human Facial Expressions. In Proceeding of the Fifth International Conference on Computer Vision, Pp. 352-359. 1995.
[2]. Anastasios C. Koutlas, Dimitrios I. Fotiadis “A Region Based Methodology for Facial Expression Recognition” page 1.
[3]. Hong-Bo Deng, Lian-Wen Jin, Li-Xin Zhen, Jian-Cheng Huang “A New Facial Expression Recognition Method Based on Local Gabor Filter Bank and PCA plus LDA”, International Journal of Information Technology Vol. 11 No. 11-2005.
[4]. Yang, J., Zhang, D., 2004, “Two-dimensional pca: a new approach to appearance-based face representation and recognition”, IEEE Transactions on Image Processing, Vol.26, No.1, pp. 131–137, Jan 2004.
[5]. Turk, "Face Recognition using eigenfaces," in Computer Society Conference, IEEE, Pentland, Queensland, pp.586-591, 1991.
[6]. http://www.kasrl.org/jaffe.html
[7]. Louis Asiedu1, Felix .O. Mettle2, Ezekiel N. N. Nortey “Recognition of Facial Expression Using Principal Component Analysis and Singular Value Decomposition” International Journal of Statistics and Systems ISSN 0973-2675 Volume 9, Number 2 (2014), pp. 157-172 Department of Statistics, University of Ghana
0 20 40 60 80 100 120 140 160 180 200
6 8 10 12 14 16 18 20 22
Eigen Faces
A
c
c
u
r
a
c
y
Test Img=189 Test Img=168 Test Img=147 Test Img=126 Test Img=105 Test Img=84 Test Img=63 Test Img=42 Test Img=21
0 2 4 6 8 10 12 14
40 50 60 70 80 90 100
Eigen Faces
A
c
c
u
r
a
c
y
S1 S2 S3 S4 S5
CASE III