Date of publication xxxx 00, 0000, date of current version xxxx 00, 0000.
Digital Object Identifier 10.1109/ACCESS.2017.Doi Number
Delimitated Anti Jammer Scheme for Internet of
Vehicle: Machine Learning based Security
Approach
Sunil Kumar1, Karan Singh1, Senior Member IEEE, Sushil Kumar1, Senior Member IEEE, Omprakash Kaiwartya2, Member IEEE, Yue Cao3, Member IEEE, Huan Zhou4, Member IEEE
1School of Computer & Systems Sciences, Jawaharlal Nehru University, New Delhi, India 2Nottingham Trent University, Nottingham, UK
3School of Computing and Communications, Lancaster University, UK.
4College of Computer and Information Technology, China Three Gorges University, China.
Corresponding author: Huan Zhou (e-mail: [email protected]).
This paragraph of the first footnote will contain support information, including sponsor and financial support acknowledgment. For example, “This work was supported in part by under Grant.”
ABSTRACT Recently, Internet of vehicles (IoV) has witnessed significant research and development attention in both academia and industries due to the potential towards addressing traffic incidences and supporting green mobility. With the growing vehicular network density, jamming signal centric security issues have become challenging task for IoV network designers and traffic applications developers. Global positioning system (GPS) and roadside unit (RSU) centric related literature on location-based security approaches lacks signal characteristics consideration for identifying vehicular network intruders or jammers. In this context, this paper proposes a machine learning oriented as Delimitated Anti Jamming protocol for vehicular traffic environments. It focuses on jamming vehicle’s discriminated signal detection and filtration for revealing precise location of jamming effected vehicles. In particular, a vehicular jamming system model is presented focusing on localization of vehicles in delimitated jamming environments. A foster rationalizer is employed to examine the frequency changes caused in signal strength due to the jamming or external attacks. A machine learning open-sourced algorithm namely, CatBoost has been utilized focusing on decision tree relied algorithm to predict the locations of jamming vehicle. The performance of the proposed anti jammer scheme is comparatively evaluated with the state of the art techniques. The evaluation attests the resistive characteristics of the anti-jammer technique considering precision, recall, F1 score and delivery accuracy metrics.
INDEX TERMS Internet of Vehicles, Location Verification, Jamming Signal, Machine Learning
I. INTRODUCTION
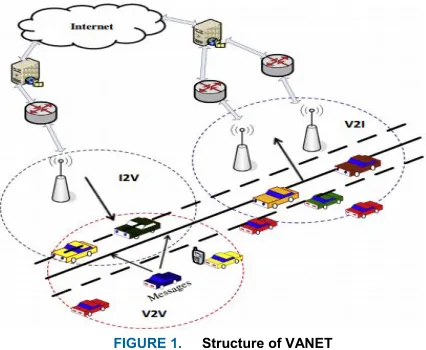
Vehicular networks are emerging as a new promising field of wireless technology, where security is one of the major research theme [1]. A cooperative group of sensor-enabled vehicles operating in a dynamic road traffic network environment by interconnecting among on-road vehicles and, with neighboring Road Side Units (RSUs) are referred to as Vehicular Ad-hoc Networks (VANETs) [2]. The three sorts of data transmission to disseminate cooperative messages includes Vehicle (V2V), Vehicle-to-Infrastructure (V2I) and Vehicle-to-Infrastructure-to-Vehicle (I2V) (see Fig. 1). The sensor enabled vehicles can communicate with each other in V2V data transmission either through direct
Dynamic mobility patterns, frequent connectivity disruptions, and irregular topology changes are some of the examples of challenging communication network environments in VANETs [5, 6]. Even though the traffic congestion leads to channel allocation issue due to unbalanced traffic flow [7]. However, geo-location based routing protocols are being used as different congestion avoidance centric message delivery techniques including geographic routing protocols [8, 9]. Thus, the economic cost incurred in traffic congestion can be reduced by effective route navigation centric routing protocols. However, these protocols lack real-time response to the congestion caused due to the sudden on-road incidences slowing down the timely updates of on-road traffic condition [10].
FIGURE 1. Structure of VANET
A standout amongst the most intriguing issues to be explained with regards to vehicular systems is the strategies by which to give very precise and dependable data sharing in anyplace and whenever constraints. These days, the greater operation parts of the vehicles are relying on a Global Positioning System (GPS), which coordinates communication centric route planning systems at a sensible expense [11]. Nonetheless, GPS experiences poor unwavering quality because of different impediments including signals obstruction and multipath just as deficient precision for independent vehicles. So, as to create precise, and reliable localization systems for self-sufficient vehicular applications, the existing research has mainly considered the improvement of the systems either utilizing more propelled sensors including radar, light detection and ranging (LiDAR) sensor, camera, etc., or by combining ready and off-board vehicular mobility data. The propelled sensors enabled systems provides more precise and dependable position estimations than GPS however at greater computing and communication cost [12]. For example, map coordinating, dead-end route computation, on-street cell localization, picture/video-based incidence guidance, localization administrations and relative distributed ad-hoc localization, and various other confinement strategies, that are utilized in VANETs to conquer such constraints [13].
The anti-jammer centric security approaches in VANETs can be broadly categorized into two types of strategies including GPS and RSU enabled location verification. In GPS enabled strategy, the verification of location happens via either in-vehicle computation or communication enabled cloud computation [14]. Henceforth this type of strategy experiences numerous transmissions related ill impacts and conflict. In conveyed calculation, every vehicle divides its location verification process into a few different ways. Generally, the calculation utilizes two sorts of messages including anchor and beacon messages to verify the position with the help of nearby vehicle [15]. The highly dynamic attributes of vehicular environments such as portability imperatives, driver conduct, and high compact nature of vehicle’s speed displacement causes quick variations in the system topology. These constraints lead to the spread of obsolete localization data in traffic environments particularly with the higher delay in vehicular network. To address the issue of obsolete localization data spread in traffic data transmissions, some innovator contemplates handle this issue by predicting the future localized versatile hub in a little time window in vehicular network environments [16, 17]. For more reliable vehicular localization, RSU based localization systems have been explored which is highly affected by the RSU deployment strategies. The existing RSU enabled localization focuses on improving the preciseness and diminishing the unpredictability of localization calculations [18-20]. However, the dependability on RSU deployment and cost incurred in deployment are the major constraints in these types of localization strategies [21].
Towards this end, this paper presents a machine learning oriented approach for delimitated anti jammer in IoV traffic environments. It focuses on jamming vehicle’s discriminated signal detection and filtration for revealing precise position of jamming effect. It employed Foster rationalizer and Morsel supple filter to avoid and exclude the discriminating signal generated from jamming/attacking vehicles in connected vehicle environments. The delimitated anti jammer scheme is implemented for location prediction to test its resistive performance against jamming vehicles. The key contributions of the paper can be summarized as follows:
1) Firstly, a system model is presented focusing on
localization of vehicles which has been used in delimitated anti jammer scheme.
2) Secondly, a foster rationalizer is employed to examine
the frequency changes (frequency discriminated signal from one vehicle to another) caused in signal strength due to the jamming or external attacks.
3) Thirdly, a Morsel supple filter is used where frequency
4) Fourthly, a machine learning open-sourced algorithm: CatBoost has been used focusing on decision tree relied algorithm to predict the locations of jamming vehicle.
5) Finally, the proposed anti jammer scheme is simulated
and its performance is comparatively evaluated with the existing schemes to show it superiority.
The remaining paper is composed as follows. Section II comprises of recent works reviews related to proposed research work. Section III presents the proposed delimitated anti jammer scheme with mathematical stating’s. Section IV discusses the results obtained from the proposed work, followed by conclusion in section V.
II. RELATED WORK
Alam et al. [22] used a distributed localization algorithm has been proposed to assist GPS-unequipped automobiles in assessing their positions dependent on close-by GPS-prepared vehicles. The proposed calculation can effectively gauge the situation of vehicles that not furnished with GPS, yet it is difficult to recognize circumstances in which vehicles have organize cards to speak with different vehicles however no GPS gears have. Ghafoor et al. [23] proposed a routing protocol based on novel SDN-based for intellectual vehicular systems that finds a steady course among source and goal. As this is an intellectual routing protocol, range detecting is subsequently the essential process of this calculation to improve network dependability by guarding essential client action. There it is connected a conviction engendering calculation over channel determination. This is a SDN-based vehicular transmission conspire where two hubs can possibly impart when they have agreement about a typical inactive channel. This procedure improves the end-to-end system execution delay regarding , high delivery proportion, and low overhead whereas there is a need in incrementing that above property by enhancing the prediction property.
Asuquo et al. [24] explained about the location-based services (LBS) which provides clients with location centric information dependent on their area. Regardless of the alluring highlights given by LBS, the geographic areas of clients are not sufficiently secured. Area protection is among one of the real difficulties in vehicular and portable systems. In this article, we break down the security and protection prerequisites for LBS in vehicular and portable systems. In particular, this paper covers protection improving advances and cryptographic methodologies that give area security in vehicular and portable systems. Yet efficiency parameters like throughput, end-to-end delay, delivery ratio and overhead have to be improved.
Mishra et al. [25] discussed that VANET is a foundation less system. It gives improvement in wellbeing related methods and solace while driving. It empowers vehicles to share data with respect to security and traffic examination. The extent of VANET application has expanded with the ongoing advances in innovation and improvement of shrewd urban communities over the world. VANET give a self-aware
system that has significant effect in improvement of traffic administrations and in lessening street mishaps. Data partook in this system is time touchy and requires vigorous and speedy framing system associations. VANET being a remote specially appointed system, fills this need totally yet is inclined to security assaults. Profoundly powerful associations, touchy data sharing and time affectability of this system, make it an eye-getting field for assailants. Hence the quality parameters have to be ensured along with self-aware property in order to improve the performance.
SampoKuutti et al. [26] compared several types of localization techniques, whereas Light Detection and Ranging (LiDAR) based technique provides higher accuracy. This is achieved by the LiDAR sensor, by which it measures the distance of the target utilizing numerous laser pillars. It estimates the separation dependent over the season of entry of the signal back at the recipient, just as the infrared force of the impediment. However, this localization approach is very expensive and the enhancement is highly subtle to surrounding circumstances like shower or ice. The necessity of power required in high amount is also a major drawback of LiDAR sensors.
From the above related works, [22] described about the issues faced with GPS-unequipped vehicles [23]. States about the need for enhanced prediction property, so as to improve the performance, further, [24] explained about LBS and insist the need for enhancing the performance. Moreover [25] described about the security issues of VANET during localization, in addition [26] stated about LiDAR, which is highly sensitive to environmental. Thus, with all these issues it is observed that to enhance the performance parameter and localization of the node there is a need to improve the prediction property of the system. Similarly, yet more to improve the security from external malicious attacks a new secured and enhanced communication aiding protocol has to be formulated.
III. DELIMITATED ANTI JAMMER SCHEME FOR PREDICTING PRECISE LOCATION
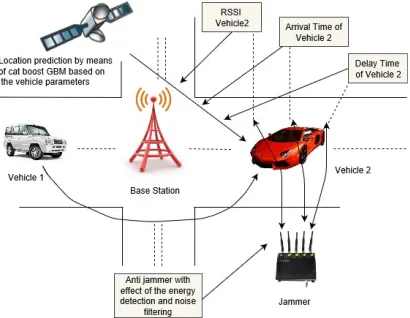
jamming effect or jammer. Finally with the help of Cat Boost, the present location of the jamming element is identified from the previous location based on the Received Signal Strength Indicator (RSSI), signal Time of Arrival (TOA), signal Time of Delay (TOD) centric calculations at each vehicles.
FIGURE 2. Overall representation of Proposed Scheme
A. SYSTEM MODEL
Consider a vehicular network as a Euclidean graph
represented by 𝐺𝐺 = (𝑉𝑉,𝐸𝐸,𝑟𝑟) . Here, 𝑉𝑉=
{𝑣𝑣0 , 𝑣𝑣1 ,𝑣𝑣2 , … … .𝑣𝑣𝑁𝑁−1} is the set of vehicles and |𝑉𝑉| is the number of vehicles in the network. The set of communication
links among vehicles is represented by 𝐸𝐸= {𝑒𝑒(𝑖𝑖,𝑗𝑗)(𝑣𝑣𝑖𝑖,𝑣𝑣𝑗𝑗)∈
𝑉𝑉}. The transmission range of vehicles is denoted by 𝑟𝑟.
Here, 𝑒𝑒(𝑖𝑖,𝑗𝑗)∈ 𝐸𝐸𝑖𝑖𝑖𝑖𝑖𝑖𝑣𝑣𝑖𝑖𝑟𝑟𝑒𝑒𝑟𝑟𝑟𝑟ℎ𝑒𝑒𝑒𝑒𝑣𝑣𝑗𝑗 in other words 𝑣𝑣𝑗𝑗 is within
the range of data transmission 𝑟𝑟 of a node 𝑣𝑣𝑖𝑖 The 3D location
𝑃𝑃𝑖𝑖𝑖𝑖 = (𝑋𝑋𝑖𝑖𝑖𝑖,𝑌𝑌𝑖𝑖𝑖𝑖,𝑍𝑍𝑖𝑖𝑖𝑖)∈ ℜ3 is considered the location of
vehicle 𝑣𝑣𝑖𝑖 by utilizing a localization network and 𝐿𝐿𝑖𝑖𝑖𝑖 =
(𝑋𝑋𝑖𝑖𝑖𝑖,𝑌𝑌𝑖𝑖𝑖𝑖,𝑍𝑍𝑖𝑖𝑖𝑖) is the genuine location of a vehicle 𝑣𝑣𝑖𝑖 at a
discrete time t and its transposition.
(a)
(b)
FIGURE 3. Discrimination deviator (a) block diagram (b) schematic diagram
B. FREQUENCY DISCRIMINATING DEVIATION AVOIDANCE USING FOSTER RATIONALIZER
In discriminating deviation avoidance, a foster rationalizer has been applied to examine frequency discriminated signal from one vehicle to another. It resulted in a signal strength change due to the jamming or external attacks in vehicular environments. The foster rationalizer or the phase-shift discriminator uses conversion of Double-tuned RF transformer to frequency variations in the received signal to amplitude changes. These amplitude fluctuations were then rectified and filtered for providing a direct current yield voltage. This voltage shifts in both amplitude and extremity as the information signal differs in frequency. The voltage yield is to be 0 when the info frequency is equivalent to the
bearer frequency (fr) furthermore, when the information
frequency transcends the inside frequency, the yield increments the positive way. While the info frequency dips under the middle frequency, the yield increments the negative way. Thus is shown in the foster rationalizer discriminator block diagram and its schematic diagram is shown in Fig. 3(a) and 3(b).
It quantifies the energy got amid a limited time interim and contrasts with the threshold. They got signal is pre-sifted with a perfect band pass channel with transmission capacity W, and the yield of the channel is communicated as a quadratic structure and is coordinated over an interim of time T, later the
factual test Λ is connected and the examination is performed.
It is expected that the signal to distinguish does not have a known structure that could be investigated already, and the model can be thoroughly considered like a round symmetric
Gaussian complex variable 𝑦𝑦 with mean zero
˄ (𝑦𝑦) =‖𝑦𝑦‖𝜎𝜎22= ∑𝑁𝑁𝑁𝑁𝑖𝑖=1|𝑦𝑦𝑖𝑖|2
𝜎𝜎2 > 𝜂𝜂 (1)
Where, 𝜎𝜎2 is the variance of the signal frequency. The
composite signal 𝑦𝑦𝑖𝑖 can be divided into 𝑁𝑁𝐿𝐿 number of signal
frequencies with zero mean, and 𝜂𝜂 is the threshold value if
signal. Using this condition, the energy of the obtained signal is compared with the threshold; and the frequency discriminative term is expressed as
𝑃𝑃𝐷𝐷= 1− 𝐹𝐹𝑥𝑥22𝑁𝑁𝑁𝑁 �
𝐹𝐹𝑥𝑥22𝑁𝑁𝑁𝑁(1−𝑃𝑃𝐹𝐹𝐴𝐴)
1+𝛾𝛾2𝜎𝜎2 � (2)
Where 𝐹𝐹𝑥𝑥22𝑁𝑁𝑁𝑁 is the analytical round symmetric Gaussian
function, 𝑃𝑃𝐹𝐹 is the energy of discriminative signal, and A is
the amplitude value of the signal. The previous explanation for some models with probability density functions when two speculations are consummately known, the recognition of the energy will be close to the ideal indicator, for instance, the execution of the energy finder with a SNR low is asymptotically proportional to the ideal vector when the signal is regulated with a limited signal of mean zero. In the event that the clamor difference is obscure, the energy locator can't be utilized in light of the fact that it is required
to set the threshold of commotion variance (σ2). In the event that the assessed estimation of σ2 is wrong, at that point the
identifier will have a poor act and should be assessed factor.
The discriminated signal 𝑃𝑃𝐷𝐷and original signal 𝑃𝑃𝐹𝐹𝐴𝐴 can be
[image:4.576.41.282.494.717.2]𝑃𝑃𝐷𝐷=𝑄𝑄 �𝛾𝛾−(𝑃𝑃+𝜎𝜎𝑛𝑛 2)
�𝑁𝑁2 (𝑃𝑃+𝜎𝜎𝑛𝑛2)
� (3)
𝑃𝑃𝐹𝐹𝐴𝐴=𝑄𝑄 �𝛾𝛾−𝜎𝜎𝑛𝑛 2
�𝑁𝑁2𝜎𝜎𝑛𝑛2
� (4)
Thus the signal has been sensed for fluctuations in terms of frequency and the efficacy and sensitivity of recognition quickly reduce with increasing in average variation of noise power and becomes poorest in small SNR, so it has to be eradicated for it proceeds to the exclusion by means of tactic filtration which in turn evolves accurate parameter for positioning vehicle for communication.
C. FREQUENCY DISCRIMINATIVE DEVIATION EXCLUSION USING MORSEL SUPPLE FILTER
In this section, frequency discriminated signal that has been detected by foster rationalizer is passed into the Morsel supply filter to remove the all possible frequency changes for identifying the location of the jamming effect. The frequency discriminated signals from one vehicle to another are sensed for the possibilities of external attacks, which may restrict in the communication. Hence an ideal filter is utilized and the
discriminative term 𝑃𝑃𝐷𝐷 is fed into the filter. The filter
produces the complex Gaussian term 𝑇𝑇 as:
𝑇𝑇=∑ 𝑦𝑦𝑁𝑁 (𝑛𝑛) 𝑥𝑥𝑝𝑝 (𝑛𝑛)𝑃𝑃𝐷𝐷 (5)
Where 𝑛𝑛 is the number of signal frequencies. The
experiment statistics the complex Gaussian term is compared with a specific threshold for making resolution. In the
complex Gaussian term, the Gaussian random variable 𝑃𝑃𝑑𝑑
and the combine linear Gaussian random variable 𝑃𝑃𝑓𝑓 are
expressed as:
𝑃𝑃𝑑𝑑=𝑄𝑄 �𝜆𝜆−𝐸𝐸 �𝐸𝐸𝛿𝛿𝑤𝑤2
� (6)
𝑃𝑃𝑓𝑓 =𝑄𝑄 � 𝜆𝜆
�𝐸𝐸𝛿𝛿𝑤𝑤2
� (7)
where E represents the energy of the original signal. The
variance of energy due to noise is represented by 𝛿𝛿𝑤𝑤2.
Sensing threshold 𝜆𝜆 is specified as a function of the signal
energy and noise variance which can expressed as: 𝜆𝜆= 𝑄𝑄−1�𝑃𝑃
𝑓𝑓��𝐸𝐸𝛿𝛿𝑤𝑤2 (8)
A hybrid matched filter structure depend upon conventional matched filter is made by integrating the parallel coordinated filter and the segmented matched filter in order to overwhelm the frequency offset sensitivity. The configuration balances the sensing time and hardware complexity. Techniques based on robust sensing are proposed when both the techniques over carrier frequency offset (CFC) and the phase noise (NP) demeans the detecting enactment of matched filter recognition. At the end of this process, the discriminative aspects in the signals are excluded or
removed. Thus the accurate and clear parameters are attained for localizing the vehicle for communication.
Conversely, the localization of estimated vehicle is determined without revealing its information based on the RSSI, TOA, TOD and Distance factor. Hence, there is a need of ordered prediction for getting knowledge about the positioning of location of vehicle for further communication.
D. LOCATION PREDICTION OF VEHICLE USING CATBOOST
For supporting better and ordered location prediction, a Cat Boost predictor is utilized in the proposed framework. The prediction is based on the decision tree relied algorithm. It has to use the prediction shift operation in the process. This prediction shifting process enables the prediction efficiency. Obviously, the esteems of Target Statistics (TS) to every instance relies upon the perceived past only. At that point to every instance, we utilize the entire obtainable history to
calculate TS, considering 𝐷𝐷𝑘𝑘 = �𝑋𝑋𝑗𝑗: 𝜎𝜎(𝑗𝑗) < 𝜎𝜎(𝑘𝑘)� to a
training instance as well as 𝐷𝐷𝑘𝑘 =𝐷𝐷 to a testing instance. The
attained systematic TS satisfy the requisite P1 and allow using entire training information as a training prototype (P2). Remind this, on the off chance that just a single random permutation is used, at that point going before precedents have TS with a lot higher fluctuation than resulting ones. So as to end this, CatBoost utilizes distinctive stages for various strides of slope boosting. In order to tackle the above prediction shifting, a boosting algorithm that does not experience the ill effects of prediction shift is portrayed below.
In every stage of boosting, a fresh dataset𝐷𝐷𝑖𝑖 is sampled
individually to attain unmoved remnants through smearing the present prototype to fresh training examples. Consider that we study a proto type using I trees. For making the remnant 𝑟𝑟𝐼𝐼−1(𝑥𝑥
𝑘𝑘,𝑦𝑦𝑘𝑘) unmoved, it is essential to has 𝐹𝐹𝐼𝐼−1 skilled
without instance 𝑥𝑥𝑘𝑘. As we require unbiased remnants to train
overall instances, no instance can be utilized to train 𝐹𝐹𝐼𝐼−1 that
initially creates the procedure of training difficult. Still, this becomes conceivable to preserve a group of prototypes conflicting through instances utilized to train them. Afterwards, to evaluate the eminent upon an instance, this method utilize a prototype, which is trained without the use of this. Hence, for fabricating a group of prototypes like that, we may utilize the principle of ordering formerly smeared to TS. For illustrating this concept, consider that we proceed single random permutation to the training instances and preserve n
diverse backup proto types 𝑀𝑀1… … …𝑀𝑀𝑁𝑁 likewise the
prototype 𝑀𝑀𝑖𝑖 is educated utilizing just the initial i instances of
the permutation. In every stage, for attaining the remanent of
jth example, this method utilizes the prototype 𝑀𝑀𝑗𝑗−1.
Inappropriately, this calculation isn't possible in most
commonsense errands with the demand of preparing n
distinctive prototypes, what increment the unpredictability
and memory necessities by n times.
In order to cope with the complexity and memory requirement of prediction process the Catboost has structured out by ordered boosting. Here the ordered cat boost prediction is done by performing random permutations
method 𝜎𝜎𝑐𝑐𝑐𝑐𝑖𝑖 and 𝜎𝜎𝑏𝑏𝑜𝑜𝑜𝑜𝑜𝑜𝑖𝑖 based over the trained instances of
TS evaluation and for ordered boosting, correspondingly. Incorporating these procedures in a single process, we must
consider 𝜎𝜎𝑐𝑐𝑐𝑐𝑖𝑖=𝜎𝜎𝑏𝑏𝑜𝑜𝑜𝑜𝑜𝑜𝑖𝑖 for preventing prediction shift. It
ensures the destination 𝑦𝑦𝑖𝑖 isn’t utilized to train 𝑀𝑀𝑖𝑖 (either
used for the TS calculation, or towards the slope evaluation). Experiential outcomes authorizing the significance of having 𝜎𝜎𝑐𝑐𝑐𝑐𝑖𝑖=𝜎𝜎𝑏𝑏𝑜𝑜𝑜𝑜𝑜𝑜𝑖𝑖 have been displayed in section IV, the algorithm for ordered boosting is being mentioned in algorithm 1, Initially, for the training dataset CatBoost
produces 𝑒𝑒+ 1 nondependent random permutations. The
permutations 𝜎𝜎1, … … .𝜎𝜎𝑜𝑜 have utilized to evaluate the
ruptures which describe tree organizations (i.e., the interior
nodules), whereas 𝜎𝜎0, assists to choose the leaf esteems 𝑏𝑏𝑗𝑗 of
the attained trees. For instance shaving little past over a specified permutation, both TS and predictions utilized
through ordered boosting (𝑀𝑀𝑤𝑤(𝑖𝑖)−1(𝑥𝑥𝑖𝑖)_𝑖𝑖𝑛𝑛_𝐴𝐴𝐴𝐴𝐴𝐴𝐴𝐴𝑟𝑟𝑖𝑖𝐴𝐴ℎ𝑚𝑚) had
a great variance. Hence, utilizing a single permutation increases the variance of the last prototype predictions; even though numerous permutations enable us to diminish the
impact.
Algorithm 1: Ordered Boosting 𝒊𝒊𝒊𝒊𝒊𝒊𝒊𝒊𝒊𝒊 ∶{(𝑥𝑥𝑘𝑘,𝑦𝑦𝑘𝑘 )}𝑘𝑘=1𝑛𝑛 ,𝐼𝐼; Process:
𝜎𝜎 ← 𝑟𝑟𝑟𝑟𝑛𝑛𝑟𝑟𝐴𝐴𝑚𝑚_𝑝𝑝𝑒𝑒𝑟𝑟𝑚𝑚𝑝𝑝𝐴𝐴𝑟𝑟𝐴𝐴𝑖𝑖𝐴𝐴𝑛𝑛_𝐴𝐴𝑖𝑖 [1,𝑛𝑛];
𝑀𝑀𝑖𝑖←0
𝒇𝒇𝒇𝒇𝒇𝒇𝑖𝑖= 1 𝐴𝐴𝐴𝐴𝑛𝑛𝒅𝒅𝒇𝒇 𝒇𝒇𝒇𝒇𝒇𝒇𝐴𝐴= 1 𝐴𝐴𝐴𝐴𝐼𝐼𝑟𝑟𝐴𝐴
𝑟𝑟𝑖𝑖← 𝑦𝑦𝑖𝑖− 𝑀𝑀𝜎𝜎(𝑖𝑖)−1(𝑥𝑥𝑖𝑖); 𝒇𝒇𝒇𝒇𝒇𝒇𝑖𝑖= 1 𝐴𝐴𝐴𝐴𝑛𝑛𝒅𝒅𝒇𝒇
∆𝑀𝑀 ← 𝐿𝐿𝑒𝑒𝑟𝑟𝑟𝑟𝑛𝑛𝑀𝑀𝐴𝐴𝑟𝑟𝑒𝑒𝐴𝐴 ��𝑥𝑥𝑗𝑗 ,𝑟𝑟𝑗𝑗�: 𝜎𝜎(𝑗𝑗)≤ 𝑖𝑖); 𝑀𝑀𝑖𝑖← 𝑀𝑀𝑖𝑖+∆𝑀𝑀 ;
𝒇𝒇𝒓𝒓𝒊𝒊𝒊𝒊𝒇𝒇𝒊𝒊𝑀𝑀𝑛𝑛
In CatBoost, base predictors are oblivious decision trees or otherwise termed as decision tables. The word oblivious specifies that the similar piercing standard is utilized through the whole level of the tree. Such trees are stable, slightly susceptible to over fitting, and permit speedy implementation at testing time considerably. so within the Ordered boosting mode, during the learning procedure, we preserve the backup
prototypes �𝑀𝑀𝑟𝑟,𝑗𝑗� in which 𝑀𝑀𝑟𝑟,𝑗𝑗(𝑖𝑖) is the present prediction
for the 𝑖𝑖𝑖𝑖ℎ instanced expend upon the initial j instances in the
permutation In every reiteration t of the procedure, we
mockup a random permutation 𝜎𝜎𝑟𝑟 from {𝜎𝜎1, … … … . . ,𝜎𝜎𝑛𝑛} and
build a tree 𝑇𝑇𝑖𝑖 based on it. Initially, for definite features, entire
TS are calculated conferring to this permutation. Then, the permutation disturbs the tree learning technique.
Specifically, depend upon 𝑀𝑀𝑟𝑟,𝑗𝑗(𝑖𝑖) we calculate the
equivalent slopes 𝐴𝐴𝑟𝑟𝑟𝑟𝑟𝑟𝑟𝑟,𝑗𝑗(𝑖𝑖) =𝜕𝜕𝑁𝑁(𝜕𝜕𝑛𝑛𝑦𝑦𝑖𝑖,𝑛𝑛)⎸𝑛𝑛=𝑀𝑀𝑟𝑟,𝑗𝑗(𝑖𝑖) At that
point, when assembling a tree, we estimated the slope G in
terms of the cosine resemblance 𝑟𝑟𝐴𝐴𝑒𝑒(. , . ) in which, for each
and every example i, the gradient 𝐴𝐴𝑟𝑟𝑟𝑟𝑟𝑟𝑟𝑟,𝜎𝜎(𝑖𝑖)−1(𝑖𝑖) is being
taken.. As the entrant ruptures appraisal stage, the leaf esteem
∆(𝑖𝑖) for instance i is acquired separately by averaging the
slopes 𝐴𝐴𝑟𝑟𝑟𝑟𝑟𝑟𝑟𝑟,𝜎𝜎(𝑖𝑖)−1(𝑖𝑖) of the preceding instances p laying in
the similar leaf 𝐴𝐴𝑒𝑒𝑟𝑟𝑖𝑖𝑟𝑟(𝑖𝑖) the instance i fits to. Remind this
𝐴𝐴𝑒𝑒𝑟𝑟𝑖𝑖𝑟𝑟(𝑖𝑖) based on the selected permutation 𝜎𝜎𝑟𝑟 , since 𝜎𝜎𝑟𝑟
affects the esteems of well-ordered TS for instance i. While
the tree arrangement 𝑇𝑇𝑖𝑖 (i.e., the series of excruciating
features) is constructed, we utilize it for boosting the entire
prototypes 𝑀𝑀𝑟𝑟1.𝑗𝑗 Let us stress that unique communal tree
arrangement 𝑇𝑇𝑖𝑖 is utilized to entire prototypes, however this
tree is summed with diverse 𝑀𝑀𝑟𝑟1.𝑗𝑗 with diverse groups of leaf
esteems based on 𝑟𝑟1 and also on 𝑗𝑗 , as defined in Algorithm 2.
The Plain boosting mode functions like a typical GBDT process, however, only if definite features are existing, this
preserves backup prototypes 𝑀𝑀𝑟𝑟 equivalent to TS depend
upon {𝜎𝜎1, … … … . . ,𝜎𝜎𝑛𝑛} The Algorithm for Building tree is
given below in algorithm 2.
Algorithm 2: Building decision tree 𝒊𝒊𝒊𝒊𝒊𝒊𝒊𝒊𝒊𝒊:𝑀𝑀, {(𝑥𝑥𝑖𝑖,𝑦𝑦𝑖𝑖)}𝑛𝑛𝑖𝑖=1,𝛼𝛼,𝐿𝐿, {𝜎𝜎𝑖𝑖}𝑖𝑖−1𝛽𝛽 𝑀𝑀𝑀𝑀𝐷𝐷𝐸𝐸 Process:
𝐴𝐴𝑟𝑟𝑟𝑟𝑛𝑛𝑟𝑟 ← 𝐶𝐶𝑟𝑟𝐴𝐴𝑟𝑟𝐺𝐺𝑟𝑟𝑟𝑟𝑟𝑟𝑖𝑖𝑟𝑟𝑛𝑛𝐴𝐴(𝐿𝐿,𝑀𝑀,𝑦𝑦); 𝑟𝑟 ← 𝑟𝑟𝑟𝑟𝑛𝑛𝑟𝑟𝐴𝐴𝑚𝑚(1,𝑒𝑒);
𝒊𝒊𝒇𝒇𝑀𝑀𝑀𝑀𝐷𝐷𝐸𝐸=𝑃𝑃𝐴𝐴𝑟𝑟𝑖𝑖𝑛𝑛 𝒊𝒊𝒕𝒕𝒓𝒓𝒊𝒊 𝐺𝐺 ← �𝐴𝐴𝑟𝑟𝑟𝑟𝑛𝑛𝑟𝑟𝑟𝑟,𝜎𝜎
𝑟𝑟(𝑖𝑖)−1(𝑖𝑖)𝑖𝑖𝐴𝐴𝑟𝑟𝑖𝑖= 1 … . .𝑛𝑛�; 𝑇𝑇 ← 𝑒𝑒𝑚𝑚𝑝𝑝𝐴𝐴𝑦𝑦_𝐴𝐴𝑟𝑟𝑒𝑒𝑒𝑒;
𝒇𝒇𝒇𝒇𝒇𝒇𝑒𝑒𝑟𝑟𝑟𝑟ℎ𝑒𝑒𝐴𝐴𝑒𝑒𝑝𝑝𝐴𝐴𝑖𝑖𝐴𝐴𝐴𝐴𝑝𝑝𝑟𝑟𝐴𝐴𝑑𝑑𝑛𝑛𝑝𝑝𝑟𝑟𝐴𝐴𝑟𝑟𝑒𝑒𝑟𝑟𝑝𝑝𝑟𝑟𝑒𝑒𝒅𝒅𝒇𝒇 𝒇𝒇𝒇𝒇𝒇𝒇𝑒𝑒𝑟𝑟𝑟𝑟ℎ𝑟𝑟𝑟𝑟𝑛𝑛𝑟𝑟𝑖𝑖𝑟𝑟𝑟𝑟𝐴𝐴𝑒𝑒𝑒𝑒𝑝𝑝𝐴𝐴𝑖𝑖𝐴𝐴𝑟𝑟𝒅𝒅𝒇𝒇;
𝑇𝑇𝑐𝑐 ← 𝑟𝑟𝑟𝑟𝑟𝑟_𝑒𝑒𝑝𝑝𝐴𝐴𝑖𝑖𝐴𝐴_𝑟𝑟_𝐴𝐴𝐴𝐴_𝑇𝑇;
𝒊𝒊𝒇𝒇𝑀𝑀𝐴𝐴𝑟𝑟𝑒𝑒=𝑃𝑃𝐴𝐴𝑟𝑟𝑖𝑖𝑛𝑛𝒊𝒊𝒕𝒕𝒓𝒓𝒊𝒊∆(𝑖𝑖)← 𝑟𝑟𝑣𝑣𝐴𝐴(𝐴𝐴𝑟𝑟𝑟𝑟𝑟𝑟𝑟𝑟, (𝑝𝑝)) 𝒇𝒇𝒇𝒇𝒇𝒇𝑝𝑝 ∶ 𝐴𝐴𝑒𝑒𝑟𝑟𝑖𝑖𝑟𝑟(𝑝𝑝) =𝐴𝐴𝑒𝑒𝑟𝑟𝑖𝑖𝑟𝑟(𝑖𝑖) 𝒅𝒅𝒇𝒇
𝒇𝒇𝒇𝒇𝒇𝒇𝑖𝑖= 1 𝐴𝐴𝐴𝐴𝑛𝑛do
𝒊𝒊𝒇𝒇𝑀𝑀𝐴𝐴𝑟𝑟𝑒𝑒=𝑀𝑀𝑟𝑟𝑟𝑟𝑒𝑒𝑟𝑟𝑒𝑒𝑟𝑟𝒊𝒊𝒕𝒕𝒓𝒓𝒊𝒊 ∆(𝑖𝑖)← 𝑟𝑟𝑣𝑣𝐴𝐴�𝐴𝐴𝑟𝑟𝑟𝑟𝑟𝑟𝑟𝑟,𝜎𝜎
𝑟𝑟(𝑖𝑖)−1(𝑝𝑝) � 𝒇𝒇𝒇𝒇𝒇𝒇𝑝𝑝 ∶ 𝐴𝐴𝑒𝑒𝑟𝑟𝑖𝑖𝑟𝑟(𝑝𝑝) =𝐴𝐴𝑒𝑒𝑟𝑟𝑖𝑖𝑟𝑟(𝑖𝑖) 𝒅𝒅𝒇𝒇
𝜎𝜎𝑟𝑟(𝑝𝑝) <𝜎𝜎𝑟𝑟(𝑖𝑖) 𝒇𝒇𝒇𝒇𝒇𝒇𝑖𝑖= 1 𝐴𝐴𝐴𝐴𝑛𝑛𝒅𝒅𝒇𝒇
𝐴𝐴𝐴𝐴𝑒𝑒𝑒𝑒(𝑇𝑇𝑐𝑐)←cos(∆,𝐺𝐺) 𝑇𝑇 ← 𝑟𝑟𝑟𝑟𝐴𝐴𝑚𝑚𝑖𝑖𝑛𝑛𝑇𝑇𝑐𝑐�𝐴𝐴𝐴𝐴𝑒𝑒𝑒𝑒(𝑇𝑇𝑐𝑐)�
if Mode=Plain then
𝑀𝑀𝑟𝑟1(𝑖𝑖)← 𝑀𝑀𝑟𝑟1(𝑖𝑖)− 𝛼𝛼𝑟𝑟𝑣𝑣𝐴𝐴(𝐴𝐴𝑟𝑟𝑟𝑟𝑟𝑟𝑟𝑟1(𝑝𝑝) ) 𝒇𝒇𝒇𝒇𝒇𝒇𝑝𝑝: 𝐴𝐴𝑒𝑒𝑟𝑟𝑖𝑖𝑟𝑟1(𝑝𝑝)
=𝐴𝐴𝑒𝑒𝑟𝑟𝑖𝑖𝑟𝑟1(𝑖𝑖)𝒅𝒅𝒇𝒇
𝒇𝒇𝒇𝒇𝒇𝒇𝑟𝑟= 1 𝐴𝐴𝐴𝐴𝑒𝑒,𝑖𝑖= 1 𝐴𝐴𝐴𝐴𝑛𝑛𝒅𝒅𝒇𝒇 𝒊𝒊𝒇𝒇𝑀𝑀𝐴𝐴𝑟𝑟𝑒𝑒=𝑀𝑀𝑟𝑟𝑟𝑟𝑒𝑒𝑟𝑟𝑒𝑒𝑟𝑟𝒊𝒊𝒕𝒕𝒓𝒓𝒊𝒊
𝑀𝑀𝑟𝑟1𝑗𝑗(𝑖𝑖)← 𝑀𝑀𝑟𝑟1𝑗𝑗(𝑖𝑖)− 𝛼𝛼𝑟𝑟𝑣𝑣𝐴𝐴�𝐴𝐴𝑟𝑟𝑟𝑟𝑟𝑟𝑟𝑟1.𝑗𝑗(𝑝𝑝) �
𝒇𝒇𝒇𝒇𝒇𝒇𝑝𝑝: 𝐴𝐴𝑒𝑒𝑟𝑟𝑖𝑖𝑟𝑟1(𝑝𝑝) =𝐴𝐴𝑒𝑒𝑟𝑟𝑖𝑖𝑟𝑟1(𝑖𝑖) 𝒅𝒅𝒇𝒇 𝜎𝜎𝑟𝑟1(𝑝𝑝)≤ 𝑗𝑗
𝒇𝒇𝒇𝒇𝒇𝒇_𝑟𝑟1= 1 … .𝑒𝑒,𝑖𝑖= 1 … .𝑛𝑛𝒅𝒅𝒇𝒇 𝑗𝑗 ≥ 𝜎𝜎𝑟𝑟1(𝑖𝑖)−1;
Assume every one of the trees developed the leaf estimations of the last model stated as F are being determined by the standard slope boosting methodology similarly for the two modes. Preparing precedents i which are coordinated to
leaves 𝐴𝐴𝑒𝑒𝑟𝑟𝑖𝑖0𝑟𝑟(𝑖𝑖) i.e., we use permutation 𝜎𝜎0 to ascertain TS
here. At the point when the last model F is connected to another precedent at testing time, utilize TS evaluated upon overall training information. At last, of the extensive leaf value matching process the position of vehicle based on the training parameters such as Received Signal Strength Intensity (RSSI), TOA (Time of Arrival), TOD (Time of Delay), and Distance factor is estimated.
Finally, the proposed methodology fulfills the objective for secure localization and routing in IOV through detection and discrimination of the external attack that deviates the parameter for sensing vehicle. Similarly, in addition to that the tactic prediction strategy is included in the need to aid efficient communication which can be able to extend the efficacy of the vehicular communication to the core. Experimental proceedings are narrated below in following section 4.
IV. SIMULATION RESULTS AND PERFORMANCE ANALYSIS
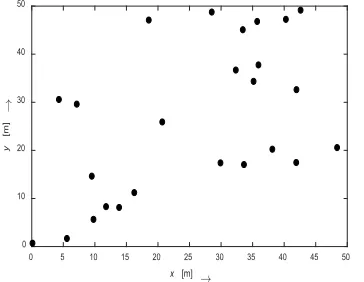
[image:7.576.310.489.99.259.2]In this section, we present a detailed description about the implementation and the performance evaluation of the proposed anti-jammer scheme for secure vehicular communication. It focuses on simulation settings, performance parameters, and analysis of simulation results. The proposed scheme is implemented using MATLAB/SIMULINK.
FIGURE 4. Vehicular Network Consideration
A. SIMULATION OUTPUTS
The importance of the projected IOV Communication metric under numerous conditions is emphasized by this implementation. Hence, a sequence of circumstances concerning the kind of metrics utilized as features in clustering, the quantity of clusters and the roaming speediness of the Rx–TX set under which the dimensions are gathered. To every circumstance, we perform a replication that lasts 300 sec and is similarly divide each 100 secs. The
outputs have been depicted below in fig. 3-9 on the area of
[image:7.576.314.512.395.562.2] [image:7.576.48.230.440.581.2]50 * 50 m2 which are given below,
FIGURE 5. Vehicular Network Communication
1) ENERGY DETECTOR
The input signal is initially fed into the Foster rationalizer energy detector which senses the changes in RSS and indicates the presence of external factors to the real signal. Similarly, our proposed input signal is fed into the energy detector which senses the energy changes intimates the external factor to the transmitting signal, which is given through the graphical representation by Fig. 6.
FIGURE 5. Energy Detection Plot
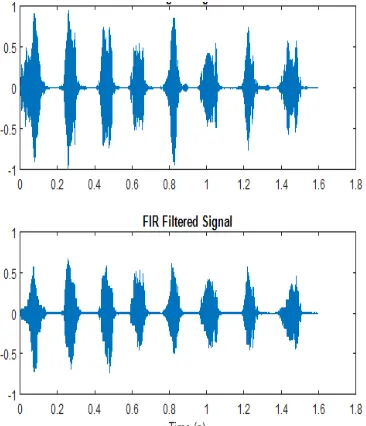
2) MORSEL SUPPLE FILTER RESULTS
Morsel supple filter utilizes an Anti-jamming technique in which the original signal distractions are sensed and those signals which are suffered with noise are tends to be filtered. Thus the noise content is removed from the signal, signals that still reveals any distraction will ensure the presence of external disturbance in the transmitted signal, which is then sensed to be due to the external attacks and is diagrammatically described by Fig 7. Fig. 8 shows original signal, noisy and filtered signals are depicted by green curve, plus sign and red curve respectively.
0 5 10 15 20 25 30 35 40 45 50
x [m] 5
10 15 20 25 30 35 40 45
y
[m]
0 0.1 0.2 0.3 0.4 0.5 0.6 0.7 0.8 0.9 1
Time
0.7 0.75 0.8 0.85 0.9 0.95 1
Signal
Energy of The Signal Real Signal
0 5 10 15 20 25 30 35 40 45 50
x [m]
0 10 20 30 40 50
y
FIGURE 7. Morsel Supple filter output
[image:8.576.316.520.64.229.2]FIGURE 8. Signal discriminator deviation
FIGURE 9. Vehicular Network establishing to next node
FIGURE 10. Prediction about location of vehicles
B. PERFORMANCE PARAMETER
The performance parameters that have been used in the performance evaluation in terms of both efficiency and prediction efficacy are defined.
Packet Loss Ratio (PLR):PLR is stated as the amount of no.
of packets failed to arrive the terminal to no. of packets sent from source which are given by
𝑃𝑃𝐿𝐿𝑃𝑃=(𝑛𝑛𝑛𝑛𝑛𝑛𝑛𝑛𝑖𝑖𝑃𝑃𝑐𝑐𝑐𝑐𝑘𝑘𝑛𝑛𝑖𝑖𝑜𝑜−𝑛𝑛𝑛𝑛𝑛𝑛𝑐𝑐𝑛𝑛𝑖𝑖𝑛𝑛𝑛𝑛𝑑𝑑𝑃𝑃𝑐𝑐𝑐𝑐𝑘𝑘𝑛𝑛𝑖𝑖𝑜𝑜𝑛𝑛𝑛𝑛𝑛𝑛𝑛𝑛𝑖𝑖𝑃𝑃𝑐𝑐𝑐𝑐𝑘𝑘𝑛𝑛𝑖𝑖𝑜𝑜 )
Packet Delivery Ratio (PDR): PDR is the percentage of ratio
towards the no. of packets received successfully by the terminal to no. of packets sent from source (PL*100) which is given by
𝑃𝑃𝐷𝐷𝑃𝑃=𝑛𝑛𝑛𝑛𝑛𝑛𝑐𝑐𝑛𝑛𝑖𝑖𝑛𝑛𝑛𝑛𝑑𝑑𝑃𝑃𝑐𝑐𝑐𝑐𝑘𝑘𝑛𝑛𝑖𝑖𝑜𝑜𝑛𝑛𝑛𝑛𝑛𝑛𝑛𝑛𝑖𝑖𝑃𝑃𝑐𝑐𝑐𝑐𝑘𝑘𝑛𝑛𝑖𝑖𝑜𝑜 ∗100
Signal conversion to noise ratio (SNR):SNR can be given by
the proportion of power of the signal to power of the noise in the signal.
𝑆𝑆𝑁𝑁𝑃𝑃= 10 log10�𝑃𝑃𝑃𝑃𝑠𝑠𝑖𝑖𝑠𝑠𝑛𝑛𝑠𝑠𝑠𝑠 𝑛𝑛𝑛𝑛𝑖𝑖𝑠𝑠𝑛𝑛�
Mean Squared Error (MSE): The MSE of an evaluation
quantifies the average of the squares of the mistakes that is the average squared difference among the appraised esteems and is appraised.
𝑀𝑀𝑆𝑆𝐸𝐸= 1
𝑛𝑛∑𝑛𝑛𝑖𝑖=1(𝑦𝑦𝑖𝑖− 𝑦𝑦𝑖𝑖)2 PSNR is define as ratio of signal power to MSE.
𝑃𝑃𝑆𝑆𝑁𝑁𝑃𝑃= 10 log10�𝑛𝑛𝑠𝑠𝑖𝑖𝑠𝑠𝑛𝑛𝑠𝑠𝑠𝑠𝑀𝑀𝑛𝑛𝐸𝐸 �
TABLE I PROPOSED PARAMETER VALUE
Parameter Value
Packet loss 0.1044
Packet Delivery Ratio 98.6626
Throughput 3.0054
Accuracy 97.236
SNR 0.9689
MSE 0.245
PSNR 3.3665
Throughput: It is demarcated as the data transferred
successfully to the endpoint node from the starting node.
0 10 20 30 40 50 60 70 80 90 100
0.7 0.8 0.9 1 1.1 1.2 1.3
Time
Original signal Noisy signal Filtered signal
0 5 10 15 20 25 30 35 40 45 50
x [m] 0
10 20 30 40 50
y
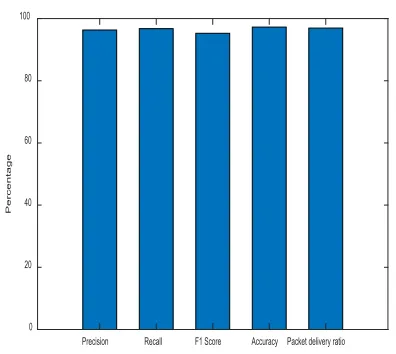
[image:8.576.71.241.475.653.2]Accuracy is the fraction of prediction of the model to get right. Accuracy is represented by the ratio of genuine outcomes amid the entire quantity of circumstances examined. We conducted the simulation of the proposed scheme and obtained the results of the performance parameters which is shown in Table-I and represented by Fig. 11.
FIGURE 11. Graphical representation of performance Parameters
C. PREDICTION PARAMETER
Precision: It is estimated as the proportion of True Negative
(TN) to negative value and is given as in, 𝑃𝑃𝑟𝑟𝑒𝑒𝑟𝑟𝑖𝑖𝑒𝑒𝑖𝑖𝐴𝐴𝑛𝑛=𝑇𝑇𝑃𝑃⁄(𝑇𝑇𝑃𝑃+𝐹𝐹𝑃𝑃)
Recall: It is represented by the proportion of properly
forecasted positive cases to overall cases in definite class. 𝑃𝑃𝑒𝑒𝑟𝑟𝑟𝑟𝐴𝐴𝐴𝐴=𝑇𝑇𝑃𝑃⁄(𝑇𝑇𝑃𝑃+𝐹𝐹𝑁𝑁)
F1 – Score : It is defined as the Recall and Precision overall
to the Harmonic Mean,
𝐹𝐹1− 𝑆𝑆𝑟𝑟𝑟𝑟𝐴𝐴𝑟𝑟𝑒𝑒= 2∗ 𝑃𝑃𝑟𝑟𝑒𝑒𝑟𝑟𝑖𝑖𝑒𝑒𝑖𝑖𝐴𝐴𝑛𝑛 ∗ 𝑃𝑃𝑒𝑒𝑟𝑟𝑟𝑟𝐴𝐴𝐴𝐴⁄(𝑃𝑃𝑟𝑟𝑒𝑒𝑟𝑟𝑖𝑖𝑒𝑒𝑖𝑖𝐴𝐴𝑛𝑛+𝑃𝑃𝑒𝑒𝑟𝑟𝑟𝑟𝐴𝐴𝐴𝐴)
Accuracy: It is the fraction of prediction of the model to get
right. In other words, it refers the ratio of the genuine outcomes amid the entire quantity of circumstances examined.
𝐴𝐴𝑟𝑟𝑟𝑟𝑝𝑝𝑟𝑟𝑟𝑟𝑟𝑟𝑦𝑦=𝑇𝑇𝑃𝑃+𝑇𝑇𝑁𝑁⁄(𝑇𝑇𝑃𝑃+𝐹𝐹𝑁𝑁+𝐹𝐹𝑃𝑃+𝑇𝑇𝑁𝑁)
We run the simulation of the proposed scheme and state of the art schemes, and received the results of the predictor parameters which is shown in Table-II and represented by Fig. 12.
FIGURE 12. Graphical representation of prediction parameters
TABLE II
COMPARISON OF PARAMETERS WITH EXISTING STRATEGIES
Classifier Precision
(%) Recall (%) F1 Score (%) Accuracy (%)
Proposed 96.32 96.75 95.26 97.256
XGBoost with K-Means Clustering
87.116 83.866 83.867 84.253
AdaBoost with K-Means Clustering
85.921 81.888 82.056 82.011
XGBoost 84.514 79.641 79.455 80.238
AdaBoost 83.012 80.543 80.217 80.731
D. PERFORMANCE COMPARISON
In Table II, our proposed Prediction location with estimation and avoidance of jamming effect misleading for prediction is tackled by means of combined process of foster seeley discriminator and morsel supple filter with Catboost predictor technique provides better outputs in terms of node density than the previous techniques. Here in this section the comparison is made with the existing methods are K-Means Clustering aligned with XGBoost, K-Means Clustering aligned with ADA BOOST, XGBoost, AdaBoost. Consequently, the graphical comparison each parameter such as Accuracy, Precision, Recall, F1 score are been plotted on the below figures such as Figure 13-16.
MSE Throughput SNR PSNR Packet loss
0 0.5 1 1.5 2 2.5 3 3.5
kb/sec
Precision Recall F1 Score Accuracy Packet delivery ratio
0 20 40 60 80 100
[image:9.576.56.254.156.330.2]FIGURE 13. Representation of Accuracy Graphically
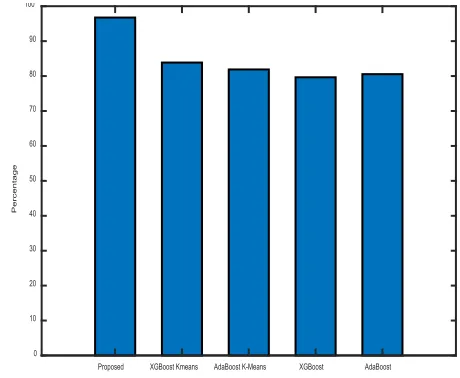
[image:10.576.312.542.147.336.2]Fig. 13 shows results obtained for accuracy of the proposed anti-jammer scheme with the existing methods K-Means Clustering aligned with XGBoost, K-Means Clustering aligned with ADA BOOST, XGBoost, and AdaBoost. It is seen that the accuracy of the proposed scheme is better that state of the art schemes. The accuracy of the proposed scheme is improved by 13%, 15%, 17%, and 17% as compared to XGBoost, K-Means Clustering aligned with ADA BOOST, XGBoost, AdaBoost respectively. The This due the fact that the proposed scheme employed Discrimination Deviator to elevate the effect of jammer vehicles.
FIGURE 14. Graphical representation of Precision
Fig. 14 shows results obtained for precision of the proposed anti-jammer scheme with the existing methods K-Means Clustering aligned with XGBoost, K-Means Clustering aligned with ADA BOOST, XGBoost, and AdaBoost. It is observed that the precision of the proposed scheme
outperforms state of the art schemes. The precision of the proposed scheme is improved by 9%, 11%, 12%, and 13% as compared to XGBoost, K-Means Clustering aligned with ADA BOOST, XGBoost, AdaBoost respectively. This due the fact that the proposed scheme employed Discrimination Deviator to remove the noise.
FIGURE 15. Graphical representation of Recall
[image:10.576.57.276.437.631.2]Fig. 15 shows results obtained for recall of the proposed anti-jammer scheme with the existing methods K-Means Clustering aligned with XGBoost, K-Means Clustering aligned with ADA BOOST, XGBoost, and AdaBoost. It is noticed that the recall of the proposed scheme is better that state of the art schemes. The recall of the proposed scheme is improved by 13%, 15%, 17%, and 16% as compared to XGBoost, K-Means Clustering aligned with ADA BOOST, XGBoost, AdaBoost respectively. This due the fact that the proposed scheme employed CatBoost predictor to find the location of jammer vehicles.
FIGURE 16. Graphical representation of F1 score Proposed XGBoost K-Means AdaBoost + GA Naive Bayes +N2B Random Forest
0 10 20 30 40 50 60 70 80 90 100
Percentage
Proposed XGBoost Kmeans AdaBoost K-Means XGBoost AdaBoost 0
10 20 30 40 50 60 70 80 90 100
Percentage
Proposed XGBoost Kmeans AdaBoost K-Means XGBoost AdaBoost 0
10 20 30 40 50 60 70 80 90 100
Percentage
Proposed XGBoost Kmeans AdaBoost K-Means XGBoost AdaBoost 0
10 20 30 40 50 60 70 80 90 100
[image:10.576.313.529.511.703.2]Fig. 16 shows results obtained for F1-scroe of the proposed anti-jammer scheme with the existing methods K-Means Clustering aligned with XGBoost, K-Means Clustering aligned with ADA BOOST, XGBoost, and AdaBoost. It is noticed that the F1-score of the proposed scheme is better that state-of-the-art schemes. The F1-score of the proposed scheme is improved by 12%, 13%, 16%, and 15% as compared to XGBoost, K-Means Clustering aligned with ADA BOOST, XGBoost, AdaBoost respectively. This due the fact that the proposed scheme employed Foster rationalizer and Morsel supple filter to avoid and exclude the discriminating signal generated from jamming/attacking vehicles in connected vehicle environments.
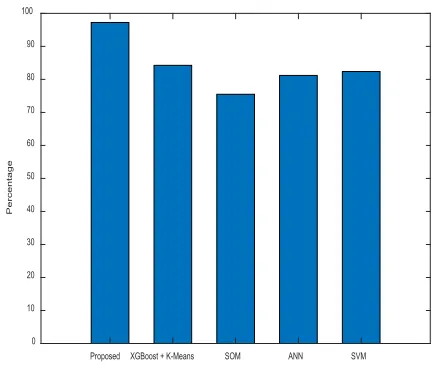
Thus by Fig. 17 and Table III, our proposed Prediction location with estimation and avoidance of jamming effect misleading for prediction is tackled by means of combined process of foster seeley discriminator and morsel supple filter with Catboost predictor technique provides better training accuracy than the previous techniques. Here in this section the comparison is made with the existing methods K-Means Clustering ALLIGNED WITH XGBoost with, SOM, SVM and ANN The training accuracy of the proposed scheme is improved by 13%, 22%, 16%, and 15% as compared to K-Means Clustering ALLIGNED WITH XGBoost with, SOM, SVM and ANN respectively.
TABLE III
COMPARISON OF OVERALL TRAINING ACCURACY WITH EXISTING
STRATEGIES
Classifier Accuracy (%)
Proposed 97.236
XGBoost with K-Means
Clustering 84.253
SOM 75.49
ANN 81.2
SVM 82.38
TABLE IV
COMPARISON OF PREDICTION ACCURACY WITH EXISTING STRATEGIES
Classifier Accuracy (%)
Proposed 99.91
XGBoost with K-Means
Clustering 99.85
AdaBoost +GA 99.57
Discriminative Multinomial
Naïve Bayes + N2B 96.5
Random Forest 91.5
FIGURE 17. Comparison of Training accuracy with existing strategies
[image:11.576.311.539.462.665.2]Thus by Fig. 18 and Table IV, our proposed Prediction location with estimation and avoidance of jamming effect misleading for prediction is tackled by means of combined process of foster seeley discriminator and morsel supple filter with Catboost predictor technique provides better prediction accuracy in terms of node density than the previous techniques. Here in this section the comparison is made with the existing methods XGBoost with K-Means Clustering, AdaBoost with GA, Discriminative Multinomial Naïve Bayes+N2B and Random Forest. The training accuracy of the proposed scheme is improved by 0.6%, 0.34%, 3.41%, and 8.41% as compared to XGBoost with K-Means Clustering, AdaBoost with GA, Discriminative Multinomial Naïve Bayes+N2B and Random Forest. respectively.
FIGURE 18. Comparison of prediction accuracy with existing strategies
Thus the above Tables III, and IV and fig. 17-18 reveals the simulation results of our proposed results. But while on
Proposed XGBoost + K-Means SOM ANN SVM
0 10 20 30 40 50 60 70 80 90 100
Percentage
Proposed XGBoost K-Means AdaBoost + GA Naive Bayes +N2B Random Forest 0
10 20 30 40 50 60 70 80 90 100
[image:11.576.43.284.537.628.2]comparing our proposed work with the existing methods, proposed work shows better results and performance by locating the vehicle, by get rid of jammer attacks for accurate results and from the attacking nodes for positioned communication by means of Delimited anti-jammer.
V. CONCLUSION
The proposed work thereby presents a peerless method using the Delimitated Anti jammer scheme to identify the location of vehicle by establishing a vehicle-to-vehicle communication. Thus, the anomalies such as external attacks and the noise in data are detected and removed by the combined function of foster rationalizer and Morsel Supple Filter respectively. From the experimental results, parameters such as Packet loss value gets reduced to 0.1044, while taking it into consideration the VANET communication achieves 99.91% of accuracy in localizing the vehicle without any interruption such as jamming effect or noise. Thus, the performance of VANETs increases with better accuracy, high throughput, greater packet of delivery ratio and reduced packet loss ratio.
REFERENCES
[1] D. Sheet, O. Kaiwartya, O., AH. Abdullah, Y. Cao, AN. Hassan, S. Kumar, “Location information verification using transferable belief model for geographic routing in vehicular ad hoc networks”, IET Intelligent Transport Systems, 11(2), pp.53-60, 2016.
[2] O. Kaiwartya, S. Kumar, “Cache agent-based geocasting in VANETs”, International Journal of Information and Communication Technology, 7(6), pp.562-584, 2015.
[3] M. Ruan, X. Chen, and H. Zhou, “Centrality Prediction Based on K-order Markov Chain in Mobile Social Networks”, Peer-to-Peer Networking and Applications, 99(1), 1-20, 2019. DOI: 10.1007/s12083-019-00746-y
[4] Y. Cao, O. Kaiwartya, R. Wang, T. Jiang, Y. Cao, N. Aslam, G. Sexton, “Toward Efficient, Scalable, and Coordinated On-the-Move EV Charging Management,” in IEEE Wireless Communications, vol. 24, no. 2, pp. 66-73, April 2017.
[5] T. Wang, Y. Cao, Y. Zhou, P. Li, “A survey on geographic routing protocols in delay/disruption tolerant networks”, International Journal of Distributed Sensor Networks, 12(2), p.3174670, 2016.
[6] O. Kaiwartya, S. Kumar, S., “Enhanced caching for geocast routing in vehicular Ad Hoc network”, In Proc. Intelligent computing, networking, and informatics, pp. 213-220, Springer, New Delhi, 2014. [7] G. Gui, H. Huang, Y. Song, and H. Sari, “Deep learning for an effective nonorthogonal multiple access scheme,” IEEE Transactions on Vehicular Technology, vol. 67, no. 9, pp. 8440-8450, Sept. 2018. [8] O. Kaiwartya, S. Kumar, “Guaranteed geocast routing protocol for
vehicular adhoc networks in highway traffic environment”, Wireless Personal Communications, 83(4), pp.2657-2682, 2015.
[9] Y. Wang, M. Liu, J. Yang, G. Gui, “Data-Driven Deep Learning for Automatic Modulation Recognition in Cognitive Radios,” IEEE Transactions on Vehicular Technology, 68(4), pp. 4074-4077, 2019. [10] Chung, Y., 2010. Development of an accident duration prediction
model on the Korean Freeway Systems. Accident Analysis & Prevention, 42(1), pp.282-289.
[11] O. Kaiwartya, Y. Cao, J. Lloret, S. Kumar, N. Aslam, R. Kharel, A. Abdullah, R. Shah, “Geometry-Based Localization for GPS Outage in Vehicular Cyber Physical Systems,” in IEEE Transactions on Vehicular Technology, 67(5), pp. 3800-3812, 2018.
[12] S. Kuutti, S. Fallah, K. Katsaros, M. Dianati, F. Mccull, A. Mouzakitis, “A Survey of the State-of-the-Art Localization Techniques and
Their Potentials for Autonomous Vehicle Applications,” IEEE Internet of Things Journal, 5(2), pp. 829-846, 2018.
[13] R. Kasana, S. Kumar, O. Kaiwartya, W. Yan, Y. Cao, and AH. Abdullah, “Location error resilient geographical routing for vehicular ad-hoc networks”, IET Intelligent Transport Systems, 11(8), pp.450-458, 2017.
[14] D. Sheet, O. Kaiwartya, AH. Abdullah, AN. Hassan, “Location information verification cum security using TBM in geocast routing”, Procedia Computer Science, 70, pp.219-225, 2015. [15] G. Soatti, M. Nicoli, N. Garcia, B. Denis, R. Raulefs and H.
Wymeersch, “Implicit Cooperative Positioning in Vehicular Networks,” in IEEE Transactions on Intelligent Transportation Systems, 19(12), pp. 3964-3980, 2018.
[16] Q. Chen, S. S. Kanhere, and M. Hassan, “Adaptive position update for geographic routing in mobile ad hoc networks,” IEEE Transactions on Mobile Computing, 12(3), pp. 489–501, 2013.
[17] Y. Cao, O. Kaiwartya, N. Aslam, C. Han, X. Zhang, Y. Zhuang, M. Dianati, “A Trajectory-Driven Opportunistic Routing Protocol for VCPS,” in IEEE Transactions on Aerospace and Electronic Systems, 54(6), pp. 2628-2642, 2018.
[18] L. Sun, Y. Wu, J. Xu and Y. Xu, “An RSU-assisted localization method in non-GPS highway traffic with dead reckoning and V2R communications,” in Proc. IEEE CECNet, pp. 149-152, 2012. [19] R. Zhang, F. Yan L. Shen and Yi Wu, “A Vehicle Positioning Method
Based on Joint TOA and DOA Estimation with V2R Communications,” in Proc. IEEE VTC2017-Spring, Jun. 2017. [20] S. Kim, D. Oh and J. Lee, “Joint DFT-ESPRIT Estimation for TOA and
DOA in Vehicle FMCW Radars,” IEEE Ant. and Wireless Propagation Letters, vol. 14, pp. 1710 –1713, Apr. 2015.
[21] J. Hong and T. Ohtsuki, “Signal Eigenvector-Based Device-Free Passive Localization Using Array Sensor,” in IEEE Transactions on Vehicular Technology, vol. 64, no. 4, pp. 1354-1363, 2015. [22] N. Alam, A. T. Balaei, and A. G. Dempster, “Relative positioning
enhancement in VANETs: a tight integration approach,” IEEE Transactions on Intelligent Transportation Systems, vol. 14, no. 1, pp. 47–55, 2013.
[23] H. Ghafoor and I. Koo, “CR-SDVN: A cognitive routing protocol for Software-Defined vehicular networks,” IEEE Sensors Journal, 18(4), pp.1761-1772, 2018.
[24] P. Asuquo, H. Cruickshank, J. Morley, CPA. Ogah, A. Lei, W. Hathal, S. Bao, Z. Sun, “Security and Privacy in Location-Based Services for Vehicular and Mobile Communications: An Overview, Challenges, and Countermeasures,” in IEEE Internet of Things Journal, vol. 5, no. 6, pp. 4778-4802, 2018.
[25] R. Kaur, T. P. Singh and V. Khajuria, "Security Issues in Vehicular Ad-Hoc Network(VANET)," 2018 2nd International Conference on Trends in Electronics and Informatics (ICOEI), Tirunelveli, pp. 884-889, 2018.
[26] S. Kuutti, S. Fallah, K. Katsaros, M. Dianati, F. Mccullough and A. Mouzakitis, “A Survey of the State-of-the-Art Localization Techniques and Their Potentials for Autonomous Vehicle Applications,” in IEEE Internet of Things Journal, vol. 5, no. 2, pp. 829-846, April 2018.
KARAN SINGH (M’07, SM’19) received the Engineering degree from the Kamla Nehru Institute of Technology, Sultanpur, India, and the M.Tech. and Ph.D. degrees from the Motilal Nehru National Institute of Technology, India, all in computer science and engineering. He was with Gautam Buddha University, India. He is currently with the School of Computer and Systems Sciences, Jawaharlal Nehru University, New Delhi. He has published over 70 research papers in refereed journals and good conferences. His primary research interests include computer networks, network security, multicast communication, the IoT, and body area networks. He is also an Editorial Board Member of the Journal of Communications and Networks (CN), USA. He was the General Chair of the International Conference (Qshine 2013) at Gautam Buddha University. He is a supervisor of many researcher scholars. He is also a Reviewer of Springer, Taylor & Francis, Elsevier journals, and IEEE Transactions. He organized the workshops, conference sessions, and trainings. Recently, he organized the ICCCS 2018 conference at the Dronacharya College of Engineering, Gurgaon, and a special session at the 2nd ICGCET 2018, Denmark.
SUSHIL KUMAR (M’11 SM’18) is currently working as Assistant Professor at School of Computer and Systems Sciences, Jawaharlal Nehru University, New Delhi, India. He received his Ph.D. degree in Computer Science from School of Computer and Systems Sciences, Jawaharlal Nehru University, New Delhi, India in 2014. His research interest includes the area of vehicular cyber physical systems, Internet of things and wireless sensor networks. He is supervised/supervising many doctoral theses in vehicular communication, energy efficiency of terrestrial sensor networks, and green and secure computing in Internet of Things. He has authored and coauthored over 70 technical papers in international journals and conferences. He served as session chair in many international conferences and workshops. He is a reviewer in many IEEE/IET and other reputed SCI journals.
OMPRAKASH KAIWARTYA (M’14) is currently working as a Lecturer at the School of Science & Technology, Nottingham Trent University (NTU), UK. Previously, He was a Research Associate at the Northumbria University, Newcastle, UK, in 2017 and a Postdoctoral Research Fellow at the Universiti Teknologi Malaysia (UTM) in 2016. He received his Ph.D. degree in Computer Science from Jawaharlal Nehru University, New Delhi, India, in 2015. His research interest focuses on IoT centric future technologies for diverse domain areas focusing on Transport, Healthcare, and Industrial Production. His recent scientific contributions are in Internet of connected Vehicles (IoV), Electronic Vehicles Charging Management (EV), Internet of Healthcare Things (IoHT), and Smart use case implementations of Sensor Networks. He is Associate Editor of reputed SCI Journals including IET Intelligent Transport Systems, EURASIP Journal on Wireless Communication and Networking, Ad-Hoc & Sensor Wireless Networks, and Transactions on Internet and Information Systems. He is also Guest Editor of many recent special issues in reputed journals including IEEE Internet of Things Journal, IEEE Access, MDPI Sensors, and MDPI Electronics.
YUE CAO[M'16] received the PhD degree from the Institute for Communication Systems (ICS), University of Surrey, UK in 2013. He was the Research Fellow at University of Surrey, UK; Lecturer and Senior Lecturer at Department of Computer and Information Sciences, Northumbria University, UK; and has been the International Lecturer at School of Computing and Communications, Lancaster University, UK. His research interests focus on Intelligent Transport Systems.