ISSN Online: 2168-5444 ISSN Print: 2168-5436
DOI: 10.4236/ijmpcero.2018.72019 May 28, 2018 214 Int. J. Medical Physics, Clinical Engineering and Radiation Oncology
Analytical Calculation of the Compton Single
Scatter Component of Pencil Beam Scatter
Kernel for Scatter Correction in kV
Cone Beam CT (kV-CBCT)
Jie Liu
1,2, J. Daniel Bourland
1,2,31Department of Radiation Oncology, Wake Forest School of Medicine, Winston-Salem, NC, USA 2Department of Physics, Wake Forest University, Winston-Salem, NC, USA
3Department of Biomedical Engineering, Wake Forest School of Medicine, Winston-Salem, NC, USA
Abstract
The accuracy of conventional superposition or convolution methods for scat-ter correction in kV-CBCT is usually compromised by the spatial variation of pencil-beam scatter kernel (PBSK) due to finite size, irregular external con-tour and heterogeneity of the imaged object. This study aims to propose an analytical method to quantify the Compton single scatter (CSS) component of the PBSK, which dominates the spatial distribution of total scatter assuming that multiple scatter can be estimated as a constant background and Rayleigh scatter is the secondary source of scatter. The CSS component of PBSK is the line integration of scatter production by incident primary photons along the beam line followed by the post-scattering attenuation as the scattered photons traverse the object. We propose to separate the object-specific attenuation term from the line integration and equivalently replace it with an average val-ue such that the line integration of scatter production is object independent but only beam specific. We derived a quartic function formula as an approx-imate solution to the spatial distribution of the unattenuated CSS component of PBSK. The “effective scattering center” is introduced to calculate the aver-age attenuation. The proposed analytical framework to calculate the CSS was evaluated using parameter settings of the On-Board Imager kV-CBCT system and was found to be in high agreement with the reference results. The pro-posed method shows highly increased computational efficiency compared to conventional analytical calculation methods based on point scattering model. It is also potentially useful for correcting the spatial variant PBSK in adaptive superposition method.
How to cite this paper: Liu, J. and Bour-land, J.D. (2018) Analytical Calculation of the Compton Single Scatter Component of Pencil Beam Scatter Kernel for Scatter Correction in kV Cone Beam CT (kV-CBCT). International Journal of Medical Physics, Clinical Engineering and Radiation Oncology, 7, 214-230.
https://doi.org/10.4236/ijmpcero.2018.72019
Received: April 21, 2018 Accepted: May 25, 2018 Published: May 28, 2018 Copyright © 2018 by authors and Scientific Research Publishing Inc. This work is licensed under the Creative Commons Attribution-NonCommercial International License (CC BY-NC 4.0).
http://creativecommons.org/licenses/by-nc/4.0/
DOI: 10.4236/ijmpcero.2018.72019 215 Int. J. Medical Physics, Clinical Engineering and Radiation Oncology
Keywords
Scatter Correction, Cone Beam CT, Beam Scatter Kernel, Compton Scatter, Single Scatter
1. Introduction
In kV cone beam CT, the 2D projection on the planar detector is contaminated by significantly increased scatter due to the large irradiated object volume com-pared to conventional CT modalities with fan-beam geometry. The increased scatter can be comparable to the primary X-ray transmission in magnitude and thus severely degrades image quality by introducing quantification errors and image artifacts [1] [2] [3].
The X-ray scatter consists of any secondary photons other than the incident primary photons and is mainly produced by direct photon interactions with medium, including Compton (incoherent) and Rayleigh (coherent) scattering. In Compton scattering, an incident photon transfers part of its energy to an outer shell atomic electron and is deflected from its incident direction. In Ray-leigh scattering, the incident photon only changes its direction with no energy transferred. Analytic formulas have been discovered to calculate the distribu-tion of the first-order Compton scatter using the Klein-Nishina formula and Rayleigh scatter using the Thomson formula [4]. Besides, the scattered photon may experience multiple successive interactions with medium before arriving at the detector, which is referred as multiple scatter. In kV-CBCT, the distri-bution of multiple scatter is generally smooth and can be approximately calcu-lated as a constant background [2] [5] [6] [7] [8]. As Compton scattering do-minates photon interactions in kV-CBCT, in general the spatial distribution of scatter is mainly determined by the Compton single scatter (CSS) component
[2] [6].
Many methods have been proposed and developed for determining the spatial distribution of scatter in CBCT including: measurements using beam-stopper-array
DOI: 10.4236/ijmpcero.2018.72019 216 Int. J. Medical Physics, Clinical Engineering and Radiation Oncology
In this study, we propose an analytical model to calculate the spatial distribu-tion dominant CSS component of the PBSK aiming to improve the computa-tional accuracy of the PBSK based superposition method for scatter correction. The CSS component of the PBSK can be analytically formulated as line integra-tion over the pencil-beam range. In the proposed method, the attenuaintegra-tion term is separated from the line integration and approximated by using an average at-tenuation path length and an effective atat-tenuation coefficient. For the line inte-gration of the unattenuated CSS, we derived a compact formula for easy imple-mentation (Section 2.1). We also introduced the effective scattering center on the PBSK beam line as the point source of the unattenuated CSS so that the av-erage attenuation could be efficiently calculated (Section 2.2). Exact calculations of the CSS of the PBSK with varying parameter settings and the integrated CSS from point scattering targets in a slab phantom were benchmarked to evaluate the performance of the proposed model (Section 2.3).
2. Methods and Materials
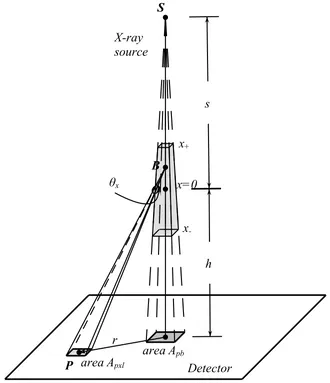
Figure 1 shows the schematic of calculating the scatter kernel from a pencil-beam. The distance from the X-ray source to the isocenter of the imaging system is s
and the height from isocenter to the detector plane is h. The range of the pen-cil-beam is from x− to x+ with the origin defined at the isocenter. The
pen-cil-beam has a finite size of cross section area Apb when projected at the detector
plane. Denoting dΦS
( )
x r, as the differential fluence of the CSS producedfrom a beam segment at x to point P with off-axis distance r on the detector plane, the spatial distribution of the CSS can be written as a line integration as Equation (1).
( )
x d( )
, e S( ) ( )x r, x r, S r x S x rµ
+ −
− ⋅
Φ =
∫
Φ ⋅ (1)
The attenuation path length
( )
x r, and attenuation coefficient µS( )
x r, of the scattered photons when traversing the object are dependent of the external contour and heterogeneity of the object, which makes the scatter kernel ob-ject-dependent and spatially variant.We assume that for a particular PBSK, the variations of the attenuation path length and attenuation coefficient of the CSS are smooth with respect to the beam segment x and the differential attenuation term can be equivalently re-placed by an average value that is independent of the integration variable x. Ma-thematically, the above line integration is approximately calculated using Equa-tion (2).
( )
( ) ( ), ,(
( )
)
( ) ( )d , e S d , e S
x x r x r x r r
S S
x x r x x r
µ µ
+ +
− −
− ⋅ − ⋅
Φ ⋅ ≈ Φ ⋅
∫
∫
DOI: 10.4236/ijmpcero.2018.72019 217 Int. J. Medical Physics, Clinical Engineering and Radiation Oncology
Figure 1. The schematic diagram for calculating the Compton single scatter (CSS)
com-ponent of the pencil-beam scatter kernel (PBSK). The scatter kernel represents the scatter distribution on the detector plane from the line integration of scatter production along the beam line (range (x−,x+) as shown in the diagram).
2.1. The Unattenuated CSS Component of PBSK
Considering the beam segment as a point target, the number of Compton pho-tons produced from segment B to pixel P, as shown in Figure 1, can be given by:
( )
( )
d( ) ( )
d , d d
d
S pri x e x
N x r = Φ x ⋅ σ θ λ⋅ x ⋅ x⋅ Ω
Ω
(3)
The parameter Φpri
( )
x is the fluence of incident primary photons at thesegment x, d
( )
dσ θΩ x is the Compton interaction cross section (given by the
Klein-Nishina formula [4]), λe
( )
x is the linear electron density and dΩx is the solid angle subtended by the pixel area (Apxl) with respect to segment B. Theyare given by the following equations.
( )
e (x x ) 2 pri x P µ − s hs x− +
Φ = Φ ⋅ ⋅
−
(4)
P
area A
pxlarea A
pbs
r
x=0
Detector
X-ray
source
h
θ
xx
-x
+DOI: 10.4236/ijmpcero.2018.72019 218 Int. J. Medical Physics, Clinical Engineering and Radiation Oncology
( )
2e x e Apb s xs h
λ
=ρ
⋅ ⋅ − +
(5)
( )
(
)
2 2cos
d pxl x
x
A
r h x
θ ⋅ Ω =
+ +
(6)
( )
02 2 2( )
d sin
d x 2 x
r h h h
h h h
σ
θ
ν
ν
ν
θ
ν
ν
ν
′ ′
= + −
′
Ω (7)
In above, ΦP is the projection fluence of the primary beam at the detector plane, µ is the linear attenuation coefficient of the primary photons, ρe is the
vo-lumetric electron density, r0 is the classic electron radius, hν and hv' are the
energies of incident and scattered photons, respectively. The relation between hν
and hv' is [4]:
( )
(
)
2 0
1
1 1 cos x
h h h m c ν ν ν θ ′ =
+ −
(8)
where 2 0
m c is the electron rest energy (~511 keV).
We define short denotations for the relative photon energy and the cosine of scattering angle as following:
( )
20
, cos x
h E p m c ν θ = =
(9) Substituting Equations (4)-(9) into Equation (3), the differential fluence of CSS can be given by Equation (10).
( )
( )
( )(
)
( )
2 0 2 2d , e
d , d
2
x x S
S e pb P
pxl
N x r r
x r A g p x
A r h x
µ
ρ −−
Φ = = ⋅ ⋅ ⋅ Φ ⋅ ⋅ ⋅
+ +
(10)
The term g(p) is a function of p and relative photon energy E, given by Equa-tion (11).
( )
1 2 3(
1)
1 1
p
g p p Ep p
E Ep E Ep
= + − +
+ − + −
(11)
We derived that under the conditions of E
(
1−p)
<1 and r 1h x+ < , the
in-tegration of dΦS
( )
x r, as in Equation (10) over x∈(
x x−, +)
can beapprox-imated to be a compact form (Equation (12)) as a quartic function of off-axis distance r (see the details in the Appendix).
( )
( )
02(
2 4)
0 2 4
d ,
2
x
S r x S x r r ρe Apb P C C r C r
+
−
Φ = Φ ≈ ⋅ ⋅ ⋅ Φ ⋅ − ⋅ + ⋅
∫
(12)The coefficients Ck (k = 0, 2, 4) are independent of off-axis distance r and
given by the following:
( )
(
)
(
)
( )(
)
0 2 2 4 e 2 d e2 2 d
x x x x x x x x C x h x
C E x
DOI: 10.4236/ijmpcero.2018.72019 219 Int. J. Medical Physics, Clinical Engineering and Radiation Oncology
( )
(
)
2
4 6
7 11 25 e d
4 2 4
x x x x
C E E x
h x
µ −
+
−
−
= + + ⋅
∫
+ (13)Upon given incident photon energy and imaging system geometry, these coef-ficients are specified by the pencil-beam range and can be pre-calculated as a lookup table with varying pencil-beam lengths.
In the coordinate system of the detector plane, we define u as the calculating point of a detector pixel and u′ as the projection position of a pencil-beam. The general formula to calculate the unattenuated CSS at u contributed by pen-cil-beam at u′ is:
(
)
02( )
(
( )
( ) (
)
2( ) (
)
4)
0 2 4
,
2
S u u r ρe Apb P u C u C u u u C u u u
′ ′ ′ ′ ′ ′ ′
Φ = ⋅ ⋅ ⋅ Φ ⋅ − ⋅ − + ⋅ −
(14)
2.2. The Post-Scattering Attenuation of CSS
We assume the average post-scattering attenuation term (as in Equation (2)) can be equivalently calculated using the attenuation path length from a specific point on the beam line to the calculating point r and the corresponding attenuation coefficient determined by the scattering angle formed between them. We define this specific point as the “effective scattering center” of the integrated unatte-nuated CSS. The position of the effective scattering center on the beam line can be solved from Equation (15) as an approximate solution (see the details in the Appendix):
( )
( )
(
)
( )
(
)
( ) (
)
(
)
2 2 2
2 2
2
, e
d
e , with ,
, d
x x
x x r
x x
w x r
x
h x h x r
w x r
w x r x h x r
h x µ
µ
+
−
+
−
⋅
⋅
⋅
+ + −
= =
+ +
+
∫
∫
(15)Similar to the quartic formula coefficients Ck (k = 0, 2, 4) (Equation (13)), the
position of effective scattering center as a function of r can be pre-calculated as a lookup table with varying pencil-beam lengths for given incident photon energy and imaging system geometry.
2.3. Model Evaluation
DOI: 10.4236/ijmpcero.2018.72019 220 Int. J. Medical Physics, Clinical Engineering and Radiation Oncology
2.3.1. The Quartic Formula
The accuracy of using the quartic formula (Equation (12)) to approximate the exact line integration of the unattenuated CSS is dependent of three parameters including the primary photon energy (hν), the isocenter-to-detector height (h) and the size of the object (x−, x+). The profiles of the unattenuated CSS were
cal-culated and compared between the quartic formula solutions and the exact line integrations with varying hν (40 keV, 60 keV, 100 keV and 130 keV), h (40 cm, 50 cm, 60 cm and 70 cm) and (x−, x+) ((−5, 5) cm, (−10, 10) cm, (−15, 15) cm
and (−20, 20) cm).
2.3.2. The Effective Scattering Center
As the object external contour plays a major role in determining the post-scattering attenuation of the CSS, we select two representative types of ex-ternal contour—round and flat—for evaluating the performance of the effective scattering center method for calculating the average post-scattering attenuation. The profiles of CSS as a function of off-axis distance r along the radial and axial cross sections of a cylinder (corresponding to circular and flat contours, respec-tively) with three different sizes (10, 20 and 40 cm in diameter) are calculated using the exact differential attenuation term and the effective scattering center method, with comparisons made.
2.3.3. Phantom Experiment
A preliminary evaluation of applying the proposed model as an analytical solu-tion for the CSS distribusolu-tion from a volumetric object was performed on a slab water phantom (30 cm in thickness) with an incident cone beam X-rays (26 × 20 cm2 at the isocenter plane and ~40 × 30 cm2 at the detector plane). The primary
photon energy is 58keV, which is the mean energy of the 125 kVp X-ray tube voltage used in the Varian OBI system. The SAD is 100 cm and the isocenter-to-detector height is 50 cm.
The benchmarked CSS distribution was calculated by conventional analytical method using point scattering target, in which the irradiation volume is discre-tized as voxels and the CSS contribution from each voxel to each detector pixel is calculated analytically with exact implementation of the Klein-Nishina formula followed by exact calculation for the attenuation term [7].
The relative root-mean-square-error (RMSE) in the CSS distribution is used as the metric to assess the accuracy of the proposed model. The RMSE is calcu-lated using Equation (16), with model, ref
S S
Φ Φ the CSS distribution on the
detec-tor (pixel dimension is n ni× j) calculated by the proposed model and the ben-chmarked method, respectively.
( )
( )
( )
2
,
, ,
1
RMSE 100%
,
model ref
S S
ref i j
i j S
i j i j
n n i j
Φ − Φ
= ⋅ Φ ⋅
∑
(16)
DOI: 10.4236/ijmpcero.2018.72019 221 Int. J. Medical Physics, Clinical Engineering and Radiation Oncology
3. Results
3.1. Evaluation of the Quartic Formula
3.1.1. Dependence of Photon Energy
The profiles of CSS calculated by the quartic formula (Equation (12)) and the ex-act line integration for photon energies 40 keV, 60 keV, 100 keV and 130 keV are shown in Figure 2. The other parameter settings are s = 100 cm, h = 50 cm and (x−, x+) = (−10, 10) cm. The deviation of the quartic formula compared to the
ex-act line integration increases with the off-axis radius and slightly increases with photon energy. The maximum differences at r = 20 cm are +1.3%, +1.6%, +1.9% and +2.2% for hν =40 keV, 60 keV, 100 keV and 130 keV, respectively.
3.1.2. Dependence of Isocenter-to-Detector Height
Figure 3 shows the CSS profiles calculated by the quartic formula and the exact line integration for four different h values (40 cm, 50 cm, 60 cm and 70 cm), with the same primary photon energy 58 keV and beam range (−10, 10) cm. The devi-ation between the quartic formula and the exact line integrdevi-ation rapidly decreases with h. The maximum differences at r = 20 cm are +6.1%, +1.5%, +0.5% and +0.2% for h = 40 cm, 50 cm, 60 cm and 70 cm, respectively.
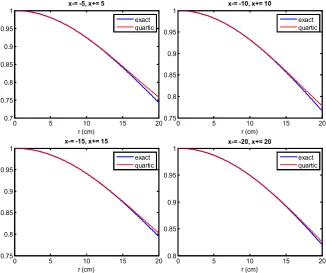
[image:8.595.210.538.408.681.2]3.1.3. Dependence of the Length of Pencil-Beam
Figure 4 shows the CSS profiles calculated by the quartic formula and the exact line integration for four different pencil-beam ranges (−5, 5) cm, (−10, 10) cm,
Figure 2. The profiles of the unattenuated CSS component of PBSK calculated by exact
line integration (solid) and the quartic formula (dashed) for incident primary photon energy at 40 keV, 60 keV, 100 keV and 130 keV, with h = 50 cm and beam length 20 cm.
0 5 10 15 20
0.75 0.8 0.85 0.9 0.95 1
r (cm)
40keV
exact quartic
0 5 10 15 20
0.75 0.8 0.85 0.9 0.95 1
r (cm)
60keV
exact quartic
0 5 10 15 20
0.75 0.8 0.85 0.9 0.95 1
r (cm)
100keV
exact quartic
0 5 10 15 20
0.75 0.8 0.85 0.9 0.95 1
r (cm)
130keV
DOI: 10.4236/ijmpcero.2018.72019 222 Int. J. Medical Physics, Clinical Engineering and Radiation Oncology
Figure 3. The profiles of the unattenuated CSS component of PBSK calculated by exact
line integration (solid) and the quartic formula (dashed) for h = 40 cm, 50 cm, 60 cm and 70 cm, with incident primary photon energy 58 keV and beam length 20 cm.
Figure 4. The profiles of the unattenuated CSS component of PBSK calculated by exact
line integration (solid) and the quartic formula (dashed) for pencil-beam ranges of (−5, 5) cm, (−10, 10) cm, (−15, 15) cm and (−20, 20) cm, with incident primary photon energy 58 keV and h = 50 cm.
0 5 10 15 20
0.65 0.7 0.75 0.8 0.85 0.9 0.95 1
r (cm)
h= 40cm
exact quartic
0 5 10 15 20
0.75 0.8 0.85 0.9 0.95 1
r (cm)
h= 50cm
exact quartic
0 5 10 15 20
0.8 0.85 0.9 0.95 1
r (cm)
h= 60cm
exact quartic
0 5 10 15 20
0.86 0.88 0.9 0.92 0.94 0.96 0.98 1
r (cm)
h= 70cm
exact quartic
0 5 10 15 20
0.7 0.75 0.8 0.85 0.9 0.95 1
r (cm)
x-= -5, x+= 5
exact quartic
0 5 10 15 20
0.75 0.8 0.85 0.9 0.95 1
r (cm)
x-= -10, x+= 10
exact quartic
0 5 10 15 20
0.75 0.8 0.85 0.9 0.95 1
r (cm)
x-= -15, x+= 15
exact quartic
0 5 10 15 20
0.8 0.85 0.9 0.95 1
r (cm)
x-= -20, x+= 20
[image:9.595.209.536.396.669.2]DOI: 10.4236/ijmpcero.2018.72019 223 Int. J. Medical Physics, Clinical Engineering and Radiation Oncology
(−15, 15) cm and (−20, 20) cm with the same hν = 58 keV and h = 50 cm. The ranges of pencil-beam correspond to nominal object diameters 10 cm, 20 cm, 30 cm and 40 cm, respectively. With larger pencil-beam range, the quartic formula increasingly matches the exact line integration. The maximum differences at r = 20 cm are +2.1%, +1.5%, +1.0% and +0.7% for beam length = 10 cm, 20 cm, 30 cm and 40 cm, respectively.
3.2. Evaluation of the Model of Effective Scattering Center
[image:10.595.142.538.374.679.2]The effective scattering center position on the pencil-beam as a function of off-axis distance was determined using Equation (15) for three different pen-cil-beam ranges (−5, 5) cm, (−10, 10) cm and (−20, 20) cm, with the correspond-ing cylinder radius (R) of 5 cm, 10 cm and 20 cm, respectively. Figure 5 shows the attenuated CSS profiles calculated using the exact attenuation term and the average attenuation based on the effective scattering center model. The primary photon energy is 58 keV and h = 50 cm. The differences are in the ranges of [−0.5%, 0.5%], [+0.9%, +1.6%] and [+1.5%, +9.3%] along the radial cross section and [−1.4%, +0.5%], [−5.0%, +0.9%], [−11.3%, +1.5%] along the axial cross sec-tion for cylinder radius of 5 cm, 10 cm and 20 cm, respectively. The deviasec-tion of using the effective scattering center for average attenuation increases with the cy-linder size.
Figure 5. The profiles of attenuated CSS component of PBSK along the radial and axial directions of long
cylinders with different radius of 5 cm, 10 cm and 20 cm, calculated by exact attenuation term (solid) and using the effective scattering center model (dashed).
0 5 10 15 20
2 2.5
3x 10
-3
r (cm)
R= 5cm, Radial
0 5 10 15 20
1.5 2 2.5
3x 10
-3
r (cm)
R= 5cm, Axial
0 5 10 15 20
1 1.5 2
2.5x 10
-3
r (cm)
R= 10cm, Radial
0 5 10 15 20
1 1.5 2
2.5x 10
-3
r (cm)
R= 10cm, Axial
0 5 10 15 20
3 4 5 6
7x 10
-4
r (cm)
R= 20cm, Radial
0 5 10 15 20
2 4 6
8x 10
-4
r (cm)
R= 20cm, Axial
DOI: 10.4236/ijmpcero.2018.72019 224 Int. J. Medical Physics, Clinical Engineering and Radiation Oncology
3.3. Total CSS Distribution of Incident Cone
Beam on the Slab Phantom
In the benchmarked calculations, the phantom volume within the X-ray field consists of [26, 20, 30] voxels with voxel size 1 × 1 × 1 cm3 and in the model
cal-culations, the irradiated phantom volume consists of [26, 20] pencil-beams with beam size 1 × 1 cm2. The CSS distribution on the detector plane consists of [80,
60] pixels with pixel size 0.5 × 0.5 cm2. Figure 6 shows the CSS distributions by
the benchmarked calculation and the proposed model, respectively. The RMSE is 3.8%, indicating high agreement achieved. The computational time by the model was about 30 times less than the benchmarked method.
(a)
[image:11.595.228.517.232.654.2](b)
Figure 6. The CSS distribution on the projection plane (40 × 30 cm2, pixel size 0.5 × 0.5
cm2) with cone beam field (26 × 20 cm2 at SAD = 100 cm) incident on the slab phantom (thickness 30 cm) calculated by (a) the point target method as the benchmarked result and (b) the proposed analytical framework. The pixel value represents the scatter-to-primary ra-tio. And the RMSE is 3.8%.
benchmarked
0.1668 0.2073 0.2479 0.2884 0.329
proposed method
DOI: 10.4236/ijmpcero.2018.72019 225 Int. J. Medical Physics, Clinical Engineering and Radiation Oncology
4. Discussions
The general form of PBSK applied by superposition or convolution methods for scatter calculation is usually obtained by measurements or Monte Carlo simula-tions using large slabs or disks and has symmetric, spatially invariant formula-tion [16] [17]. However, the realistic objects in question for scatter correction usually deviate from slabs or disks in contours, size and medium homogeneity, causing asymmetric deformation of the PBSK. The method proposed in this study explores an analytical approach for correcting the spatial variation of the PBSK, yet only focusing on the CSS component which is generally dominant in spatial distribution over the other components of the PBSK.
The quartic formula as an approximation of the line integration of unatte-nuated CSS was derived under the conditions of E
(
1−p)
<1 and r 1h x+ < . In
kV-CBCT, the maximum photon energy is 130keV and the maximum value of E
is 130/511 = 0.25. As shown in Figure 2, the accuracy of the quartic formula va-ries slightly with different photon energies. Because the high order terms of
r
h x+ are truncated in the approximation, the error of the quartic formula
in-creases with the off-axis distance r. Assuming h = 50 cm and the object size less than 40 cm in diameter, the condition of r 1
h x+ < may be violated at off-axis
distance r beyond 30 cm for beam segment (x) at the lower end of the pen-cil-beam and increased error can be caused by using the quartic formula. How-ever, as the detector active area has a maximum size of 40 × 30 cm2, such
in-creased error only happens at the periphery of the detection area. Using larger isocenter-to-detector height (h) can increase the accuracy of the quartic formula, as shown in Figure 3. Also the quartic formula matches the exact line integra-tion better for larger beam length, as shown in Figure 4. With increasing beam length, the value of r
h x+ is reduced for beam segments at the upper end
which have more contribution to scatter due to larger incident primary photon fluence, and thus the truncation error is reduced as well.
We introduced the concept of effective scattering center as the equivalent scatter point source of the PBSK for calculating the average post-scattering at-tenuation. An analytical equation (Equation (15)) was obtained to determine the position of the effective scattering center with a first-order approximation made.
de-DOI: 10.4236/ijmpcero.2018.72019 226 Int. J. Medical Physics, Clinical Engineering and Radiation Oncology
pendence on the object contour.
The scope of the current study has not considered medium heterogeneity in analytical calculation of the CSS component of PBSK. However, as the ob-ject-specific variance of the PBSK is determined by the post-scattering attenua-tion term, the impact of medium heterogeneity may be accounted for by ray tracing the attenuation path length from the effective scattering center. In addi-tion, the electron binding effect in Compton interaction was considered as a secondary effect to the distribution of CSS and a correction factor may be in-cluded in future work.
5. Conclusion
The method proposed in this study shows highly increased computational effi-ciency compared to the conventional analytical calculation method based on point scattering model. It is also potentially useful for correcting the spatial va-riant PBSK in adaptive superposition calculation for the purpose of scatter cor-rection in kV-CBCT.
Conflicts of Interest Disclosure
This work awarded US patent US 9,615,807 B2, April 2017 [21].
References
[1] Rührnschopf, E. and Klingenbeck, K. (2011) A General Framework and Review of Scatter Correction Methods in X-ray Cone-Beam Computerized Tomography. Part 1: Scatter Compensation Approaches. Medical Physics, 38, 4296-4311.
https://doi.org/10.1118/1.3599033
[2] Rührnschopf, E. and Klingenbeck, K. (2011) A General Framework and Review of Scatter Correction Methods in Cone Beam CT. Part 2: Scatter Estimation Ap-proaches. Medical Physics, 38, 5186-5199.https://doi.org/10.1118/1.3589140 [3] Siewerdsen, J.H. and Jaffray, D.A. (2001) Cone-Beam Computed Tomography with
a Flat-Panel Imager: Magnitude and Effects of X-ray Scatter. Medical Physics, 28, 220-231. https://doi.org/10.1118/1.1339879
[4] Attix, F.H. (2004) Introduction to Radiological physics and Radiation Dosimetry. Wiley-VCH, Weinheim.
[5] Kyriakou, Y., Riedel, T. and Kalender, W.A. (2006) Combining Deterministic and Monte Carlo Calculations for Fast Estimation of Scatter Intensities in CT. Physics in Medicine & Biology, 51, 4567-4586. https://doi.org/10.1088/0031-9155/51/18/008 [6] Yao, W. and Leszczynski, K.W. (2009) An Analytical Approach to Estimating the
First Order X-ray Scatter in Heterogeneous Medium. Medical Physics, 36, 3145-3156. https://doi.org/10.1118/1.3152114
[7] Ingleby, H.R., Elbakri, I.A., Rickey, D.W. and Pistorius, S. (2009) Analytical Scatter Estimation for Cone-Beam Computed Tomography. Proceeding of SPIE 7258, Physics of Medical Imaging, Physics of Medical Imaging, 725839.
https://doi.org/10.1117/12.813804
[8] Baer, M. and Kachelrie, M. (2012) Hybrid Scatter Correction for CT Imaging. Phys-ics in Medicine & Biology, 57, 6849-6867.
DOI: 10.4236/ijmpcero.2018.72019 227 Int. J. Medical Physics, Clinical Engineering and Radiation Oncology [9] Gong, H., Yan, H., Jia, X., Li, B., Wang, G. and Cao, G. (2017) X-ray Scatter Correc-tion for Multi-Source Interior Computed Tomography. Medical Physics, 44, 71-83. https://doi.org/10.1002/mp.12022
[10] Ouyang, L., Song, K. and Wang, J. (2013) A Moving Blocker System for Cone-Beam Computed Tomography Scatter Correction. Medical Physics, 40, Article ID: 071903. https://doi.org/10.1117/12.2008095
[11] Chen, Y., Song, Y., Ma, J. and Zhao, J. (2016) Optimization-Based Scatter Estima-tion Using Primary ModulaEstima-tion for Computed Tomography. Medical Physics, 43, 4753-4767. https://doi.org/10.1118/1.4958680
[12] Thing, R.S. and Mainegra-Hing, E. (2014) Optimizing Cone Beam CT Scatter Esti-mation in egs_cbct for a Clinical and Virtual Chest Phantom. Medical Physics, 41, Article ID: 071902. https://doi.org/10.1118/1.4881142
[13] Watson, P.G.F., Mainegra-Hing, E., Tomic, N. and Seuntjens, J. (2015) Implemen-tation of an Efficient Monte Carlo Calculation for CBCT Scatter Correction: Phan-tom Study. Journal of Applied Clinical Medical Physics, 16, 216-227.
https://doi.org/10.1120/jacmp.v16i4.5393
[14] Jia, X., Yan, H., Cerviño, L., Folkerts, M. and Jiang, S.B. (2012) A GPU Tool for Ef-ficient, Accurate, and Realistic Simulation of Cone Beam CT Projections. Medical Physics, 39, 7368-7378. https://doi.org/10.1118/1.4766436
[15] Xu, Y., Bai, T., Yan, H., Ouyang, L., Pompos, A. and Wang, J. (2015) A Practical Cone-Beam CT Scatter Correction Method with Optimized Monte Carlo Simula-tions for Image-Guided Radiation Therapy. Physics in Medicine & Biology, 60, 3567-3587. https://doi.org/10.1088/0031-9155/60/9/3567
[16] Sun, M. and Star-Lack, J.M. (2010) Improved Scatter Correction Using Adaptive Scatter Kernel Superposition. Physics in Medicine & Biology, 55, 6695-6720.
https://doi.org/10.1088/0031-9155/55/22/007
[17] Zhao, W., Brunner, S., Niu, K., Schafer, S., Royalty, K. and Chen, G. (2014) A Pa-tient-Specific Scatter Artifacts Correction Method. Proceedings of SPIE 9033, Phys-ics of Medical Imaging, 903310.
[18] Spies, L., Evans, P.M., Partridge, M., Hansen, V.N. and Bortfeld, T. (2000) Direct Measurement and Analytical Modeling of Scatter in Portal Imaging. Medical Phys-ics, 27, 462-471. https://doi.org/10.1118/1.598914
[19] Yao, W. and Leszczynski, K.W. (2009b) An Analytical Approach to Estimating the First Order Scatter in Heterogeneous Medium. II. A Practical Application. Medical Physics, 36, 3157-3167. https://doi.org/10.1118/1.3152115
[20] Ding, G.X. and Coffey, C.W. (2010) Beam Characteristics and Radiation Output of a Kilovoltage Cone-Beam CT. Physics in Medicine & Biology, 55, 5231-5248. https://doi.org/10.1088/0031-9155/55/17/022
DOI: 10.4236/ijmpcero.2018.72019 228 Int. J. Medical Physics, Clinical Engineering and Radiation Oncology
Appendix
1.1. Derivation of the Quartic
Formula of φ
S(r) (Equation (12))
From Equation (11), g(p) can be rewritten as:
( )
1(
)
2 3 4 2 5 31 1 1
1 1
1 1
1 1 1
g p f p f f f f
p p p
E E E
= − + + + +
− − − − − −
(A1)
The coefficients fj (j = 1, 2, 3, 4, 5) are
1 2 2 3 2 3 4 3 2
4 5 4 3 5 4 3
1 , 2 3 1, 3 6 1 1,
1 3 1 , 1 1
f f f
E E
E E E E E E
f f
E E E E E
= = + − = + + −
= + + = − − (A2)
Applying Taylor series expansion for the last three terms in Equation (A1):
( )
(
(
)
)
( ) (
) (
(
)
)
( ) (
)(
) ( )
(
)
0 2 2 0 3 3 01 1 1
1 1
1 1 1 1
1 1
1 2
1 1 1
2 1 1 n n n n n n n n n
E E p
p E
E n E p
p E
n n
E E p
p E ∞ = ∞ = ∞ = = − ⋅ − − − − = ⋅ − + − − − + + = − ⋅ − − − −
∑
∑
∑
(A3)By substituting Equations (A2) and (A3) into Equation (A1), g(p) then be-comes:
( )
0 1(
)
( )
(
(
)
)
2
1 1n 1 n
n n
g p β β p ∞ β E p
=
= + ⋅ − +
∑
− − (A4)The coefficients are given as following:
(
)
0 1 2 2
2
3 2 3 2
3 8
2, 4 4, 7,
1 1 1 3 5 3 2 3 1 2 for 2 .
2 2 2 2
n
E
E E
n n n
E E E E E E E
β β β
β = = + = + + = + + + + + + − − + + ≥ (A5)
Because of limn→∞βn+1 βn=1 , the series in Equation (A4) is convergent when E
(
1−p)
<1 and the high order terms (n > 2) are truncated hereinafter.The Taylor series expansion for p (the cosine of the scattering angle, as in Eq-uation (9)) is:
(
)
2 4 6
2 2
1 3
1
2 8
h x r r r
p o
h x h x h x
r h x
+
= = − + +
+ + +
+ + (A6)
Then g(p) can be written in the form of r h x
(
+)
as following:( )
2 2(
2)
2 7 2 7 9 4 64 2 4
r r r
g p E E E o
h x h x h x
= − + + + + +
+ + +
DOI: 10.4236/ijmpcero.2018.72019 229 Int. J. Medical Physics, Clinical Engineering and Radiation Oncology
Also,
(
) (
)
2 4 6
2 2
2
1 1 1 r r o r
h x h x h x
r h x h x
= − + +
+ + +
+ + + (A8)
Thus,
( )
(
)
(
)
(
)
2 22 4 6
2 2
1 2 2 4 7 11 25
4 2 4
g p
r h x
r r r
E E E o
h x h x h x
h x + + = − + + + + + + + + + (A9)
Under the condition of r h x
(
+)
<1 and neglecting the high order terms (≥6) in Equation (A9), the differential form of Compton single scatter dΦS( )
x r, asin Equation (10) is given as a quartic function of r as following:
( )
02( )
( )
2( )
40 2 4
d , d
2
S x r r
ρ
e Apb P c x c x r c x r x
Φ ≈ ⋅ ⋅ ⋅Φ ⋅ − ⋅ + ⋅
(A10)
The coefficients ck(x) with k = 0, 2, 4 are given as following:
( )
( )(
)
( )
(
)
( )(
)
( )
( )(
)
0 2 2 4 2 4 6 e 2 e 2 27 11 25 e
4 2 4
x x
x x
x x
c x
h x
c x E
h x
c x E E
h x µ µ µ − − − − − − = ⋅ + = + ⋅ + = + + ⋅ +
(A11)
1.2. Derivation of the Position of the Effective Scattering Center
(Equation (15))
First consider the scatter reaching the detector point on the pencil-beam’s axis (i.e.r =0). The scatter produced from segment x is
(
)
(
)
2 ed S x r, 0 x dx
h x µ
Φ = ∝
+ . The attenuation path length is given by
(
x r, =0)
= −x x− and the scattering angle is 0 such that the attenuation coeffi-cient is µ. The effective scattering center position x can be accurately deter-mined by:
(
)
(
)
2 2 e d e 1 d x x x x x x x h x x h x µ µ + − + − ⋅ ⋅ = + +∫
∫
(A12)
For r ≠0, the general form of dΦS
( )
x r, is given by Equation (10) and theDOI: 10.4236/ijmpcero.2018.72019 230 Int. J. Medical Physics, Clinical Engineering and Radiation Oncology