International Research Journal of Engineering and Technology
(IRJET)
e-ISSN: 2395-0056Volume: 06 Issue: 05 | May 2019 www.irjet.net p-ISSN: 2395-0072
COMPARITIVE STUDY OF DIFFERENT TYPES OF SLAGS IN CONCRETE
Vikas Kataria
1, Nikhil Jindal
2, Rahul Ravi
3, Mahesh kr. Arora
4, Sam Abbas
51
Assistant Professor, Department of Civil Engineering, Dr. Akhilesh Das Gupta Institute of Technology &
Management, New Delhi, India
2,3,4,5
Student, Department of Civil Engineering, Dr. Akhilesh Das Gupta Institute of Technology & Management, New
Delhi, India
---***---Abstract - Concrete is the most-used man-made productin the world. Concrete is widely used for making many types of structural components for different civil engineering applications. Due to limitation of quality natural resources for making concrete, the waste utilization in production of concrete are major concern in advances of civil engineering. The enormous quantity of Blast Furnace Slag (BFS), Iron Slag, Copper Slag is generally dumped in unscientific manner create environmental issues and little is used for landfill purpose without any technical input. Along with BFS iron slag and copper slag are available in enormous amount. It is interesting to know whether Blast Furnace Slag (BFS), Iron Slag, Copper Slag can be utilized as a fine aggregates (i.e. as a sand) to produce concrete.
Keywords - Slag, Copper Slag, Iron Slag, Blast Furnace Slag, strength, cement, concrete (M20), design mix
1 – INTRODUCTION
Concrete is a composite material composed of water, coarse granular material (the fine and coarse aggregate or filler) embedded in a hard matrix of material (the cement or binder) that fills the space among the aggregate particles and glues them together. Concrete is widely used for making architectural structures, foundations, brick or block walls, pavements, bridges or overpasses, highways, runways, parking structures, dams, pools/reservoirs, pipes, footings for gates, fences and poles and even boats. Concrete is used in large quantities almost everywhere mankind has a need for infrastructure
The amount of concrete used worldwide, ton for ton, is twice that of steel, wood, plastics, and aluminium combined. Concrete’s use in the modern world is exceeded only by that of naturally occurring water. Concrete is also the basis of a large commercial industry. Due to global warming the need to cut down energy consumption has increased. The effect of global warming has impacted everyone on the planet and is a well-recognised concept.
The interest of construction community in using waste or recycled materials in concrete is increasing because of the emphasis placed on sustainable construction.
As slag is an industrial by- product, its productive use grant an chance to relocate the utilization of limited
natural resources on a large scale. Iron slag is a byproduct obtained in the manufacture of pig iron in the blast furnace and is produced by the blend of down to earth constituents of iron ore with limestone flux. Iron and steel slag can be differentiating by the cooling processing when removed from the furnace in the industry. Mostly, the slag consists of magnesium, aluminium silicates calcium and manganese in various arrangements. Even though the chemical composition of slag same but the physical properties of the slag vary with the varying.
Copper slag is used in the concrete as one of the alternative materials. It is the waste product of copper. The safe disposal of this waste is a lack, costly and causes environmental pollution. The construction industry is the only area where the safe use of waste material (copper slag) is possible. When it is introduced in concrete as a replacement material, it reduces the environmental pollution, space problem and also reduces the cost of concrete.
The main objective of this investigation is to evaluate the effect of different types of slags on the compressive strength and the other properties of concrete and to evaluate the possibility of using slag in concrete without sacrificing the strength. The following were also considered.
1. Partial substitute for the fine aggregate.
2. To determine the percentage of slag which gives maximum strength when compared to control concrete
2 – MATERIAL AND DESIGN METHODOLGY
2.1.
Materials
The properties of material used for making concrete mix are determined in laboratory as per relevant codes of practice. Different materials used in present study were cement, coarse aggregates, and fine aggregates, in addition to plastic bags and iron slag.
International Research Journal of Engineering and Technology
(IRJET)
e-ISSN: 2395-0056Volume: 06 Issue: 05 | May 2019 www.irjet.net p-ISSN: 2395-0072
Aggregates –
Fine aggregate: fine aggregate was used locally available. It was sieved through 2.36mm IS sieve. Fineness modulus was 2.59, and of zone - II
Coarse aggregate: broken granite rocks of size 10mm and 20mm which were used, of abrasion value of 30%, crushing value of 24.3%
Copper slag - Copper slag is a by-product of copper extraction by smelting. The Copper Slag was properly sieved and fineness modulus of slag is 3.29 (Zone 2)
Blast Furnace Slag - Ground-granulated blast-furnace slag (GGBS or GGBFS) is obtained by quenching molten iron slag. The Slag was properly sieved and fineness modulus of slag is 2.655 (Zone 2)
Iron Slag - The iron and steel slag that is generated as a by-product of iron and steel manufacturing processes. The Slag was properly sieved and fineness modulus of slag is 3.3145 (Zone 2)
Water - The potable water from the college was used for mixing and curing the concrete.
2.2.
Methodology
In this study we follow the under mentioned model for the design, planning, implementation and achievement of the project:
1. The materials to be used will be collected.
2. Various tests on the materials will be done to check quality standards.
3. Mix design of the concrete will be done (M20).
4. Slag is added at different percentages with respect to weight of aggregate as a replacement of aggregate. Blast furnace slag in concrete (21, 23, 25, 27, 29 %) Copper Slag in concrete (39, 41, 43, 45, 47 %) Iron Slag in concrete (24, 26, 28, 30, 32 %)
5. Nine cubes will be casted for every percentage of replacement. The dimension of test cube is 0.15m x 0.15m x 0.15m. According to the volume of material required for 9 cubes, materials are gathered and are mixed to prepare the concrete.
6. The prepared concrete will then be casted in the form of test cubes. The cube while being filled is tamped by tamping rod to reduce the number of voids in concrete. 7. The cube will be left for 24 hours to gain shape. 8. After 24 hours, the cubes then will be taken off from the moulds.
9. They will be left for curing then.
10. Then their compressive strength will be checked from 3, 7 and 28 days from casting.
11. Analysis of results will be done then.
3 - TEST RESULTS AND ANALYSIS
[image:2.595.310.565.143.379.2]3.1.
SLUMP TEST OF CONCRETETable 1: Slump Test with partial replacement of fine aggregate with copper slag
S.NO . % Replace d Slu mp Va lue (mm)
1. 39 75
2. 41 75
3. 43 70
4. 45 50
5. 47 20
[image:2.595.310.564.436.669.2]Graph 1: Slump for Copper slag
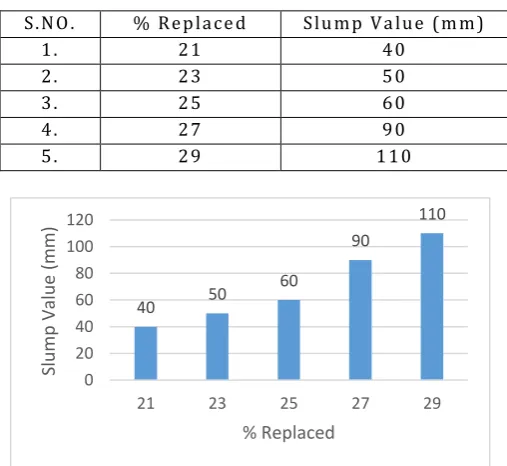
Table 2: Slump Test with partial replacement of fine aggregate with Blast Furnace Slag
S.NO . % Replace d Slu mp Va lue (mm)
1. 21 40
2. 23 50
3. 25 60
4. 27 90
5. 29 110
Graph 2: Slump for blast furnace slag
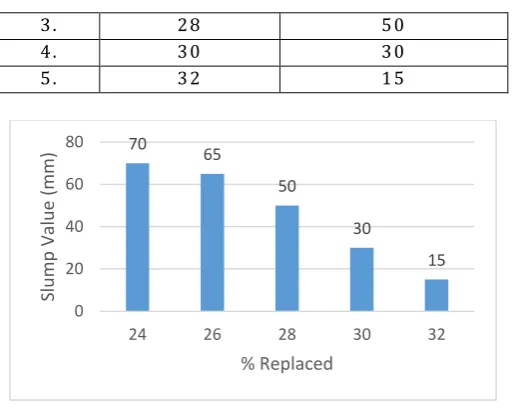
Table 3: Slump Test with partial replacement of fine aggregate with Iron slag
S.NO . % Replace d Slu mp Va lue (mm)
1. 24 70
75 75 70
50
20
0 20 40 60 80
39 41 43 45 47
Slump
Va
lu
e
(m
m
)
% Replaced
40 50
60
90
110
0 20 40 60 80 100 120
21 23 25 27 29
Slump
Va
lu
e
(m
m
)
International Research Journal of Engineering and Technology
(IRJET)
e-ISSN: 2395-0056Volume: 06 Issue: 05 | May 2019 www.irjet.net p-ISSN: 2395-0072
3. 28 50
4. 30 30
5. 32 15
Graph 3: Slump for iron slag
3.2.
COMPRESSIVE STRENGTH TESTING OFCONCRETE CUBES (.15X.15X.15 M) WITH
REPLACEMENT OF FINE AGGREGATE WITH COPPER SLAG.
[image:3.595.308.561.57.240.2]3.2.1. For 39% replacement
Table 4: Compressive strength for 39% replacement
S.No. No. of Days Cube 1 Cube 2 Cube 3
1. 3 days 11.20 11.45 11.30
2. 7 days 16.80 16.50 16.60
3. 28 days 29.40 29.15 29.30
[image:3.595.31.291.68.272.2]Graph 4: 39% replacement 3.2.2. For 41% replacement
Table 5: Compressive strength for 41% replacement
S.No. No. of Days Cube 1 Cube 2 Cube 3
1. 3 days 12.10 11.75 11.90
2. 7 days 19.05 19.20 18.90
3. 28 days 30.20 30.05 29.90
Graph 5: 41% replacement
[image:3.595.311.565.313.567.2]3.2.3. For 43% replacement
Table 6: Compressive strength for 43% replacement
S.No. No. of Days Cube 1 Cube 2 Cube 3
1. 3 days 11.20 11.50 11.35
2. 7 days 18.10 18.35 18.20
3. 28 days 28.60 28.45 28.90
Graph 6: 43% replacement
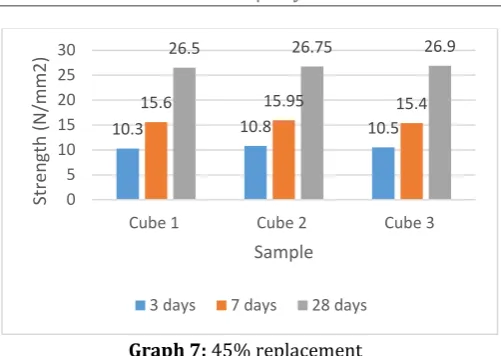
3.2.4. For 45% replacement
Table 7: Compressive strength for 45% replacement
S.No. No. of Days Cube 1 Cube 2 Cube 3
1. 3 days 10.30 10.80 10.50
2. 7 days 15.60 15.95 15.40
3. 28 days 26.50 26.75 26.90
70
65
50
30
15
0 20 40 60 80
24 26 28 30 32
Slump
Va
lu
e
(m
m
)
% Replaced
11.2 11.45 11.3
16.8 16.5 16.6
29.4 29.15 29.3
0 5 10 15 20 25 30 35
Cube 1 Cube 2 Cube 3
Strengt
h
(N
/m
m
2)
Sample
3 days 7 days 28 days
12.1 11.75 11.9
19.05 19.2 18.9
30.2 30.05 29.9
0 5 10 15 20 25 30 35
Cube 1 Cube 2 Cube 3
Strengt
h
(N
/m
m
2)
Sample
3 days 7 days 28 days
11.2 11.5 11.35
18.1 18.35 18.2
28.6 28.45 28.9
0 5 10 15 20 25 30 35
Cube 1 Cube 2 Cube 3
Strengt
h
(n
/m
m
2)
Samples
[image:3.595.31.285.429.680.2]International Research Journal of Engineering and Technology
(IRJET)
e-ISSN: 2395-0056Volume: 06 Issue: 05 | May 2019 www.irjet.net p-ISSN: 2395-0072
[image:4.595.167.547.40.231.2]Graph 7: 45% replacement 3.2.5. For 47% replacement
Table 8: Compressive strength for 47% replacement
S.No. No. of Days Cube 1 Cube 2 Cube 3
1. 3 days 10.50 10.35 10.70
2. 7 days 14.40 14.10 14.25
3. 28 days 26.20 26.45 26.30
Graph 8: 47% replacement
3.3.
COMPRESSIVE STRENGTH TESTING OFCONCRETE CUBES (.15X.15X.15 M) WITH
REPLACEMENT OF FINE AGGREGATE WITH BLAST FURANCE SLAG
[image:4.595.35.286.60.238.2]3.3.1. For 21% replacement
Table 9: Compressive strength for 21% replacement
S.No. No. of Days Cube 1 Cube 2 Cube 3
1. 3 days 10.20 10.40 10.70
2. 7 days 15.70 15.20 15.50
3. 28 days 26.20 26.40 26.00
Graph 9: 21% replacement
[image:4.595.31.285.283.510.2]3.3.2. For 23% replacement
Table 10: Compressive strength for 23% replacement
S.No. No. of Days Cube 1 Cube 2 Cube 3
1. 3 days 11.20 11.50 11.05
2. 7 days 17.30 17.50 17.05
3. 28 days 27.40 27.60 27.00
Graph 10: 23% replacement
3.3.3. For 25% replacement
Table 11: Compressive strength for 25% replacement
S.No. No. of Days Cube 1 Cube 2 Cube 3
1. 3 days 11.30 11.00 11.50
2. 7 days 18.50 18.20 18.70
3. 28 days 28.20 28.50 28.00
10.3 10.8 10.5
15.6 15.95 15.4
26.5 26.75 26.9
0 5 10 15 20 25 30
Cube 1 Cube 2 Cube 3
Strengt
h
(N
/m
m
2)
Sample
3 days 7 days 28 days
10.5 14.4 10.35 14.1 10.7 14.25
26.2 26.45 26.3
0 5 10 15 20 25 30
Cube 1 Cube 2 Cube 3
Strengt
h
(N
/m
m
2)
Samples
3 days 7 days 28 days
10.2 10.4 10.7
15.7 15.2 15.5
26.2 26.4 26
0 5 10 15 20 25 30
Cube 1 Cube 2 Cube 3
Strengt
h
(N
/m
m
2)
Sample
3 days 7 days 28 days
11.2 11.5 11.05
17.3 17.5 17.05
27.4 27.6 27
0 5 10 15 20 25 30
Cube 1 Cube 2 Cube 3
Strengt
h
(N
/m
m
2)
Sample
[image:4.595.309.565.304.528.2]International Research Journal of Engineering and Technology
(IRJET)
e-ISSN: 2395-0056Volume: 06 Issue: 05 | May 2019 www.irjet.net p-ISSN: 2395-0072
Graph 11: 25% replacement
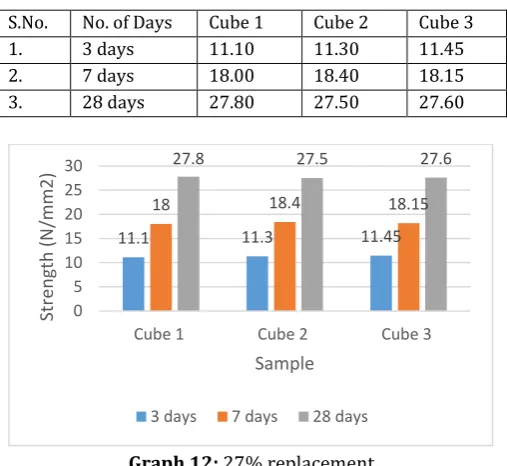
[image:5.595.307.560.60.233.2]3.3.4. For 27% replacement
Table 12: Compressive strength for 27% replacement
S.No. No. of Days Cube 1 Cube 2 Cube 3
1. 3 days 11.10 11.30 11.45
2. 7 days 18.00 18.40 18.15
3. 28 days 27.80 27.50 27.60
Graph 12: 27% replacement
3.3.5. For 29% replacement
Table 13: Compressive strength for 29% replacement
S.No. No. of Days Cube 1 Cube 2 Cube 3
1. 3 days 10.70 10.30 10.50
2. 7 days 16.90 17.10 16.60
3. 28 days 26.10 26.30 25.85
Graph 13: 29% replacement
3.4.
COMPRESSIVE STRENGTH TESTING OFCONCRETE CUBES (.15X.15X.15 M) WITH
REPLACEMENT OF FINE AGGREGATE WITH IRON SLAG
[image:5.595.35.279.60.228.2]3.4.1. For 24% replacement
Table 14: Compressive strength for 24% replacement
S.No. No. of Days Cube 1 Cube 2 Cube 3
1. 3 days 10.6 10.80 10.40
2. 7 days 17.20 17.10 17.35
3. 28 days 28.00 27.40 27.60
Graph 14: 24% replacement
3.4.2. For 26% replacement
Table 15: Compressive strength for 26% replacement
S.No. No. of Days Cube 1 Cube 2 Cube 3
1. 3 days 11.30 11.50 11.05
2. 7 days 18.70 18.50 18.95
3. 28 days 29.00 29.20 29.35
11.3 11 11.5
18.5 18.2 18.7
28.2 28.5 28
0 5 10 15 20 25 30
Cube 1 Cube 2 Cube 3
Strengt
h
(N
/m
m
2)
Sample
3 days 7 days 28 days
11.1 11.3 11.45
18 18.4 18.15
27.8 27.5 27.6
0 5 10 15 20 25 30
Cube 1 Cube 2 Cube 3
Strengt
h
(N
/m
m
2)
Sample
3 days 7 days 28 days
10.7 10.3 10.5
16.9 17.1 16.6
26.1 26.3 25.85
0 5 10 15 20 25 30
Cube 1 Cube 2 Cube 3
Strengt
h
(N
/m
m
2)
Sample
3 days 7 days 28 days
10.6 10.8 10.4
17.2 17.1 17.35
28 27.4 27.6
0 5 10 15 20 25 30
Cube 1 Cube 2 Cube 3
Strengt
h
(N
/m
m
2)
Sample
[image:5.595.32.286.297.530.2] [image:5.595.311.565.378.612.2]International Research Journal of Engineering and Technology
(IRJET)
e-ISSN: 2395-0056Volume: 06 Issue: 05 | May 2019 www.irjet.net p-ISSN: 2395-0072
Graph 15: 26% replacement
[image:6.595.35.283.65.244.2]3.4.3. For 28% replacement
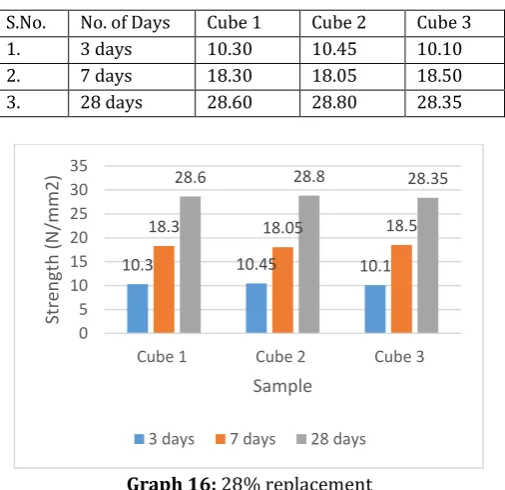
Table 16: Compressive strength for 28% replacement
S.No. No. of Days Cube 1 Cube 2 Cube 3
1. 3 days 10.30 10.45 10.10
2. 7 days 18.30 18.05 18.50
3. 28 days 28.60 28.80 28.35
Graph 16: 28% replacement
3.4.4. For 30% replacement
Table 24: Compressive strength for 30% replacement
S.No. No. of Days Cube 1 Cube 2 Cube 3
1. 3 days 10.80 11.00 10.65
2. 7 days 17.60 17.80 17.50
3. 28 days 27.20 27.60 27.35
Graph 17: 30% replacement
[image:6.595.309.564.302.528.2]3.4.5. For 32% replacement
Table 18: Compressive strength for 32% replacement
S.No. No. of Days Cube 1 Cube 2 Cube 3
1. 3 days 9.40 9.60 9.20
2. 7 days 15.85 15.70 16.00
3. 28 days 24.40 24.60 24.15
Graph 18: 32% replacement
3.5.
Comparison of strength with different slags at different daysGraph 19: strength comparison using different percentage of copper slag
11.3 11.5 11.05
18.7 18.5 18.95
29 29.2 29.35
0 5 10 15 20 25 30 35
Cube 1 Cube 2 Cube 3
Strengt
h
(N
/m
m
2)
Sample
3 days 7 days 28 days
10.3 10.45 10.1
18.3 18.05 18.5
28.6 28.8 28.35
0 5 10 15 20 25 30 35
Cube 1 Cube 2 Cube 3
St
ren
gt
h
(N
/mm2)
Sample
3 days 7 days 28 days
10.8 11 10.65
17.6 17.8 17.5
27.2 27.6 27.35
0 5 10 15 20 25 30
Cube 1 Cube 2 Cube 3
Strengt
h
(N
/m
m
2)
Sample
3 days 7 days 28 days
9.4 9.6 9.2
15.85 15.7 16
24.4 24.6 24.15
0 5 10 15 20 25 30
Cube 1 Cube 2 Cube 3
Strengt
h
(N
/m
m
2)
Sample
3 days 7 days 28 days
11.45 16.8 12.1 11.5 10.8 10.7 19.2 18.35 15.95
14.4
29.4 30.2 28.9
26.9 26.45
0 10 20 30 40
39% 41% 43% 45% 47%
Strengt
h
(N
/m
m
2)
% Slag
Copper Slag
[image:6.595.33.286.312.557.2]International Research Journal of Engineering and Technology
(IRJET)
e-ISSN: 2395-0056Volume: 06 Issue: 05 | May 2019 www.irjet.net p-ISSN: 2395-0072
Graph 20: strength comparison using different
percentage of blast furnace slag Graph 21: strength comparison using different percentage of iron slag
Graph 19: strength comparison of different slags
4 - CONCLUSIONS
1. The replacement of fine aggregate using slag in concrete increases the density of concrete thereby increases the selfweight of the concrete.
2. The workability of concrete increased with the increase in slag content of fine aggregate replacements at same water-cement ratio upto a certain percentage.
3. After adding 26% iron slag in the mix, there is an increase in compressive strength after 3 days, 7 days and 28 days respectively as compare to control mix. After 28% there is decrease in compressive strength. 4. After adding 41% copper slag in the mix, there is an
increase in compressive strength after 3 days, 7 days
and 28 days respectively as compare to control mix. After 43% there is decrease in compressive strength.
5.
After adding 25% Blast Furnace slag in the mix, there is an increase in compressive strength after 3 days, 7 days and 28 days respectively as compare to control mix. After 27% there is decrease in compressive strength.REFERENCES
1. D Brindha and S Nagan, “Durability studies Copper Slag admixed Concrete”, Asian Journal of Civil Engineering (Building and Housing), Vol. 12 (5), pp 563 – 578, 2011.
2. Semiha Akcaozoglu and Cengiz Duran Atis, “Effect of Granulated Blast Furnace Slag and fly ash addition on
10.7 11.05 11.5 11.3 10.7
15.7 17.5 18.7 18.4 17.1
26.4 27.6 28.5 27.8 26.3
0 5 10 15 20 25 30
21% 23% 25% 27% 29%
Strengt
h
(N
/m
m
2)
% Slag
Blast Furnace Slag
3 days 7 days 28 days
10.4 11.5 10.45 11 9.6
17.35 18.95 18.5 17.8 16
27.4 29.35 28.8 27.6
24.6
0 5 10 15 20 25 30 35
24% 26% 28% 30% 32%
Strengt
h
(n
/m
m
2)
% Slag
Iron Slag
3 days 7 days 28 days
0 5 10 15 20 25 30 35
Copper (41%) Blast Furnace (25%) Iron 26%)
12.1 11.5 11.5
19.2 18.7 18.95
30.2
28.5 29.35
Strengt
h
(N
/m
m
2)
Slags
Strength of Differnet Slags
International Research Journal of Engineering and Technology
(IRJET)
e-ISSN: 2395-0056Volume: 06 Issue: 05 | May 2019 www.irjet.net p-ISSN: 2395-0072
the strength properties of lightweight mortars containing waste PET aggregates”, Construction and Building Materials, Vol. 25, pp 4052 – 4058, 2011. 3. Al-Jabri KS, Hisada M, Al-Saidy AH, Al-Oraimi SK
(2009) Performance of High Strength Concrete made with Copper Slag as a Fine Aggregate. Construction and Building Materials 23: 2132 2140.
4. Al-Akhras N.,M, (2006) “Durability of metakaolin concrete to sulfate attack.” Cement and Concrete Research Vol. 36 pp 1727-1734.
5. Aldea C, M., Young F., Wang K., Shah S. P. (2000) “Effects of curing conditions on properties of concrete using slag replacement.” Cement and Concrete Vol. 30 pp 465-472