Analysis on macro-driving forces of the arable land resources change in
1,2
1
College of Architecture and Urban Planning, Hunan University of Science and Technology,
2
College of Geography and Planning, Ludong University, Yantai 264025, China
ARTICLE INFO ABSTRACT
This paper revealed the characteristics of arable difference of change
statistics data during the re
use during the recent five years. Also, the cultivated land area
fluctuant decrease in arable process from gentl loss in
mainly converted into increase of arable reclamation the dominant macro change process of arable
cultivated land area coincided in time with the overheated economic growth res fixed assets. Spatial distribution of the decrease in arable
economic growth between different regions of Yantai population increase
INTRODUCTION
The cultivated land is a precious and limited natural resource in quantity. Therefore, it is the foundations of human survival and development to maintain certain amounts of cultivated land. Since reform and opening, China has experienced an unprecedented change of arable land into non-agricultural uses and reduced continuously quantity of the total area following the economic fast development and the rapid expansion of population (Li, 1999
backgrounds of the controversy about “who comes to feed China” and global food security crisis, the loss problem of cultivated land has caused extensive concern of the government and society various circles. Many researchers, from different sides such as the change tendency of land use, dynamic monitoring by remote sensing a environmental security of land use, etc., have carried on the beneficial discussion to the whole country or some cultivated land changes of typical area, and have made dramatic progress
Brown, 1995; Xu and Li, 2001; Zhang et al
economic macro-driving problems concretely such as the driving function way and degree might caused by economic growth and increasing population during the course of arable land reduces by a large margin and flowing into non-agricultural uses, was stil link in the field of current cultivated land changes. In Yantai where economy grows at top speed, there was farmland reduces for a peak period between 1983 and 1993. The net decrease in cultivated land was 84.3 thousand hectares in 11 years, which was 88.5% of the net reducing total quantity of arable land in 1978
present gross cultivated area, separately. Hence, the land use changes, especially human-land relationship evolution caused by limited
*Corresponding author:[email protected]
ISSN: 0975-833X
Article History:
Received 29th November, 2012 Received in revised form 14th December, 2012 Accepted 17th January, 2013 Published online 14th February, 2013
Key words:
Arable-land loss, Driving mechanism, Change process, Yantai area.
Supported by the Science and Technology Development Plan of Yantai (No. 2010163) and Shandong Province Social Science Planning Key Projects (No.10BJGJ01).
RESEARCH ARTICLE
driving forces of the arable land resources change in
Yantai Area
1,2
LIU Xianzhao* and
1Chaokui Li
College of Architecture and Urban Planning, Hunan University of Science and Technology,
Xiangtan 411201, China
College of Geography and Planning, Ludong University, Yantai 264025, China
ABSTRACT
This paper revealed the characteristics of arable-land resources and utilization, the basic process and regional difference of changes in arable-land area and current direction of cultivated land
statistics data during the reform and opening-up over the past 20 years and detailed use during the recent five years. Also, the major driving factors and influence
cultivated land area were discussed. The main conclusions were shown below: (1) There fluctuant decrease in arable-land area during the past 20 odd years. The changes of arable process from gentle decrease to steep decrease to slow decrease, and there
1985 from beginning to end, 1987-1990 and 1991-1993, respectively. (2)
mainly converted into land used for industrial and mining, residential area, and all kinds of traffic and orchard. The ease of arable-land mainly came from exploitation and reclamation of non
reclamation of industrial and mining's land. (3) The economic development, population growth and policy were the dominant macro-driving factors in decrease of cultivated land area in Yantai.
change process of arable-land was related to the national macro-policies cultivated land area coincided in time with the overheated economic growth res
fixed assets. Spatial distribution of the decrease in arable-land matched the differences in speed and scale of economic growth between different regions of Yantai area. Furthermore, the decrease in arable
population increase could not be ignored.
Copy Right, IJCR, 2013, Academic Journals
land is a precious and limited natural resource in quantity. Therefore, it is the foundations of human survival and development to maintain certain amounts of cultivated land. Since reform and opening, China has experienced an unprecedented change agricultural uses and reduced continuously quantity of the total area following the economic fast development
Li, 1999). Under the
backgrounds of the controversy about “who comes to feed China” bal food security crisis, the loss problem of cultivated land has caused extensive concern of the government and society various circles. Many researchers, from different sides such as the change tendency of land use, dynamic monitoring by remote sensing and environmental security of land use, etc., have carried on the beneficial discussion to the whole country or some cultivated land changes of typical area, and have made dramatic progress (Li, 1999;
al., 2001). But the
driving problems concretely such as the driving function way and degree might caused by economic growth and increasing population during the course of arable land reduces by a agricultural uses, was still a weak link in the field of current cultivated land changes. In Yantai where economy grows at top speed, there was farmland reduces for a peak period between 1983 and 1993. The net decrease in cultivated land was 88.5% of the
net--1998 or 19.1% of present gross cultivated area, separately. Hence, the land use changes,
land relationship evolution caused by limited
cultivated land loss in Yantai area have
representativeness in the open coastal cities in China. This paper intended to investigate and uncover the cultivated land quantity change, current direction of farmland, and the effects of the economy, population, etc. macro-driving mechanism on cultivated land change by fully using the relevant data of Yantai area, which would be extremely significant for regional sustainable land use and ecological construction, and also would be certain reference and enlightenment function for other coastal open regions to adjust and control land use with management.
Basic data
For many years the comparatively authoritative data of the total amount of cultivated land in Yantai area have been lacking all the time. These basic data given in
statistics from Yantai city and each administrative unit (municipal or district) at county level, social economic statistics such as population and gross national product, etc. with respect to the cultivated land data in 1978-1998, and the detailed survey/altering of latest land data. However, according to our analysis from the land detailed survey/altering and the statistics data of Yantai area, we found that the altering data was much larger than the statistics in the
land, orchard, forest land, and altering data of residential area in urban and rural areas and independent industrial and mining smaller than statistics (i.e. cultivated land altered data was 2.8% more than statistics in 1996). Therefore, in or
between the land investigating/altering data and statistics, statistic data every year were adjusted according to the land detailed survey/altering in the end of 1996 in order to ensure the reliability and reality of the data used in this paper.
International Journal of Current Research
Vol. 5, Issue, 02, pp. 116-120, February, 2013
INTERNATIONAL
Technology Development Plan of Yantai (No. 2010163) and Shandong Province Social Science Planning Key Projects (No.10BJGJ01).
driving forces of the arable land resources change in
College of Architecture and Urban Planning, Hunan University of Science and Technology,
College of Geography and Planning, Ludong University, Yantai 264025, China
land resources and utilization, the basic process and regional and current direction of cultivated land according to the arable-land past 20 years and detailedsurvey and altered data of land major driving factors and influence mechanism for the changes in the below: (1) There was a trend of obvious land area during the past 20 odd years. The changes of arable-land undergone the there were three peak periods of arable-land respectively. (2) The decreased arable-land was , residential area, and all kinds of traffic and orchard. The of non-utilized land and arrangement and he economic development, population growth and policy were crease of cultivated land area in Yantai. The obvious break during the policies background. The rapid decrease of cultivated land area coincided in time with the overheated economic growth resulting from the direct investment in land matched the differences in speed and scale of . Furthermore, the decrease in arable-land because of
, Academic Journals. All rights reserved.
cultivated land loss in Yantai area have extremely good typicality and representativeness in the open coastal cities in China. This paper intended to investigate and uncover the cultivated land quantity change, current direction of farmland, and the effects of the economy, driving mechanism on cultivated land change by fully using the relevant data of Yantai area, which would be extremely significant for regional sustainable land use and ecological construction, and also would be certain reference and enlightenment for other coastal open regions to adjust and control land use
For many years the comparatively authoritative data of the total amount of cultivated land in Yantai area have been lacking all the this paper consisted of arable-land from Yantai city and each administrative unit (municipal or district) at county level, social economic statistics such as population and gross national product, etc. with respect to the cultivated land the detailed survey/altering of latest land data. However, according to our analysis from the land detailed survey/altering and the statistics data of Yantai area, we found that the altering data was much larger than the statistics in the cultivated land, orchard, forest land, and altering data of residential area in urban and rural areas and independent industrial and mining smaller than statistics (i.e. cultivated land altered data was 2.8% more than statistics in 1996). Therefore, in order to narrow the difference between the land investigating/altering data and statistics, statistic data every year were adjusted according to the land detailed survey/altering in the end of 1996 in order to ensure the reliability
sed in this paper.
INTERNATIONAL JOURNAL
OF CURRENT RESEARCH
RESULTS AND ANALYSIS
Utilization of cultivated land resource and its change characteristics
Yantai city located in the eastern part of the Jiaodong Peninsula, where land development history is long, the utilization ratio of land reclamation is high and the cultivated land is concentrated, is one of the highest area of land cultivation rate of east coastal area of our country and highly centralized area of cultivated land. Reform and opening over the past 20 years, with the rapid economic development and the population growth, the very great change in arable-land use was mainly shown in the following several aspects.
An overall decreasing trend of arable-land quantity
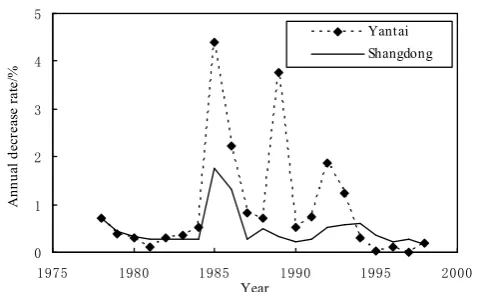
In the past more than 20 years, the change of the cultivated land quantity in Yantai area presented an overall decreasing tendency with obvious fluctuation (Fig. 1), namely that the change course has suffered from gentle reduce, steep reduce to slow reduce. From 1978 to 1998, the total decrease in cultivated land was 95.2 thousand hectares in Yantai area. In other words, the reduced cultivated area was equivalent to two medium-sized counties. Among them the first peak period of cultivated land loss appeared around 1985 since reform and opening, at this time the annual average declining rate of cultivated land was 2.48 %. The amount of cultivated land reduced in 1985 as reported by the official statistics was the most, about 23.6 thousand hectares in that year, and the decrease speed was 7 times of the highest year in Shandong in the same period. Next, the second cultivated land loss peak occurred during the period of 1987-1990 since the reform and opening, in which reduced cultivated area was 24.6 thousand hectares at an annual average decreasing rate of 1.46 % for 3 years, the highest decreasing rate was up to 3.76% (e.g. 1989). The year of 1991-1993 was the third cultivated land loss peak in Yantai area, the average annual declining rate of cultivated land was 1.29 % and led to reduce cultivated area by 14.5 thousand hectares. The reduced area of cultivated land during the three peak periods (1983-1993) was 88.5 % of the total decreased cultivated area for whole years (1978-1998).
As a whole, the quantity change trend of cultivated land in Yantai area was unanimous basically with the trend in Shandong province. Unlike this, the cultivated land loss peak of Yantai area was far more remarkable than that of the whole Shandong. For instance, in the loss peak year of 1985, annual average lapse rate in Yantai was about 2 times of Shandong. After 1996, because of strengthening the capacities of cultivated land protection, the sharply decreasing tendency of the cultivated land was prevented basically, the dynamic equilibrium of the total amount of the cultivated land has been maintained generally in Yantai area, and the decrease rate of cultivated land maintained under 0.3 % below the average level of the same period in Shandong (Fig. 1).
Fig. 1 Changes of arable-land decrease rate for over 20 years in Yatai city and Shandong province
Cultivated land resources change showing obvious spatial difference
At present, there are 7 county-level cities, 4 districts, a county and an economic development zone in all in Yantai area. The cultivated land change in this district presented obvious difference due to the evident regional diversity of natural conditions and the economic development differing from speed of population growth, combining with historical reasons (Table 1).
Table 1 showed that the maximum and minimum of average annual cultivated land decrease rate differed by more than 30 times between different counties, cities and districts in Yantai area. Among them there are 5 and 6 counties, cities and districts, where the average annual lapse rate of cultivated land exceeded 1.2% or was between 0.5% and 1.2%, accounting for 41.7% and 50.0% of total amount of counties and cities in the whole Yantai, respectively. The average annual lapse rate of arable-land in Laiyang County was less than 0.5%, only occupying 8.3%. Looked from spatial distribution, the counties and cities (district) where the average annual lapse rate of cultivated land exceeded 1.0%, are allocated mainly in both sides of
the north and south of the pediment plain and strandplain with the terrain smooth and the economic development faster. In the economic development zone the average annual lapse rate of arable-land decreased fastest, the rate exceeded 14%. While the economic development rate of both the middle part of mountain region and the hills region was relatively slow, the average annual decreasing rates of most counties and cities (district) were lower than 1.0%, especially; the rate of Laiyang was less than 0.5%. In addition, from the main change characteristics of cultivated area of all regional and average annual increase rate of GDP (Table 2), we could find that there was obvious spatial corresponding-correlation between the extent of cultivated area reduce and economic growth rate (increase rate of GDP), namely that the higher the reduction degree of
0 1 2 3 4 5
1975 1980 1985 1990 1995 2000
Year
An
n
u
al
d
ec
re
as
e
ra
te
/%
[image:2.595.318.559.51.197.2]Yant ai Shangdong
Table 1. Classification of the annual average change rate of the cultivated area in 1978-1998
Classification Rate of arable land change /% Area
Ⅰ Ⅱ Ⅲ
Ⅳ
R>3.5 3.5>R>1.2 1.2>R>0.5
R<0.5
Development zone(14.29),Zhifu zone 3.95 ( )
Fushan zone(1.42),Longkou county(1.48) Zhaoyuan county(1.43) Laishan zone(1.21) , ,
Changdao county(1.20),Haiyang county(1.06) Qixia county(0.88) Laizhou county(0.74) , , , Penglai county(0.79),Muping zone(0.84)
[image:2.595.52.542.485.547.2]Laiyang county(0.42)
Table 2. Main characteristics and economic development indexes of all types of cultivated-land loss area in Yantai city
Index Ⅰarea Ⅱarea Ⅲarea Ⅳarea
Cultivated area at the beginning of 1983/103ha Cultivated area at the end of 1993/103ha
Total reduction rate of cultivated area of 1983-1993/%
Average annual reduction rate of cultivated area of 1983-1993/% Average annual increase rate of GDP of 1983-1993/%
3.28 1.85 43.60 3.96 20.12
117.19 91.15 22.22 2.02 17.14
325.68 279.53 14.17 1.28 14.25
[image:2.595.114.486.578.640.2]cultivated land with the more developed economy was, the opposite was also true.
High land utilization ratio, less per capita cultivated area, and poor reserve resources
The land agro-farming history in Yantai area was long, in which the land intensification degree became one of the highest areas in Shandong. The whole district topography is in gentle rise and fall with wide valley and gentle slope, and the middle part is high, the north and south is low. Under the natural conditions of hillock accounting for 76.3% and the plain only accounting for 23.7% in the whole district, the cultivation index of arable-land was up to 61.3% in 1996, which was double of the average land cultivation rate (28.5%) of 11 coastal provinces (municipal or district) in the eastern part of China, 6 times of national average level (9.9%), and 5 times of average level in the world (12.2%). Combined land utilizations such as the orchard, traffic, industrial and mining and residential area, etc., the land utilization ratio of the whole district was up to 86.8%, rose to 87.8% in 2000. However, the population density in this district was high, so per capita area of cultivated farmland was less, only 0.068 hectares, which was very close to the critical minimum level of 0.067-hectares arable land per person in China (Meng and Fu,1998). Among non-reclamation lands the area of suitable cultivated land was only 2867 hectares, which only accounted for 1.6% of the total area of non-utilize land. Thus the reserve resources were poor.
Arable-land losses intensity severe, average annual lapse rate high, quality drops
The decreasing speed of cultivated land of Yantai area was the fastest from the 1960s to the present since the reform and opening-up. During 7 years from the land resource investigation to the altering survey of 1996, the net loss of cultivated land in the whole city was 75.2 thousand hectares, about 43.5% of loss cultivated area at the same period in whole Shandong. As a result, the cultivated land area on average declined by 10.7 thousand hectares every year. If the intensity of cultivated land loss was denoted by the loss cultivated land quantity of average unit land area per year, during these 7 years, the intensity of cultivated land loss of Yantai exceeded 0.7 hectares/km2, which was 25 times of the average loss intensity
(0.03hectares/km2/year) of the whole country at the same period. In 1978-1998, the average annual declining rate of cultivated land was up to 0.94%, about 2 times of the average of the same period in Shandong.
The farmland losses, especially cultivated land taken as non-agricultural construction, mainly concentrated around the cities and towns located at the plain terrain and along the traffic line, where there were stable-high yield croplands and high-quality vegetable plots. In contrast, the increased cultivated land newly was mainly the marginal lands with productivity level lower. Although these cultivated lands were still in cultivation, the usable degree was low, and the land output was poor and unstable, which was the same as the decrease in quantity of cultivated land (This hidden losses can't often be reflected from the change of the cultivated area). As a result, cultivated land quality tended towards dropping wholly. In addition, a large number of high-quality croplands were converted into orchard because of the fast enlargement of the orchard area, and a large amount of organic was fertilized into the orchard so as to reduce the amount of applied fertilizer of cultivated land organic due to the driving of economic benefits. As a consequence, the soil nutrient could not be supplemented, which directly reduced soil fertility.
The data of regional overall survey of soil in Yantai showed that most soil organic content was about 1%, the content of quick-acting phosphorus was 5-10 mg/Kg, and the total nitrogen content was about 0.07%. By reasons of the decrease in area of high-quality and high-yield lands and the increase in proportion of middle and low yield lands area, the area of the middle and low yield lands in the whole city accounted for 2/3 of the total cultivated area, and the area of soil erosion was up to more than 5000 km2.
Current direction and changes of cultivated land area in Yantai
The current direction of cultivated land quantity change in Yantai city was different from the characteristics of other districts in china. Cultivated land losses were mainly converted into lands used for independent industrial and mining, next for the residential area, all kinds of traffic and structural adjustment inside the agriculture etc. The cultivated land increased mostly derived from cultivation and reclamation of non-utilized lands, following the arrangement of independent industrial and mining's land used, and the proportion of land from the agricultural structural adjustment, traffic and water areas was relatively less. If the farmland loess in 1998 was taken as an example (Table 3), we could see that the decrease of cultivated land in Yantai was 2088.3 hectare, and the increase of the cultivated area was 1177.4 hectare. When the both were balanced, the net loss of cultivated land was 820.9 hectare. Among them the amount of non-utilized land converted into the cultivated land accounted for 56.7% in the composition of the increased cultivated land, the land used for independent industrial and mining, the residential area and orchard flowing into the cultivated land occupied by 28.1%, 7.2% and 6.4%, respectively. While the proportion of land used for traffic, forest meadow and water areas flowing into the cultivated land was very much little, about 1.5% totally. In the composition of the loss cultivated land, the cultivated land flowing into the land used for industrial and mining occupied the greatest proportion with 48.8%, cultivated land converted into the land used for residential area and traffic accounted for 18.8% and 14.4%, respectively. The loss cultivated land including flowing into orchard, forestland and grassland due to the agricultural structural adjustment occupied certain proportion by 17.3% altogether, and the amount of cultivated land transformed into the water areas and non-utilized land was only 0. 57%.
Macro-driving force of cultivated land changes
Superior natural conditions and rich economic strength in Yantai city determined that natural factors such as calamity loss and
environmental changes, etc. had little influence to cultivated land changes of this district. The change of cultivated land amount was mainly affected by two driving factors, economic development and population growth. In addition, the reduction of the cultivated land was also related to the government policy.
Economic development driving of cultivated land changes
[image:3.595.63.536.541.581.2]A great amount of cultivated land loss was a general problem that the economic fast development region faced. Sine reform and opening over the past 20 years, the economic development level of Yantai area in the course of industrialization and urbanization was occupied and arranged before in Shandong, and per capita GDP was up to 11439 yuan in 1998 (Average level in the whole province of Shandong was 8128 yuan). The sustainable fast increase in economy was accompanied by the rapid reduction of quantity of cultivated land in this region, both of which indicated that there was extremely significant logarithm-type negative correlation, namely that the
Table 3. Current direction and quantitative statistics of the cultivated land changes of 1998 in Yantai area (unit: hectare)
Items Total IIMLa Residential area Traffic land Orchard land Forest-grass land Water area Non-utilized lands ALCOb
OLCAc NLCLd
2088.3 1177.4 910.9
1020.6 331.4 689.2
391.7 84.5 307.2
302.4 3.6 298.8
227.6 75.3 152.3
133.9 12.9 121.0
10.3 1.5 8.8
1.8 668.2 -666.4
Notes: aIIML represents the “independent industrial and mining land”. bALCO represents “arable land converted into other use”. cOLCA represents “other land
cultivated land quantity presented logarithm-type reduce with increase of GDP, the coefficient correlation was up to more than 0.9 as shown in Fig. 2.
Fig. 2. The relationship between arable-land area and GDP of 1978-1998 in Yantai city
[image:4.595.40.277.493.640.2]The analyses above suggested that the economic development was one of the most major driving force of changes of cultivated land quantity, and caused non-agricultural construction land uses (e.g. land used for industrial and mining, residential buildings and traffic) occupied absolute proportion of the total amount in cultivated land loss. Certainly, economic development can't leave certain investment as start-up. Since the reform and opening-up, economic growth with high speed in Yantai area was very close and integral with large margin increase of fixed asset investment scale. It could be seen from the relationship (Fig. 3) between the increase rate of gross fixed assets investment and the reduction rate of cultivated area that the increase rate peak and low values of fixed investment were correspondent to the peak year and low ebb year of reduction rate of cultivated area, separately, the increase periodicity of investment and the reduce periodicity of cultivated area was in step basically, and the losing amount of the cultivated area was positive proportional to investment scale of fixed assets.
Fig. 3. Relationship between the growth rate of fixed asset investment and the decrease rate of arable-land area in 1978-1998 in Yantai area
Comparative economic benefits driving of cultivated land changes
Under the conditions of market economy, comparative economic benefits was the most essential reason that caused cultivated land resource was converted into non-agricultural uses or high-quality cropland was abandoned. In recent years, the agricultural production cost has risen very fast, and the price of grain was on the low continuously. As a result, it was inevitable to transform the cultivated land uses or abandon pouching because the income of planting the
grain dropped obviously. It was reported that the output value rate of unit area land used in agriculture, industry, commerce was 1:100:10000 generally. Under this kind of market economic system, the income maximization was certain to drive cultivated land resources to be converted into the orchard, fish's pool with economic income high. In this respect, there was no doubt that it was a kind of rational choice for the peasant. For instance, in 1998, the total area of cultivated land loss in Yantai was 2088.3hectare, among them the cultivated land converted into orchard was 227.6 hectare, accounting for 10.9% of the total cultivated land loss. The orchard area of Yantai increased from 42 thousand hectare in 1978 to 114 thousand hectare in 1998, which has increased nearly 2 times. However, the non-agricultural economic incomes could not offset the impacts of economy, society and ecology caused by the food security question due to the shortage of cultivated land. In order to keep agriculture develop continuously and constructions of ecological environment, in hills the government returned progressively some cultivated land where soil erosion was serious, slope was steep and soil was thin, into green mountain area, especially in 1998, the area of cultivated land converted into the forest-grass land was 133.9 hectare, occupied by 6.4% of the total area of cultivated land loss.
Population growth driving of cultivated land changes
To the fast reduction of the cultivated land, except for economic development driving force, population growth was also one of the driving forces that couldn't be ignored. With population's growth, people's habitat and other land uses should all increase accordingly, and take up some cultivated land on a certain extent. The statistics data showed that the total population in the whole city increased from 3.81million in 1949 to 6.43 million in 1998, the net increase of population was 2.63 million in 50 years, and the annual average population growth rate was 13.8‰. The cultivated area of the same period decreased from 644 thousand hectare to 450 thousand hectare, the net loss of cultivated land was 194 thousand hectare; and the per capita area of cultivated farmland decreased from 0.113 hectare in 1949 to 0.068 hectare in 1998. According to the relevant fitting between the population and the changes of cultivated land amount over the years in 1978-1998, we found that there was extremely remarkable negative correlation between them (Fig. 4), and the correlation coefficient was up to 0.857. This indicated that the rigidity reduction trend of arable land caused by population growth was irreversible, and this reverse development would make human-land contradiction be further acuity.
Fig. 4. The relationship between population quantity and arable-land area in Yantai from 1978 to 1998
Government policy driving of cultivated land changes
It could be seen from the change course of cultivated land amount of Yantai that the government decision-making had an important influence on increase and decrease of cultivated land resources. The implementation of national coastal opening strategy drove the fast growth of the economy and flourishing development of township and y = -3.1345Ln(x) + 71.476
R2 = 0.9252
42 46 50 54 58
0 2000 4000 6000
GDP /107yuan
A
ra
b
le
la
n
d
a
re
a
/1
0
4h
m
2
0 20 40 60 80 100 120 140
1975 1980 1985 1990 1995 2000
Year
In
cr
ea
se
r
ate
o
f
fix
e
d
in
v
e
stm
en
t/
%
0 1 2 3 4 5 6 7
D
ec
re
as
e
ra
te
o
f
ar
a
b
le
la
n
d
/%
Increase rate of fixed investment
Decrease rate of arable land
y = -0.134x + 130.78
R2 = 0.9549
40 45 50 55 60
550 580 610 640
Population/104person
Ar
a
b
le
la
n
d
a
re
a
\1
0
4h
m
[image:4.595.315.551.523.674.2]village enterprise of Yantai in 1984, which led to the fact that the first cultivated land loss peak in this district appeared since reform and opening-up from beginning to end of 1985 (Fig. 1). In 1987-1990, the industrial construction continuous developed on a large scale, and the city expansion took up a large amount of cultivated land, which have caused the appearance of the second cultivated land loss peak since the reform. The country raised the construction upsurge of development zone in 1992, which was no doubt for open coastal city-Yantai that the "development zone hot", "the real estate hot" and "the cultivated land replant hot" played a catalysis role in the phenomenon of enclosing the cultivated land blindly. According to the land resource investigation, the cultivated land loss caused by the "real estate hot", the "development zone hot "and the "cultivated land replant" reached 4327 hectare in 1991-1993, and many" hollow villages", "empty people's rooms", even the development zone "enclosed without opening" appeared, which caused the appearance of the third cultivated land loss peak since reform and opening-up. Because the center of this reform and opening-up was the riverine area, the peak value of this cultivated land loss was far not so remarkable as the first time and the second time. After 1996, having strengthened the cultivated land protection forces, the trend that the cultivated land fell sharply was contained basically.
Conclusion and discussion
Through investigating, collecting and arranging the cultivated land statistical data of each county, municipal or district of Yantai area for over 20 years and the land detailed survey and alter the data in recent years, the utilization and changes of cultivated land resources in Yantai area where economy fast developed have been analyzed. It could be seen without effort that cultivated land use in this region presented some basic characteristics:(I) Land utilization ratio was high, per capita area of cultivated farmland was less, and reserve resource to utilize was sparse;(II) Loss intensity of cultivated land was severe, average annual rate was high, cultivated land quality dropped, and change space difference of cultivated land resource was obvious. Reform and opening-up over the past 20 years, the quantity change of cultivated land in Yantai area showed a decreasing tendency with obvious fluctuation generally, which experienced the change course from slow reduce to sharp reduce and to gentle reduce. Among them the thrice obvious cultivated land loss peaks have appeared, including around 1985, years of 1987-1990 and 1991-1993. The main current directions of cultivated land loss were the land used for industrial and mining, and then the land used for residential area and all kinds of traffic and structural adjustment inside agriculture.
The source of the cultivated land increase was mainly the reclamation of not-utilized land, next the industrial and mining's land used for arrangement and reclaiming, the proportion of other land use accounted for very little. The main driving forces causing the quantity of cultivated land in Yantai area to reduce were economic development, population growth and government policy. Obvious sudden change in the course of the quantity of cultivated land changes were related to national macro-policy background. In turn, the phased and regional difference of the quantity of cultivated land changes were interrelated with the economic overheated stage and area economic development speed and level difference. The concrete showing was that the increase of fixed asset investment scale has driven the economic high growth and the occupy of a large amount of cultivated land, the degree of reduction of the cultivated area dropped sequentially from developed area to economic relatively under-developed area. Moreover, there was one of the driving forces, which should not be overlooked, namely that population growth caused rigidity reduction of per capita cultivated land, and multi-functional characteristics of cultivated land resource and difference of comparative economic benefits caused conversion of cultivated land use. During a quite long period in the future, with the continuous development of this regional economy, the sharp contradiction between supply and demand of cultivated land resource would exist; it would be unavoidable that the quantity of cultivated land reduces. This enlightened us that it was primary way to solve two major basic contradictions between "first it is have a meal" and "second it is construction" only relying on increasing invest and science and technology progress to improve cultivated land productivity level constantly.
REFERENCES
Brown, L. R. Who will feed China [M]. New York: W. W. Norton & Company, 1995,73-78
Li, X. B. Change of arable land area in China during the past 20 years and its policy implications. Journal of Natural Resources, 1999 14(4):329-333 ,
Meng, J. J., Fu, Z.Y. The Research on the sustainable use of cultivated land resource in China. Areal Research and Development,1998 17(4): 33-36 ,
Xu Y. Q. and Li X. B. Analysis of dynamic change and driving forces of farmland in Hebei Province. Resource Science,2001 23(5): 28-35 ,
Zhang, X., Zhang, Z. B., Peng, B. Z. A Study on urban land use-A case of Wuzhou city in Guangxi Province. Economic Geography,2001 21(4): 72-76 ,