J. Range Manage.
50:146-150
Cheatgrass and yellow starthistle growth at 3 soil depths
ROGER L. SHELEY AND LARRY L. LARSON
Authors are assistant professor, Department of Plant, Soil and Environmental Sciences, Montana State Vniversiv, Razeman, Mont. 59717; and associate professor, Department of Rangeland Resources, Oregon State VniversitY, Corvallis, stationed at OSV-EOSC Agriculture Program, Eastern Oregon State
College, L.u Grande, Ore. 97850.
Abstract
Community dynamics and dominance on cheatgrass (Bromus tectorum L.) and yellow starthistle (Centaurea solstitialis L.) infested rangeland appear to be influenced by resource acquisi- tion rates and duration of growth. Objectives were to determine the effects of densities, proportions, and soil depth on the growth rate and duration of growth of these species. In 6 field experi- ments isolated individuals, monocultures (100, 1,000, 10,000 plants rn-*), and mixtures (same densities arranged factorially) were grow-n with unrestricted and restricted (0.2- and 0.5-m) soil depths. Shoot weights were determined on 12-day intervals beginning on day 24 and ending on day 72 for plants grown with restricted soil depth and day 96 (cheatgrass) and day 108 (yellow starthistle) for plants grown in unrestricted soil. Quadratic growth curves were fit for each replication for plants grown in isolation. Linear and quadratic models were developed for plants grown in monocultures and mixtures. Simple linear regression coefficients were used as growth rates and regressed over plant density. Time of inflection (an indicator of the duration of growth) for plants growing in monocultures and mixtures was calculated from quadratic models. Growth rate of yellow starthistle was about 7 times faster and duration of growth 25 days longer, than those of cheatgrass when grown in isolation without soil depth restriction. As densities were increased and/or soil depth decreased, growth rate and duration of growth were lowered and the difference between species were masked.
Growth rates and duration of growth of cheatgrass and yellow starthistle appear to depend on plant density, soil depth, and available soil moisture.
Key Words: Centaurea solstitialis, Bromus tectorum, growth rates, growth duration, community dynamics, rangeland weeds.
Cheatgrass (Bromus tectorum L.) and yellow starthistle (Centaurea solstitialis L.) co-dominate over 250 thousand hectares of rangeland throughout the Pacific Northwest. These winter annual species arrived in North America near the turn of the century from the steppes of Eurasia. Cheatgrass, an early maturing forage, dominated most disturbed steppe communities in the Intermountain West by 1930 (Mack 1981). Since 1920, yellow startbistle, a noxious weed, has invaded cheatgrass infest-
Research funded by the National Park Service Grant CA 9000800006-13.
Published as Oregon Agr. Exp. Tech. Paper No. 10297.
Manuscript accepted 23 Apr. 1996.
ed rangeland (Maddox and Mayfisld 19S5, Sheley et al. 1993). In many areas, these species have replaced perennial grass commu- nities thereby reducing resource values (Callihan et al. 1989).
Understanding mechanisms that govern community dynamics is central to the management of rangelands dominated by alien annuals (Sheley et al. 1936). Hironaka (1989) suggested that among winter annuals, early maturing species would tend to be replaced by later maturing ones. However, shifts in community dominance between cheatgrass and yellow starthistle appear to be more complex and oscillatory (Sheley and Larson 1994a).
Dominance within cheatgrass and yellow starthistle communities tend to reflect resource availability and its impact upon growth and seed production (Sheley and Larson 1994a). Species differen- tiation within these communities is strongly influenced by the ability of yellow starthistle to attain greater root penetration than cheatgrass (Sheley et al. 1993, RochC et al. 1994, Sheley and Larson 1994a, 1994b). Consequently, edaphic conditions that restrict soil depth penetration alter the competitive advantage in favor of the relatively shallow and fibrous rooted cheatgrass (Sheley and Larson 1995).
Resource acquisition rates and duration appear to influence cheatgrass and yellow starthistle dynamics. The objectives of this study were to compare the growth rate and the duration of growth between cheatgrass and yellow starthistle at various densities, species proportions, and soil depths.
Materials and Methods
Field studies were conducted during 1992 in southeastern Washington (46” 01’ N, 118” 27’ W) at an elevation of 320 m.
The study site lies within the bluebunch wheatgrass (Pseudoroegneria spicata (Pursh) Scribn. & Smith) - Idaho fes- cue (Festuca idahoensis Elmer) habitat type (Daubenmire 1970).
Vegetation was predominantly cheatgrass and yellow starthistle.
The soil is a Walla Walla silt loam (coarse-silty, mixed, mesic Typic Haploxeroll), developed from thick loess redeposited with glacial outwash material over basalt. Annual precipitation aver- ages 380 mm with a bimodal distribution pattern that peaks dur- ing the winter and spring. Temperatures range from -34 to 45°C with an average frost-free season of 170 days.
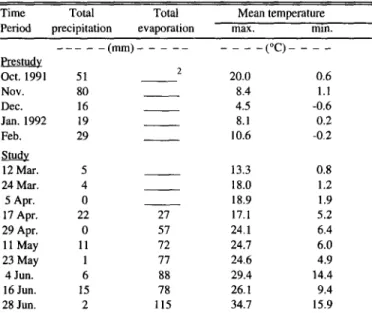
Temperature, precipitation, and evaporation were monitored daily from October 1991 through June 1992. Environmental data collected prior to the initiation of the study (October-February)
and during the study (March-June) are summarized in Table 1.
Table 1. Environmental conditions at the study site.’
Time Total Total Mean temperature
Period precipitation evaporation max. mm.
--- - Pfestudy
Oct. 1991 51
Nov. 80
Dec. 16
Jan. 1992 19
Feb. 29
&.c!y
12 Mar. 5
24 Mar. 4
5 Apr. 0
17 Apr. 22
29 Apr. 0
11 May 11
23 May 1
4 Jun. 6
16 Jun. 1.5
28 Jun. 2
-(mm)- _ - _- _
27 57 72 77 88 78 115
- - -(“C)- - - -
20.0 0.6
8.4 1.1
4.5 -0.6
8.1 0.2
10.6 -0.2
13.3 0.8
18.0 1.2
18.9 1.9
17.1 5.2
24.1 6.4
24.7 6.0
24.6 4.9
29.4 14.4
26.1 9.4
34.7 15.9
‘Monthly values are presented for the 5 months preceding the study. Twelve day values are presented to correspond with harvest dates.
‘Evaporation data were not collected during periods of freezing temp.
Growth Without Soil Depth Restriction
In study 1, growth comparisons of isolated individuals, mono- cultures, and mixtures of cheatgrass and yellow starthistle were made with unrestricted soil depths. In experiment 1, isolated (0.25 m2 plant-‘) individuals of cheatgrass and yellow starthistle were grown for each of 8 harvest dates (2 species, 4 replications).
For experiment 2, monocultural plant densities were 100, 1,000, and 10,000 plants mm2 for each species (2 species, 3 densities, 4 replications). In experiment 3, densities were factorially arranged (9 density combinations, 4 replications) for mixtures. Each exper- iment conformed to a randomized-complete-block design.
Growth With Soil Depth Restriction
In study 2, the objective was to assess growth with limited soil depth on cheatgrass and yellow starthistle. Prior experiments were repeated with soil profiles restricted to 0.2-m (shallow soil depth) and 0.5-m (moderate soil depth) by placing an 8-mil impermeable plastic liner (9 X 0.7 m) below the soil surface.
Experiments were replicated 4 times in a split-plot design with soil depth as wholeplots and plant density (isolated, monocul- tures, mixtures) as subplots.
Procedures
Seeds for all experiments were collected on site during the fall of 1991 and stored at room temperature. Seeds were sown on 29 Feb. and 1 Mar. 1992, in 0.25m2 (isolated) and 0.5-m’ (monocul- tures and mixtures) plots to avoid winter seedling mortality.
Seeds were randomly broadcast, then hand separated with forceps until uniform distance between seeds was achieved. Seeds were lightly (~2 mm) covered with soil. Plants were thinned by hand to the appropriate density 1 week after emergence. Plots with densi- ties of 10,000 plants m-2 did not require thinning.
PI _
T=- 1
2P? c-w n 5 P=EXP (PI CP2T) ’ P2T’) RGR=P, t-2P2+t
AGR= M’2-w 1 t2-t1 An individual plant of each species on each plot was chosen
randomly, then clipped to ground level, on 12-day intervals
where p I is the linear and fi2 the qundr;& regression coefficient, beginning 24 days after planting. Final harvest dates for experi-
t is time, and W, an,1 W2 are the initial and fin;11 plant weight, corresponding to tl and t2.
ments that did not restrict soil depth occurred on day 96 for cheatgrass and day 108 for yellow startlristle. Final harvests for experiments with soil depth restrictions occurred 72 days after planting for both species. Shoots were dried for -I8 hours at 60°C
and weighed (mg).
Plant Moisture Stress
Predawn xylem pressure potential (MPa) was measured on a representative plant rrom each plot in each experiment on I4 and 15 May 1992 using a pressure chamber (PMS Inc., Corvallis, Ore.). Cheatgrass plants were in the 2- to 4-leaf stage, and yellow starthistle plants were in the rosette growth stage. An equipment malfunction while collecting data in block 1 resulted in unreliable data. Data from bll jcks 2 to 3 were analyzed and are presented.
Analysis
The relationship between shoot weight and time after planting was determined by regression. Coefficients of determination, residual mean squares, sum of squares, and residuals were evalu- ated to determine the most suitable model for the prediction of accumulated shoot weight over time (Hunt 1982, France and Thomley 1984). Quadratic models provided the best estimate for plants grown in isolation, and linear models provided the best fit for monocultures and mixtures. Data were incorporated into least squares regression models of the form:
Quadratic model: f = Po+P~XI+P~X~~
Linear model: i = Po+P1X1
where i is the shoot weight (mg) and X is time in days.
Regression coefficients PO-2 are the line intercept, linear, and quadratic components of the regression equation, respectively.
Quadratic models for plants grown in isolation were deter- mined for each trentmcnt in each replication. Time of inflection (T), point of inflection (P), and relative growth rate (RGR) were calculated using the linear and quadratic regression coefficients derived from growth curves. Time of inflection is the date when the absolute growth rate (AGR) was most rapid and provides an indication of duration of growth. Point of inflection is the shoot weight at the time of maximum growth rate. Relative growth rate, an index of growth efficiency, was calculated at 36, 60, and 84 days after planting. Absolute growth rates were determined for the early (24 to 48 days after planting), milldIe (48 to 72 days after planting) and l?te (72 to 96 days after planting) growth peri- ods. Growth rates for late growth periods were only calculated for treatments without soil depth restriction. Calculation of these parameters were as follows:
JOURNAL OF RANGE MANAGEMENT 50(2), March 1997 147
Table 2. Growth of cbeatgrass and yellow starthistle grown in isolation with and without soil depth restrictinns.
Soil depth W Cheatgrass’
Starthistle’
P value 0.22 0.9 P value
Point of inflection
% 11,780
0.089 70 2,640 0.033
Time of inflection (days) 15 100 0.069 63 82 0.007
Growth Parameters
Relative prowth rate AM!te growth rate
Day 36 Day 60 Day 84 Early Middle Late
- - - -
(mg 78 day.’ 8.‘)
- - - - - _ _ _ _
131 25 4 -(mg day-‘) 20
- - - _ 24
141 104 61 4 47 223
0.0001 0.037 0.062 0.439 0.001 0.052
103 62 0.7 5
I40 94 5 43
3.003 0.031 0.010 0.008
‘Soil depth mwcstricted.
*Soil depth restriction - Combined means are presented.
Differences among mean time of inflection, point of inflection and growth rates were tested by analysis of variance. Probability values are provided to indicate level of mean separations.
Regression models of shoot weight accumulation were calculat- ed using both simple linear and curvilinear regression for plants grown in monocultures and mixtures. Time of inflection (duration of growth) for plants grown in mixtures was calculated from qua- dratic models. Linear models were developed by regressing shoot weight over the duration of the experiment and produced a p coefficient. We considered the p coefficient an estimate of the shoot growth rate. Differences between mean growth rates due to soil depth (0.2- and 0.5-m) and time of inflection for monoculture and mixtures were tested by analysis of variance.
Growth rate data derived from simple linear regression were incorporated into multiple linear regression models using least squares regression of the form:
where W, and W, were the average shoot growth rate for cheat- grass and yellow starthistle, respectively, and N, and NY were their density. Regression coefficients pco and pyo estimate the growth rate for an isolated individual. Regression coefficients pee and PYY estimate intraspecific interaction and pcy and pyc esti- mate mterspecific interaction. Ratios pcc:&.y and &p,c deter- mine the relative influence of each species density on their growth rates.
Results Environmental Conditions
Cummulative precipitation during the 5 months prior to the study amounted to 195 mm. An additional 63 mm of precipitation occurred during the 4-month study period (Table 1). By compari- son, average precipitation (59 years) for the 4-month study period is 218 mm. Below average spring precipitation is expected to occur 4 years out of 10. Precipitation during March, April, May, and June is predicted to be less than 15, 10, 10, and 5 mm, respectively, once in 10 years. Months with the lowest and high- est mean temperatures were December (4.5”C) and June (34.7”C), respectively. Several unusually warm (19’C) days occurred during March 1992. December and February minimum mean temperatures were below freezing.
Growth of Isolated Individuals
Isolated yellow starthistle growth exceeded that of cheatgrass for all parameters (PsO.10) when grown without soil depth restriction (Table 2). Early season absolute growth rate was simi- lar for both species, then separated during the latter two-thirds of the growing season. These results are consistent with other cheat- grass and yellow starthistle growth comparisons (Sheley and Larson 1994b).
Restricting soil depth from 0.5- to 0.2-m reduced growth of iso- lated plants and masked species differences (Table 2). Relative growth rates (mg day-’ 8.‘) for yellow starthistle on day 36 (P=O.O75) and 60 (P=O.O26) were greater than those of cheat- grass.
Growth of Individuals in Monocultures
Beta coefficients derived from simple linear regression indicate that increases in density decreased the growth rate of cheatgrass and yellow starthistle (Table 3). Monoculture density accounted for over 60% of the growth rate variation.
Predicted growth rate was 5-fold greater for isolated yellow starthistle growing in unrestricted soil when compared to cheat- grass (Table 3). Increasing cheatgrass and yellow starthistle den- sity lo-fold reduced their growth rate 7.6 and 48 mg day-‘, respectively. Restricting soil depth to 0.5-m, reduced yellow starthistle’s growth rate almost 3-fold, but increased the growth rate of cheatgrass. Increasing monocultural densities lo-fold reduced growth rates of cheatgrass 11 mg day-’ and yellow starthistle 13 mg day-‘. Restricting soil depth to 0.2-m, reduced growth rates to less than 7 mg day-‘.
Table 3. Simple linear regression analysis for predicting’ cheatgrass (WC) and yellow stat-thistle (WY) shoot growth rates (mg day-‘) grown in monocullm-es with and withoot soil deptb restrictions.
Species Cheatgrass
Starthistle
S(,il depth PO PI” R2
Unrestricted 30.3 - 7.6 0.68
0.5 m 43.3 -10.9 0.92
0.2-m 4.0 1.0 0.61
Unresrrictcd 150.8 -37.6 0.84
0.5-m 53.6 -13.3 0.94
0.2-m 6.5 1.7 0.61
’ W,=Pco+PccN,
*wY=.~Yo+~YY.NY
P co IS the estlm:ed growth rate of an isolated individual. p1 is the effect of increasing monocultural dcrxities nn growth rate.
Table 4. Effect of soil depth and density on the time of inflection’ for als growing in unrestricted soil was about 20 and 103 mg day-’
cheatgrass and yellow starthistle grown in monocultures. for cheatgrass and for yellow skrthistle, respectively (Table 5).
Density (plants m-L)
Soil depth 100 I.000 10,000 LSh n<\
(ml Cheatgrass’
Starthistle’
o.24 o.54
---(days) ____--_____-
81 84 51
108 69 62
80 53 51
84 13 49
113
93
LSD(O.OS) 115
‘Time of inflection is an indicator of duration of erowth.
‘Soil depth unrestricted. .
‘Comparing species or depth within each density.
‘Soil depth restriction-combined means are presented
‘Comparing density within each depth.
Based on time of inflection, the duration of growth for yellow starthistle was 27 days longer than cheatgrass when grown in monocultures of 100 plants m-* without soil depth restriction (Table 4). Increasing plant density lo-fold shortened the period of growth for yellow starthistle (69 days), but did not effect cheatgrass. Increasing plant density an additional lo-fold short- ened the period of growth for both species to about 60 days.
Density increases tended to shorten the duration of growth of both species (monocultures) with soil depth restrictions of 0.2- and 0.5-m. At the lowest and highest density, duration of growth was unaffected by soil depth (Table 4). Growth periods were sim- ilar for monocultural densities of 1,000 and 10,000 plants mm2 at 0.2-m.
Growth of Individuals in Mixtures
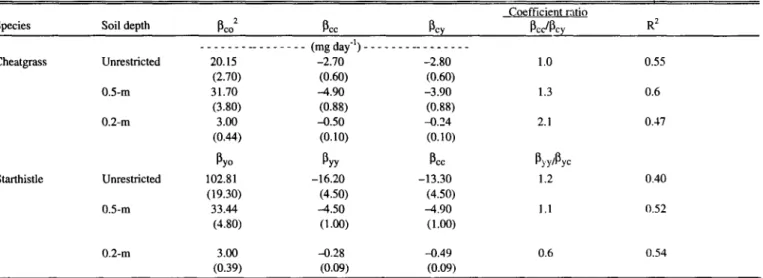
Increasing plant density (P=O.OOOl) or decreasing soil depth (P=O.OOOl) reduced growth rates of both species growing in mix- tures. Predicted growth rate (linear model) for isolated individu-
Based upon coefficient ratios, yellow starthistle density was slightly more importlmt in predicting its growth rate in unrestrict- ed soil than was cheatgrass density. Yellow starthistle and cheat- grass density were of equal value in the prediction of cheatgrass growth rate (Table 5). The duration of yellow starthistle growth was greatest at low starthistle and cheatgrass densities (Table 6).
The predicted growth rate of isolated plants (both species) grown in 0.5-m of soil was greater than 30 mg day” (Table 5).
Cheatgrass density was 1.3 times more important than yellow starthistle density in predicting cheatgrass growth rate. A lo-fold increase in either species reduced yellow starthistle growth rate 4.7 mg day-‘.
Predicted growth rate of isolated plants growing in 0.2-m of soil was 3 mg day-’ (Table 5). Cheatgrass density was about 2 times more important than yellow starthistle density in predicting the growth rate of either species under these conditions.
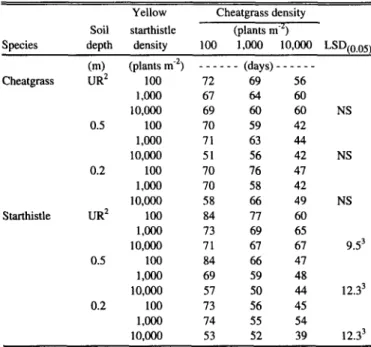
Based on the time of inflection, increasing the density of either species shortened the duration of growth for yellow starthistle with either a 0.2- or 0.5-m soil depth (Table 6). The only excep- tion occurred on the 0.2-m snil where yellow starthistle and cheatgrass densities of 1,000 and 100 resulted in a similar dura- tion of growth.
Plant Moisture Stress
Cheatgrass plants grew with greater (t-test; P S 0.0001) mois- ture stress than yellow starthistle (-1.27 vs. -0.71 MPa; predawn xylem water potential) in unrestricted soil. Intraspecific interfer- ence increased moisture stress in both cheatgrass and yellow starthistle (-PP, = -1 .O - 0.11 log Nc, R2 = 0.25; -PPy = -0.52 - 0.1 log N,, R2 = 0.43).
Cheatgrass was under less water stress (t-test; P 5 0.05) than yellow starthistle when grown with a 0.5-m soil depth restriction at cheatgrass:starthistle densities of 1O:lO (-2.6 vs. -2.9 MPa) and 1,000: 10 (-2.4 vs. -3.3 MPa). Regression models for each species
Table 5. Multiple linear regression analysis for prediction’ of cheatgrass (Wc) and yellow starthistle (Wy)shoot growth rate (mg day-‘) grown in mix- tures with and without soil depth restriction.
Species Soil depth P 2 co P cc PC,
Coefficient rntio
PCJPCY R2
Cheatgrass
Starthistle
Unrestricted 0.5-m 0.2-m
Unrestricted 0.5-m
_ _ _ _ _ _ _ __ _ _ _ _ . _ _ (mg day-‘) _ _ _ _ _ _ _ __ _ _ _ _ _ _ _
20.15 -2.70 -2.80
(2.70) (0.60) (0.60)
31.70 -4.90 -3.90
(3.80) (0.88) (0.88)
3.00 -0.50 xx?4
(0.W (0.10) (0.10)
P Y” P YY P cc
102.81 -16.20 -13.30
(19.30) (4.50) (4.50)
33.44 -4.50 A.90
(4.80) (1.00) (I.@3
I.0 0.55
1.3 0.6
2.1 0.47
PYYlPYC
1.2 0.40
1.1 0.52
0.2-m 3.00 -0.28 -0.49 0.6 0.54
(0.39) (0.W (0.09)
the growth rate of an isolated plant. Intraspecific interference is measured by the regression coefficient p,, or pyy and intarspecific interference are standard errors for coefficients significantly different from zero.
JOURNAL OF RANGE MANAGEMENT 50(2), March 1997 149
Table 6. Effects of soil depth and plant density on the time of inflection’
of cheatgrass and yellow starthistle grown in mixtures.
Species
Yellow Cheatgrass density Soil starthistle (plants me’)
depth density 100 Loo0 lO.ooO LSD,~,J~
Cm) (plants me’) _ _ _ _ _ _ (days) _ _ _ _ _ _
Cheatgrass UR* 100 12 69 56
1,ooo 67 64 60
10,000 69 60 60
0.5 100 70 59 42
1,000 71 63 44
10,000 51 56 42
0.2 100 70 76 41
LOoCJ 70 58 42
10,000 58 66 49
Starthistle UR2 100 84 II 60
Loo0 73 69 65
10,000 71 67 67
0.5 100 84 66 47
1,~ 69 59 48
10,000 57 50 44
0.2 100 73 56 45
Loo0 14 55 54
10,000 53 52 39
‘Time of intlection is considered an indicator of duration of growth.
*Unreshicted soil depth.
3Compaing density within each depth.
NS
NS
NS
9.53
12.33
12.3’
indicate that intra- and interspecific interference increased mois- ture stress (-PP, = -1.87 -0.40 log Nc -0.54 logNy, R* = 0.56; - PPy = -2.0 - 0.5 1 log N, - 0.36 log Nc, R2 = 0.54) and that yellow starthistle density was most important in both cases. The predict- ed pressure potential for an isolated cheatgrass and yellow starthistle individual grown in 0.5-m soil was about 2 and 4 times more negative than in unrestricted soil, respectively.
Cheatgrass and yellow starthistle xylem pressure potentials exceeded -5.0 MPa when the soil depth restriction was 0.2-m.
The only exception to this observation occurred with cheatgrass at the lowest density combination (-3.0 MPa).
Discussion
Intraspecific interaction was twice as influential as interspecif- ic interaction (cheatgrass vs. yellow starthistle) in predicting plant weight on deep soil (Sheley and Larson 1994b, 1995). Results from this study indicate that on deep soil growth rates and dura- tion of growth are influenced by density and may determine the success of the population. At low densities, yellow starthistle grew more rapid, longer and had greater soil depth penetration than cheatgrass. This suggests that infestations containing yellow starthistle and cheatgrass will have increased resource utilization and that the increase will be greatest on deep soils where resource partitioning can be fully developed. However, substituting (10,000 plants me’) for the density of yellow starthistle and (1,000 plants me’) for cheatgrass density in the equations in Table 5 pre- dicts the growth rate of cheatgrass to be about 4.5 mg day-‘, whereas yellow starthistle growth rate would approach zero. This supports the hypothesis that seed production and population dynamics are directing shifts in community dominance (Sheley and Larson 1995).
Talbott (1987) found yellow starthistle dominated deep soils whereas cheatgrsss dominated shallow soils. Shallow soils (0.2- m) reduced both cheatgrass and yellow starthistle growth rates in our study, shifting resource acquisition balance toward cheatgrass and away from the later maturing yellow starthistle. The relative- ly dry season during this study may have exaggerated our results, but these conditions are predicted to occur 4 times in 10 years.
Suppression of perennial grass seedlings by cheatgrass seedlings has been attributed to growth rate and root system char- acteristics (Harris 1967, Svejcar 1990, Aquirre and Johnson 1991). Sheley and Larson (1994b) found rooting depth of yellow starthistle was deeper than that of cheatgrass and suggested that differential rooting depth would promote the partition of resources. In this study, the growth rate of yellow starthistle in deep soil was nearly 7 times that of cheatgrass at low densities.
We speculate that yellow starthistle has the potential in deep soil to grow faster and sequester more resources than most perennial grass seedlings.
Literature Cited
Aguirre, L. and D.A. Johnson. 1991. Root morphological development in relation to shoot growth in seedlings of four range grasses. .I. Range Manage. 44:311-346.
Callihan, R.H., F.E. Northam, J.B. Johnson, E.L. Michalson, and T.S. Prather. 1989. Yellow starthistle biology and management in pasture and rangeland, University of Idaho. Curr. Inf. Ser. No. 634.
Moscow, Ida.
Daubenmire, R. 1970. Steppe vegetation of Washington. Washington Agr. Exp. Sta. Tech. Bull. No. 62.
France, J. and J.H.M. Thornby. 1984. Mathematical models in agricul- ture. Butterworth and Co. London, England.
Harris, G.A. 1967. Some competitive relationships between Agropyron spicatum and Bromzzs tectorum Ecol. Monogr. 37:89-l 11.
Hironaka, M. 1989. Range ecology as the basis for vegetation manage- ment, p. 85. In: B.F. RochC, Jr., and CT. Roch& (eds). Range weeds revisited. Coop. Ext. WSU, Misc. 0143. Pullman, Wash.
Hunt, R. 1982. Plant growth curves: The functional approach to plant growth analysis. University Park Press. Baltimore, Minn.
Mack, R.N. 1981. Invasion of Bromus tectorzzm L. into western North America: An ecological chronicle. Agro-ecosystems. 7:145-165.
Maddox, D.M. and A. Mayfield. 1985. Yellow starthistle infestations are on the increase. Calif. Agr. 39: 10-12.
Rocbe, B.F., Jr., C.T. Roche, and R.C. Chapman. 1994. Impacts of grassland habitat on yellow starthistle (Centnuren solstitinlis L.) inva- sion. Northwest Sci. 68:86-96.
Sheley, R.L. and L.L. I,arson. 1994a. Comparative life-histories of cheatgrass and yellow starthistle growing in association. J. Range Manage. 47:450-456.
Sheley, R.L. and L.L. Larson. 199413. Comparative growth and interfer- ence between cheatgrass and yellow starthistle seedlings. J.Range Manage. 41:410-41-l.
Sheley, R.L. alrd L.L. Larson. 1995. Interference between cheatgrass and yellow starthistle at 3 soil depths. J.Range Manage. 48:392-397.
Sbeley, R.L., L.1.. I,arson, and D.E. Johnson. 1993. Germination and root dynamics of range weeds and forage species. Weed Technol.
71234-237.
Sheley, R.L., T.J. Svejrar, and B.D. Maxwell. 1996. A theoretical framework for developing successional weed mtinagemcnt strategies on rangelands, Weed Technol. (In press).
Svejcar, T.J. 19’10. Root length, leaf area, and biomass of crested wheat- grass and cheatgrass seedlings. J. Range Manage. 43:4464148.
Talbott, C.J. 1387. Distribution and ecological amplitude of selected Centaurea species in eastern Washington. hi.S. Thesis. Washington State University. Pullman, Wash.