http://wrap.warwick.ac.uk/
Original citation:
Qureshi, H., Rajpoot, Nasir M. (Nasir Mahmood), Masood, K. and Hans, V. (2006)
Classification of meningiomas using discriminant wavelet packets and learning vector
quantization. In: Medical Image Understanding and Analysis (MIUA 2006), Manchester,
UK, 4-5 Jul 2006
Permanent WRAP url:
http://wrap.warwick.ac.uk/61557
Copyright and reuse:
The Warwick Research Archive Portal (WRAP) makes this work by researchers of the
University of Warwick available open access under the following conditions. Copyright ©
and all moral rights to the version of the paper presented here belong to the individual
author(s) and/or other copyright owners. To the extent reasonable and practicable the
material made available in WRAP has been checked for eligibility before being made
available.
Copies of full items can be used for personal research or study, educational, or
not-for-profit purposes without prior permission or charge. Provided that the authors, title and
full bibliographic details are credited, a hyperlink and/or URL is given for the original
metadata page and the content is not changed in any way.
A note on versions:
The version presented in WRAP is the published version or, version of record, and may
be cited as it appears here.For more information, please contact the WRAP Team at:
Classification of Meningiomas using Discriminant Wavelet Packets
and Learning Vector Quantization
Hammad A. Qureshia, Nasir M. Rajpoota, Khalid Masooda, Volkmar Hansb∗
aDepartment of Computer Science, University of Warwick, Coventry CV4 7AL, UK bInstitute of Neuropathogy, Evangelisches Krankenhaus, Bielefeld, Germany
Abstract. This paper presents a novel texture-based algorithm for detecting certain kinds of meningiomas in images
of neurosurgical resections. The algorithm employs Discriminant Wavelet Packet Transform (DWPT) and Learning Vector Quantization (LVQ). The adaptive DWPT of a test image is computed by maximizing the discrimination power of subbands during the basis selection process for the training images. The discrimination power of a sub-band is computed with the help of Hellinger distance between pseudo probability density functions of the subsub-band. Statistical features are then obtained for each of the top few most discriminant subbands and finally LVQ is trained and subsequently used for detection. The proposed methodology produces promising results for the multiple class meningioma classification problem with near-perfect results for detection of certain kind of meningiomas.
1
Introduction
Meningiomas are tumours of the brain and the nervous system. They arise from the cells of the meningeal covering of the brain and the spinal cord. Meningiomas account for 20% of all brain tumours and exist in the three membranes covering the brain and the spinal cord. The majority of meningiomas are benign but they can still be fatal because as they grow they push against other brain tissue. As per the World Health Organization (WHO) recommendations the meningiomas have been classified into six different types: Meningiothelial, Fibroblastic, Transitional, Psammomatous, Angiomatous and Chordo. There has been a lot of concern lately pertaining brain tumors, as according to one estimate, as many as 6 persons in 100,000 people may have some from of meningioma. The data acquired from meningioma patients at a certain instant may be huge in volume which would cause the neurosurgeon and neuropathologist to spend valuable time studying them. Therefore, its extremely important that a computerized technique is developed that would facilitate the handling of large amount of data and analysis of complex images in a reasonable time frame. This would lead to the reduction of costs and would mean access to timely treatment for more patients. Moreover, for a minority of cases around 10 to 20 percent occurrences of the said disease, the prognosis has been found to be difficult. A computerized technique may be able to help the neurosurgeon and neuropathologist involved in such cases in reaching a conclusion about the meningioma and would act as a decision support system. Hence a medical practitioners job is made easier and process of diagnosis is quicker.
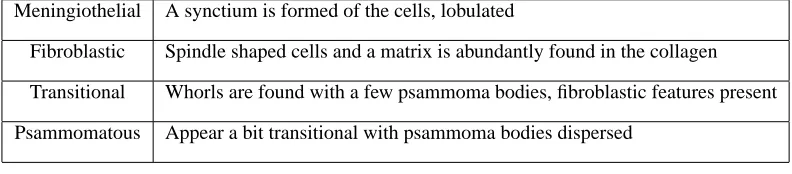
Meningiothelial A synctium is formed of the cells, lobulated
Fibroblastic Spindle shaped cells and a matrix is abundantly found in the collagen
Transitional Whorls are found with a few psammoma bodies, fibroblastic features present
[image:2.595.101.497.495.582.2]Psammomatous Appear a bit transitional with psammoma bodies dispersed
Table 1. Description of the four WHO grade I Meningioma subtypes analyzed in this study
a. b. c. d.
Figure 1. Meningioma Images for each subtype a. Meningiothelial, b. Fibroblastic, c. Transitional, d. Psammomatoes
In this study, data for only four out of six meningiomas (described in Table 1) was available for analysis. The data acquisition process involved the analysis of the resection slides on a Zeiss Axioskop 2 plus microscope with a Zeiss
[image:2.595.100.499.617.691.2]Achroplan 40x/0,65 lens to obtain 1300×1030 pixels, 24 bit, true color RGB pictures. Some of the meningioma images of the four subtypes considered in this study are shown in Figure 1. These images are converted from their RGB values to 8-level grayscale images for analysis.
Recently some work has gone into the detection and classification of brain tumors. One such effort in the domain of meningiomas was carried out by Lessman et al. [1] who studied the problem of content-based visualization of meningioma images to aid in characterization of the database contents. In this paper, we combine the feature extraction capability of the Discrete Wavelet Packet Transform (DWPT) based upon the selection of the subbands that are most useful for texture classification with classification ability of neural networks. The ability of wavelet packet transform in devising a feature selection algorithm for texture classification was demonstrated in [2, 3]. Our work is motivated by the basis selection paradigm presented in [4] and texture classification using discriminant wavelet packet subbands [5]. Statistical parameters [6] of the selected subbands are used as features for training and detection purposes. Learning Vector Quantization (LVQ) [7] is used as a classifier to discriminate between different kinds of meningiomas. LVQ has been used in the literature to discriminate between images based upon texture [8] and to classify pancreatic tissues based on their texture [9]. The following section describes the methodology of the proposed algorithm in detail. The results are presented at the end with a discussion and future directions.
2
Method
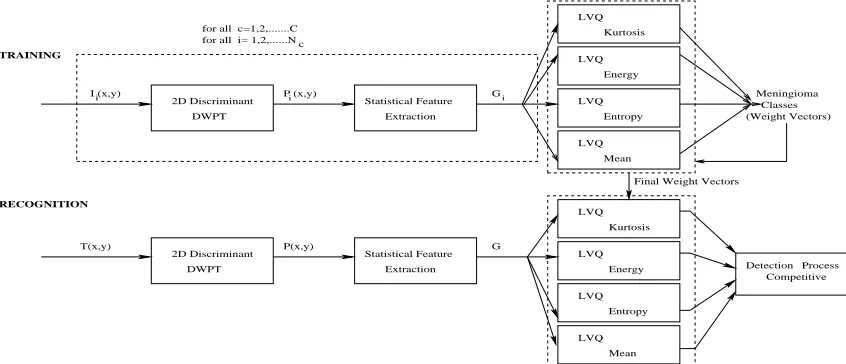
Pattern classification and detection is usually composed of three stages. The first is the pattern feature extraction, then training of the neural network on a subset of the feature images and finally the testing of all images to determine, which class they belong to. In this paper we present a technique which is based upon the above paradigm and the methodology is subdivided into three stages as shown in Figure 2.
RECOGNITION
i i
for all for all c=1,2,...C
i= 1,2,...N c
I (x,y) P (x,y)
T(x,y) P(x,y) G
G i
TRAINING DWPT 2D Discriminant 2D Discriminant DWPT Extraction Extraction Energy Statistical Feature LVQ Statistical Feature Meningioma Classes (Weight Vectors) LVQ Mean Energy LVQ Entropy LVQ LVQ Kurtosis Kurtosis LVQ LVQ Entropy LVQ Mean
Final Weight Vectors
[image:3.595.88.511.354.536.2]Detection Process Competitive
Figure 2. Block Diagram of the Methodology (DWPT=Discrete Wavelete Packet Transform, LVQ=Learning Vector
Quantization)
2.1
2D Discriminant Wavelet Packet Basis Selection
The first stage of our technique is the selection of the best basis i.e. the best description of the images in terms of wavelet packet subbands. This is important because we wish to obtain the representation of the image which would aide us in localizing the spatial frequencies and comparing the most differentiating aspects of the images. The process is divided into two steps:
2.1.1 Adaptive Wavelet Packet Transform
follows:
S0
0(l) =xl l= 0, ..., N−1
Sj2p(l) =Pkgk−2lwjn−1(k);S2jp+1(l) =
P
khk−2lwnj−1(k) l= 0, ...,2−jN−1
wheregn andhn are lowpass and highpass filters respectively, j = 1,2, ..., J;J = log2N,Sjp(l)is the transform
coefficient corresponding to the wavelet packet function having relative support size2j, frequencyp2j and is located atl2j. Hence,j,pandlare regarded as the scale, frequency and position indices of the wavelet packet function. The transform is invertible if appropriate dual filters˜gnand˜hnare applied on the synthesis side.
The wavelet packet decompositions are maintained in a quadtree structure, with the parent being the original subband or image and the children being the wavelet decompositions of the parent. First the image is decomposed into its respective subbands and then each subband is decomposed further until a predefined maximum depth of the tree is reached. This results in a combinatorial explosion of possible wavelet packet bases that can be used to completely represent the image. Hence, selection of the best basis is desirable which will adaptively maximize the discrimination power of the decompositions. This is achieved with the help of dynamic programming using an appropriate criterion as described below.
2.1.2 Discriminant Subband Selection
In the selection of subbands, a pseudo probability density function (pdf) is obtained for each subband using the nor-malized energy for the subband coefficients. Then the discriminating power of each subband is obtained, using the Hellinger distance between different classes, as follows.
D(x1, x2) =
X
i (
q
xi
1−
q
xi
2)2
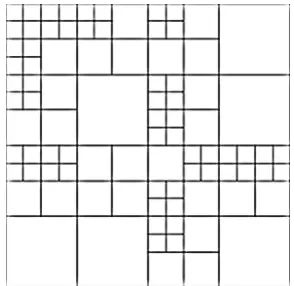
[image:4.595.226.373.456.599.2]wherexi1andxi2are the normalized energy of theith subband coefficient for two training images of different classes. This distance is used as the cost function in the best basis selection process. Once we have all the subbands that are more discriminating and a discrete wavelet packet transform of the image is obtained, a ranking of all the 91 subbands (as shown in Figure 3) according to the discriminating power is obtained. The second stage of our technique is as followed.
Figure 3. Fixed 4-Level Adaptive Wavelet Packet Geometry of a Meningioma Image for our analysis
2.2
Feature Extraction
As stated above one of the most important aspect of any pattern detection technique is extracting inherent features in an image. Consequently any texture classification technique would only be as good as the features extracted from the pattern being analyzed. The process of feature extraction is compounded in difficulty by the dimensionality of the feature space. The complexity of features selection is reduced to a great extent by employing an adaptive wavelet packet transform and using it to extract the most discriminant subbands from the complete transform. The following statistical parameters (features) were found to be useful for our application: Kurtosis:µ4=σ−4ΣGi=0−1(i−µ)4p(i)−3, Energy:
E=PGi=0−1[p(i)]2, Entropy:H=−PG−1
i=0 p(i)log2[p(i)]wherep(i)=h(i)/ N i= 0,1,. . . ,G-1,µ=
PG−1 i=0 ip(i),
σ2=PG−1
the subband. These parameters are computed for the probability density function of each subband and are subsequently used to train the neural network.
2.3
Neural Network and Pattern Classification
LVQ is a supervised network, which approximates the decision surfaces of the theoretical Bayes classifier. The training and usage of LVQ is described below and this is the final stage of the method.
2.3.1 Training of Neural Network-Learning Vector Quantization
In the training phase the statistical features (mean, kurtosis, energy, entropy) of the subbands are used as input vectors. Multiple LVQs are trained and feature vectors for selected subbands are used as training data. Each output of a LVQ represents a particular class or category. At the start of the training process, a weight vector is selected which represents the reference vector for the class that the unit represents. During training, the output units are modified through supervised training. As per the mechanism, the reference vectors are represented by the initial weightsWi=
wi1, wi2, wi3, ..., wij whereWi represents the weight vector for a certain class andjdenotes the number of elements
in each weight vector. In our case they represent the number of subbands selected for our analysis at each stage. These weights are adjusted at each stage of training called the epoch by the ruleWi=Wi+αt(Vk−Wi)if the input vector
Vkhas been classified correctly or byWi=Wi−αt(Vk−Wi)if theVkhas been classified incorrectly. The parameter
αtis defined as the learning rate which is adjusted at each stage, a typical value forαtis 0.1 and it is reduced by 0.001
at each stage of training. The training stops whenαtreaches zero or a certain criteria for training is met such as all the
input vectors are classified correctly. After the training, LVQ net classifies each input vector according to the weight vector (reference vector) to which it is closest. The proximity of a certain vector to a certain class is determined by its euclidean distance i.e. how close the reference vector is to the vector to be classifiedd=|Wi−Vk|, wheredis a
measure of proximity.
At the training stage, we selected 5 samples of each kind of meningiomas and employed them for our training purposes. Hence, after training we acquired a set of weight vectors which represented each class in the training samples separately. There were in all 84 sample images, 20 were used for training and the other 64 were used as test images. This effort was a first experiment with heuristically derived training set of 20 meningioma images. A more detailed analysis with cross validated training data would be provided soon.
2.3.2 Detection and Classification of Meningiomas
As shown in Figure 2, the detection process involves a process of competition. Four neural networks are trained based upon different statistical features (mean, kurtosis, energy and entropy). Different length of feature vectors are used for each LVQ based upon the efficiency of the results (for mean 56 subbands were used, for kurtosis 82, energy 68 and for entropy 58), the relevant features are computed for each subband. The block diagram 2 shows three neural networks because the two different LVQs for entropy and mean are shown as combined, in actual process they are separate. Then for each test image, the closest class is computed by each LVQ. If more LVQs would detect the current image as a certain class, it would finally be selected as the class to which the meningioma belongs. The reason for employing different statistical features is that each one of them was found to be better able to identify a certain meningioma. For instance, Kurtosis of the subbands was better able to identify meningothelial and other features were useful in detecting other meningiomas. A LVQ trained on kurtosis would be able to detect other meningiomas as well but with less efficacy.
3
Results and Discussion
The experimental setup consisted of employing the Daubechies 4 tap filter for obtaining the wavelet packet transform upto four levels. The data for other kinds of meningiomas, namely, Angiomatous and Chordo were not available to us at this time. The process on the whole involved: (a) adaptive wavelet packet transform of meningioma images, (b) statistical features extraction of the wavelet packet decomposition, (c) train multiple LVQs (neural networks) with extracted features (d) perform recognition using LVQ. The results of our study are depicted in Table 2.
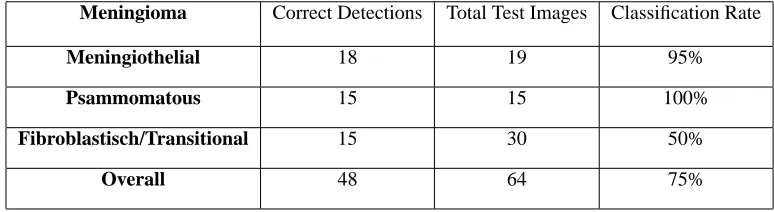
fa-Meningioma Correct Detections Total Test Images Classification Rate
Meningiothelial 18 19 95%
Psammomatous 15 15 100%
Fibroblastisch/Transitional 15 30 50%
[image:6.595.104.491.63.169.2]Overall 48 64 75%
Table 2. Meningiomas Classification results.
vored the detection of these particular kind of meningiomas. However, more sophisticated statistical features and advanced feature selection may be desirable to do as well on all kinds of meningiomas.
In certain instances fibroblastic tumor was found to resemble meningothelial to a great extent. Therefore it has been difficult to detect these as exclusively as desired (as depicted by the results). Meningioma detection process was compounded in difficulty by the fact that certain images classified as one kind contained textures belonging to more than one kinds of tumor. This was most significantly observed for the fibroblastic and transitional meningioma samples. Fibroblastic in certain images resembled meningothelial to a great extent and the transitional as stated earlier does contain fibroblastic and meningiothelial features by definition. Therefore, the one meningiothelial image classified wrongly is classed as transitional and the transitional and fibroblastic classified wrongly are classified as mengiothelial.
4
Conclusions
In this paper, we have presented a novel texture based algorithm for detection and classification of meningioma images. The algorithm was based on selecting the most discriminant wavelet packet subbands and using certain statistical features of the subbands for training the neural network. The experimental results demonstrated the effectiveness of the algorithm while exhibiting its limitations in differentiating between fibroblastic and transitional type of meningiomas. Future work may look at the effect of different wavelet filters on the classification performance. The selection of discriminant wavelet packet basis for a particular pair of meningioma classes may be useful in efficiently classifying images of different meningiomas with neural networks. Different kinds of neural networks and other classifiers may be investigated for better performance.
Acknowledgements
The authors would like to thank Prof Tim Nattkemper of the University of Bielefeld (Germany) for sharing his insights into the problem.
References
1. B. Lessmann, V. Hans, A. Degenhard et al. “Feature space exploration of pathology images using content-based database visualization.” In Proceedings SPIE Medical Imaging. 2006.
2. N. Rajpoot. “Texture classification using discriminant wavelet packet subbands.” In Proceedings 45th IEEE Midwest Symposium on Circuits and Systems (MWSCAS). 2002.
3. A. Bhalerao & N. Rajpoot. “Discriminant feature selection for texture classification.” In Proceedings 14th British Machine Vision Conference (BMVC). 2003.
4. N. Rajpoot, R. Wilson, F. Meyer et al. “A new basis selection paradigm for wavelet packet image coding.” In Proceedings IEEE International Conference on Image Processing (ICIP). 2001.
5. N. Rajpoot. “Local discriminant wavelet packet basis for texture classification.” In Proceedings SPIE Wavelets X, San Diego, California. 2003.
6. A. Materka & M. Strzelecki. “Texture analysis methods - a review.” In COST B11 report, Institute of Electronics, Technical University of Lodz. 1998.
7. L. Fausett. Fundamentals of Neural Networks. Prentice-Hall, 1994.
8. S. Livens, P. Scheunders, G. Van de Wouwer et al. “A texture analysis approach to corrosion image classification.” Microscopy, Microanalysis, Microstructures 7(2), pp. 143–52, 1996.