ISSN Online: 2327-7203 ISSN Print: 2327-7211
Stock Pattern Mining and Correspondence
Analysis Based on Association Rules
Xingru Yue, Feng Shi
College of Science, Huazhong Agricultural University, Wuhan, China
Abstract
In this paper, association rules were applied to mining patterns in stock K-line trend. The pattern which ordinary investors interested in is defined as T-RG (Three-Red Guards). In the mining process, we take the K-line in A-share markets as objects. Through the analysis, investors can select the appropriate point of purchase and selling point. With the help of T-RG, investors can bet-ter improve the chance of short-bet-term investment success in A-share markets. In order to explore and validate the T-RG, the main contents of this paper in-clude the following aspects: putting forward a method that judge the validity of rules based on confidence-lift; proposing the meta rule that corresponds to the pattern of T-RG; developing a computer program to extract the T-RG us-ing MATLAB, which supports batch minus-ing; leadus-ing fundamental factors into correspondence analysis with identification indexes; reminding the selected stocks, so as to verify the reliability of the identification indexes. According to the above research, something can be learned: In A-share markets, the higher the discriminant index value is, the less number of shares meeting the re-quirements is; the same discriminant index value, the stock proportion has difference among plates. Confidence P1, P2 and Lift are extremely related to the GC (General Capital), and Lift is extremely related to the Ind (Industry). In the GEM, confidence P1 of mid-cap is near
[
0.7,1]
, Lift is near( )
1, 3 ,con-fidence P1 of the manufacturing industry is near
[
0.7,1]
.Keywords
Stock, Meta Rule, Confidence, Lift, Correspondence Analysis
1. Introduction
Association rule mining is one of the most powerful tool for mining the poten-tial value in big data era. Although the stock market changes constantly in China, but we still can use data mining method to find out valuable information in rich How to cite this paper: Yue, X.R. and Shi,
F. (2017) Stock Pattern Mining and Cor-respondence Analysis Based on Association Rules. Journal of Data Analysis and Infor- mation Processing, 5, 77-86.
https://doi.org/10.4236/jdaip.2017.53006
Received: June 20, 2017 Accepted: July 21, 2017 Published: July 24, 2017
Copyright © 2017 by authors and Scientific Research Publishing Inc. This work is licensed under the Creative Commons Attribution International License (CC BY 4.0).
http://creativecommons.org/licenses/by/4.0/
market data. The practical significance of research is to provide a reliable refer-ence pattern and criteria, which investors can rely on to select buying and selling point. The theoretical significance is to propose improved identification indexes combined with the actual. Meanwhile, to develop the computer program for mining such patterns.
This paper aims to explore the K-line form, the research object is stock k-line data in Chinese A stock market. Due to the surge in the amount of data and practical demands of users, in the design of algorithms or indexes should fully understand the distribution characteristics of data sets. So, this paper puts for-ward the corresponding treatment methods combined with the objective.
2. Preliminaries
This section includes the association rules, K-line trend, meta rules and corres-pondence analysis.
2.1. Association Rules and Improvement
Association rules reflect the interdependence and relevance between a thing and other things, that is, a thing can be predicted by something else.
The basic model of association rules as logic implication is like shape
X
⇒
Y
, I={
i i1,2,,im}
is a collection of items, X ⊂I Y, ⊂I X, Y =φ. X is called the antecedent of the rule, that is, the premise. Y is called the rule con-sequent results [1]. The support degree and confidence degree of association rulesX
⇒
Y
are as Equation (1):(
)
(
)
(
)
(
)
Support
Confidence |
X Y P X Y
X Y P Y X
⇒ = ⇒ = (1)
When a set of transactions is given, many association rules can be generated according to the algorithm. And, only the association rules that satisfy the min-imum specified support and confidence are valuable. According to preliminary exploration, the T-RG pattern is fewer, and the user is more interested in whether the relationship between X and Y is stable. So, this paper puts emphasis on meeting the confidence, without the support threshold settings. At the same time, in order to better describe the correlation between the two item sets, in-troducing the identification index called Lift to determine the effectiveness of the rules. Lift is defined as Equation (2):
(
,
)
(
(
|
)
)
|
P Y X
Lift X Y
P Y X
=
(2)If the Lift = 1, illustrates the emergence of item sets X has no effect on Y; if greater than 1, indicating X has positive effects on Y; if less than 1, indicating in-hibitory effect. In addition, the new variable
β
is used for describing applica-tion scope of the rules:Condition number Plate number
In summary, this paper puts forward the confidence-lift to judge the validity of rules.
2.2. K-Line and T-RG
In the mining process, we take the day K line as objects. Day K line represents the transactions of a trading day. When the closing price is greater than the opening price, K-line called the positive line. When fluctuation range of line be-low 2%, called the RG (Red Guards). N consecutive Red Guards called NRG (N Red Guards).
The pattern which ordinary investors interested in is defined as T-RG (Three-Red Guards), as follows: take day K line of any stock as the sample, the middle of the N-Red Guards as center (N default 3). Meanwhile, the number of trading day is denoted as i. When highest closing price in the previous k (k
default 30) trading day greater than a certain magnitude relative to the center (decreasing amplitude r1) (r1 default 20%), followed by k, the highest closing price relative to the trading center is greater than a certain amplitude (amount of increase r2) (r2 default 10%). The sample pattern diagram shown in Figure 1.
For short-term investors, through the analysis of K line, can probably select the time of buying or selling. But the K-line combination are numerous, inves-tors usually take a long time to find the combination, understand its meaning. This paper uses the computer program, mining pattern from the data point of view. In mining, do not have to distinguish any kinds of combination patterns of the Three-Red Guards.
2.3. Meta Rule of T-RG
[image:3.595.211.531.499.717.2]Rules that users are interested in constitute a template, that is, meta rules. Con-
straint mining can not only improve the performance of data mining processes
[2], it also maximizes the value of mining results [3]. Formally, meta rules are like shapes P1∧P2∧∧Pr →Q1∧Q2∧∧Qs, among rule template,
(
1, 2, ,)
iP i= r , Qj
(
j=1, 2,,s)
are predicate variable. The meta rule cor-responding to T-RG is proposed as:(
) (
)
(
)
(
)
[
]
1
,"20%" |
,"3"
,"30"
2
,"10%" , 1,
r stock
RG stock
∧
k stock
→
r
stock
p up
(4)For the convenience of narration, the antecedent of meta rules here would be recorded as set X, the consequent denoted as set Y. Set X, Y is a sequence, represents the trend of time series, namely element model [4]. Based on the meta rule, the Three Red Guards is the base of affairs, so as to clear the scope of the transaction database and mining parameters.
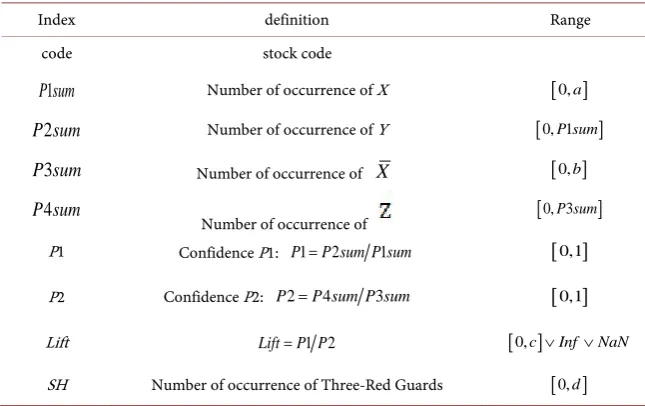
Index definitions such as Table 1. In this paper, Inf means infinity, the deno-minator is 0. NaN means not a number, that is, the numerator and denominator is 0 or NaN, or one of them is NaN. Z is such as Y, position may be different. Besides, a, b, c and d are positive integer.
2.4. Correspondence Analysis of Fundamental Factors and
Identification Indexes
In order to further understand the background information related to the rules, and to use correspondence analysis to learn the relationship. Different values of attributes variables can be drawn in a two-dimensional diagram, thus the rela-tionship could be described in the intuitive and concise way [5]. This paper in-troduces the fundamental factors such as GC (General Capital) and Ind (Indus-try).
[image:4.595.209.532.528.731.2]Obviousness, P1, P2, Lift and GC are numerical variables, Ind is character variable. For the correspondence analysis, these variables need to be discretized. Real discrete process is divide continuous attribute value into a number of relatively independent intervals, when the information loss is minimized [6]. In this
Table 1. Index definition.
Index definition Range
code stock code
1
P sum Number of occurrence of X
[ ]
0,a2
P sum Number of occurrence of Y
[
0, 1P sum]
3
P sum Number of occurrence of X
[ ]
0,b4 P sum
Number of occurrence of
[
0, 3P sum]
P1 Confidence P1: P1=P sum P sum2 1
[ ]
0,1P2 Confidence P2: P2=P sum P sum4 3
[ ]
0,1Lift Lift=P P1 2
[ ]
0,c ∨Inf∨NaNpaper, a supervised method is used, which considers the information of class attributes in the discrete process.
1)Discrete confidence P1, P2: confidence is the representative of the reliability of rules. According to the user specified threshold, it can be divided into the fol-lowing four confidence intervals (see Table 2).
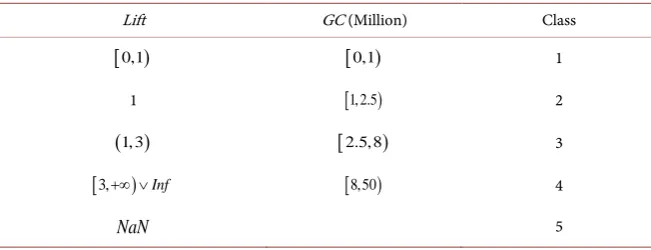
2)Discrete Lift and GC: the Lift itself can be divided into three levels, which is less than 1, equal to 1, more than 1. Combined with mining results, the Lift
can be separated into five levels as follows. According to the existing criteria, 800 million to 5 billion shares of the stock is called market share; 250 million shares to 800 million shares of the stock is called disk shares; 100 million shares to 250 million shares of the stock is called small cap stocks; 100 million shares of stock is called micro shares, separated into following four categories (see Table 3).
3. Discussion
Including analysis of mining results and correspondence analysis results.
3.1. Data Sources
The purpose of this study is to mining stock K-line pattern, variables include opening and closing prices. Using the quantization interface MATLAB to get K-line data in A share market. Data comes from Wind financial information terminal.
[image:5.595.210.538.481.579.2]In order to compare the stock of different plates, plate data are obtained sepa-rately. Concretely, 559 shares of the gem, from December 2, 2011 to December 2, 2016. 1161 shares of Shanghai A shares, from December 13, 2011 to
Table 2. Discrete confidence.
P1 P2 Class
NaN NaN 0
[
0, 0.5)[
0, 0.5) 1[
0.5, 0.7)[
0.5, 0.7) 2[
0.7,1]
[
0.7,1]
3Table 3.The dispersion of the Lift and the GC.
Lift GC (Million) Class
[
0,1)[
0,1) 11
[
1, 2.5) 2( )1, 3
[
2.5,8) 3[
3,+∞ ∨) Inf[
8,50) 4 [image:5.595.210.536.610.735.2]December 13, 2016. 1846 shares of Shenzhen A shares, from December 13, 2011 to December 13, 2016. If the index value of the trading day I is empty, it will be the same as the index value of the trading day (i-1).
3.2. Mining Results Analysis
1) Comparative analysis among platesIn Table 4,
β
indicates application scope of the rules. After horizontal and vertical analysis, shows that rules of different index range have different mean-ings. The same rules in different plates have difference proportion. For the spe-cified conditions, the more stringent requirements are, the less number of shares is. Three plates have the same law.2) Sample analysis of individual stocks
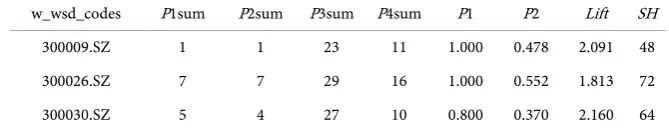
In Table 5, obviousness, some stocks have high confidence, but frequency of item sets X and Y is low. So, in order to judge the validity of rules, getting rid of contingency, it’s necessary to combine with other index, such as Lift. When the confidence level is 100%, most Lift is greater than 1. When the Lift is high, con-fidence will not be low. In some degree, the Lift is more important than confi-dence.
3.3. Correspondence Results Analysis
1) Comparative analysis among platesLearn from Table 6, we can know that P1, P2 and up are highly related to the
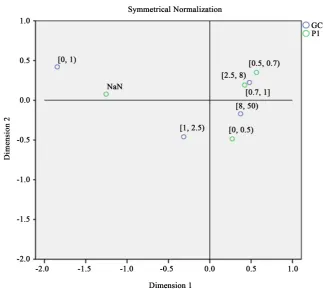
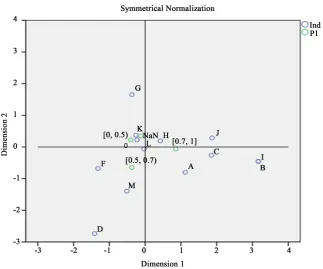
GC, and has nothing to do with plates. In addition to the Shanghai A shares, P1 has significant correlation with Ind. In addition to the GEM, P2 has significant correlation with Ind. The method is similar, so we could take the GEM as an example to make a detailed interpretation of the results. The sample pattern dia-gram shown in Figure 2.
2) General Capital and P1
[image:6.595.209.541.556.633.2]Investigate the states of the two variables, we can see the confidence of the mid cap stocks is generally higher, closing to the interval
[
0.7,1]
. ComparedTable 4. Comparative analysis among plates.
β GEM Shanghai A shares Shenzhen A shares
1 100%
P = 19.14% 21.88% 21.18%
1 70%
P ≥ & Lift>1 22.18% 24.98% 25.14%
1 90%
P ≥ & Lift≥3 1.99% 5.00% 3.85%
Table 5.Sample analysis of individual stocks.
w_wsd_codes P1sum P2sum P3sum P4sum P1 P2 Lift SH
300009.SZ 1 1 23 11 1.000 0.478 2.091 48
300026.SZ 7 7 29 16 1.000 0.552 1.813 72
[image:6.595.205.540.669.734.2]Figure 2. Two dimensional chart of general capital and P1.
Table 6.Comparative analysis among plates.
Sig. P1 P2 Lift
GEM Ind 0.020 0.181 0.536
GC 0.000 0.000 0.000
Shanghai A shares Ind 0.227 0.000 0.035
GC 0.000 0.000 0.000
Shenzhen A shares Ind 0.015 0.014 0.268
GC 0.000 0.000 0.000
with the small cap and large cap stocks, the reliability is higher. The micro is close to NaN, has no significant features.
3) Industry and P1
Investigate the states of the two variables, the confidence of H, L is close to the interval
[
0.7,1]
. The confidence of F, M are close to the interval[
0.5, 0.7)
. Theconfidence of E, K is small, closing to the interval
[
0, 0.5)
and NaN. The rest of the industry have no significant features, as shown in Figure 3.4) Lift and General Capital
Investigate the states of the two variables, the Lift of the mid and large cap stocks is close to the interval
( )
1, 3 . The Lift of micro shares is close to NaN. TheFigure 3. Two-dimensional graph of Industry and P1.
3.4. Reliability Verification
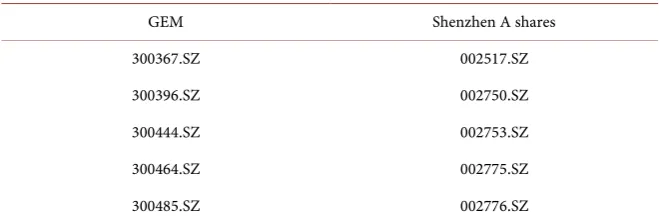
In order to verify the validity of the identification index, we have to exam the performance of T-RG of the selected stocks in recent years. Selecting the part of the stocks depended on index value. The results can illustrate the validity of identification index. Meanwhile, the process can also select stocks of well per-formance in T-RG.
3.4.1. Stock Selection
Add new index r to filter stocks, so as to ensure that the selected stock is more likely to appear T-RG pattern in the short term.
2 P sum r
SH
= (5)
The index shows that when the three red guards appeared, the frequency of T-RG pattern. Data dates from March 3, 2016 to March 3, 2017. Through the mining and analysis above, the following conditions are given:
1) When P1=100% &Lift≥ ∨2 Inf &r>0.16 &P sum2 >1, screened stocks
are as Table 7 shown.
2) When P1=100% &Lift≥ ∨2 Inf &r>0.16 &SH<12 , Shanghai A
shares are screened as follows: 601020.SH, 603227.SH.
3.4.2. Verification Results
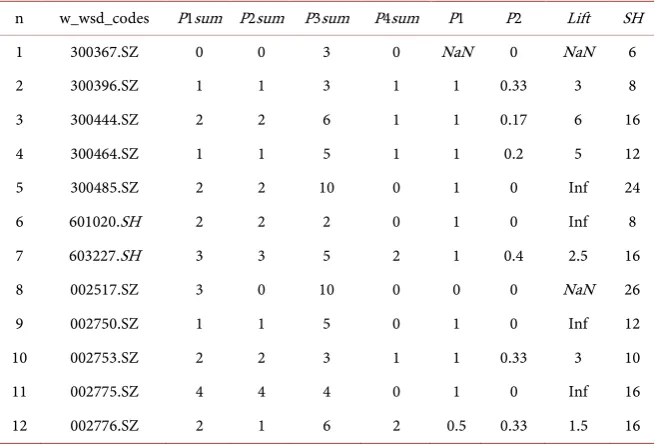
Using the previous core program and mining parameters to mine the validation data, the verification result is shown in Table 8.
From Table 8, we can see that the confidence of 300367.SZ, 002517.SZ and 002776.SZ cannot meet user requirements. But, the confidence of these three stocks are 1 when selected. In this case, it shows that rule confidence is related with the time. In addition to the above 3 stocks, 9 stocks in the degree of confidence was 1. For these stocks, the T-RG pattern is very stable. Even in different periods of time, these stocks also have good performance, not affected by other factors. The
Lift was greater than or equal to 3, indicating that the X contact closely with Y
from first to last. The X strongly promote the consequent Y.
[image:9.595.209.539.624.735.2]To sum up, selecting stock depend on the criteria is still reliable. Through this research, we can also obtain 9 stocks, which has good performance on T-RG. Meanwhile, 4 stocks that in gem belong to manufacturing, in line with the cor-respondence analysis results.
Table 7. Filter stock code.
GEM Shenzhen A shares
300367.SZ 002517.SZ
300396.SZ 002750.SZ
300444.SZ 002753.SZ
300464.SZ 002775.SZ
Table 8.Verification results.
n w_wsd_codes P1sum P2sum P3sum P4sum P1 P2 Lift SH
1 300367.SZ 0 0 3 0 NaN 0 NaN 6
2 300396.SZ 1 1 3 1 1 0.33 3 8
3 300444.SZ 2 2 6 1 1 0.17 6 16
4 300464.SZ 1 1 5 1 1 0.2 5 12
5 300485.SZ 2 2 10 0 1 0 Inf 24
6 601020.SH 2 2 2 0 1 0 Inf 8
7 603227.SH 3 3 5 2 1 0.4 2.5 16
8 002517.SZ 3 0 10 0 0 0 NaN 26
9 002750.SZ 1 1 5 0 1 0 Inf 12
10 002753.SZ 2 2 3 1 1 0.33 3 10
11 002775.SZ 4 4 4 0 1 0 Inf 16
12 002776.SZ 2 1 6 2 0.5 0.33 1.5 16
4. Conclusion
This study aims at individual share. If mining results of the stock meet the user’s specified standard, it can become the major concern. Investors can choose buy-ing and sellbuy-ing point accordbuy-ing to the T-RG. In theory, confidence-lift is pro-posed to judge the validity of the rules. The application of the research results is combined with the user’s needs.
References
[1] Agrawal, R., Lmielinshi, T. and Swmi, A. (1993b) Database Mining: A Performance Perspective. IEEE Transactions on Knowledge and Data Engineering, 5, 914-925. [2] Zhao, J., Zhang, Y.D. and Zeng, J.C. (2003) Meta Rule Guided Mining Association
Rules in Data Warehouse Improvement Strategy. Journal of Taiyuan Heavy Machi-nery Institute, 1, 1-5. (In Chinese)
[3] Kamber, M, Han, J., Jenny, Y. and Chiang, J.Y. (1997) Metarule-Guided Mining of Multi-Dimensional Association Rules Using Data Cubes. The Third International Conference on Knowledge Discovery and Data Mining (KDD-97), 14-17 August 1997,Newport Beach, California, 207-210.
[4] Ahmad, A. and Dey, L. (2007) A Method to Compute Distance between Two Cate-gorical Values of Same Attribute in Unsupervised Learning for CateCate-gorical Data Set. Pattern Recognition Letters, 28, 110-118.
https://doi.org/10.1016/j.patrec.2006.06.006
[5] He, X.Q. (2011) Multivariate Statistical Analysis. 3rd Edition, Renmin University of China Press, Beijing, 173-179. (In Chinese)
Submit or recommend next manuscript to SCIRP and we will provide best service for you:
Accepting pre-submission inquiries through Email, Facebook, LinkedIn, Twitter, etc. A wide selection of journals (inclusive of 9 subjects, more than 200 journals)
Providing 24-hour high-quality service User-friendly online submission system Fair and swift peer-review system
Efficient typesetting and proofreading procedure
Display of the result of downloads and visits, as well as the number of cited articles Maximum dissemination of your research work