ISSN Online: 1945-3108 ISSN Print: 1945-3094
DOI: 10.4236/jwarp.2019.117053 Jul. 30, 2019 866 Journal of Water Resource and Protection
Evaluating Watershed Vulnerability in
Bernalillo County, New Mexico Using Expert
Testimony, Fuzzy Analytic Hierarchy Process,
and GIS
Tracy Sadler
1, Clinton P. Richardson
1, Phillip Miller
21Department of Civil and Environmental Engineering, New Mexico Tech, Socorro, NM, USA 2New Mexico Bureau of Geology & Mineral Resources, New Mexico Tech, Socorro, NM, USA
Abstract
Geographic Information System (GIS) software was used to create a wa-tershed vulnerability model for Bernalillo County, New Mexico. Wawa-tershed vulnerability was investigated as a function of soil erosion and infiltration criteria: precipitation, land slope, soil erodibility (K-factor), vegetation cov-er (NDVI), land use, drainage density, saturated hydraulic conductivity, and hydrologic soil group. Respective criteria weights were derived using a Fuzzy Analytic Hierarchy Process (FAHP) supported by expert opinion. A survey of 10 experts, representing New Mexico Institute of Mining and Technology (NMT), the New Mexico Bureau of Geology and Mineral Re-sources (NMBGMR), and the United States Geologic Survey (USGS), pro-vided model input data for an integrated pair-wise comparison matrix for soil erosion and for infiltration. Individual criteria weights were deter-mined by decomposing the respective fuzzy synthetic extent matrix using the centroid method. GIS layers were then combined based on criteria weights to produce maps of soil erosion potential and infiltration potential. A composite watershed vulnerability map was generated by equal weighting of each input map. Model results were categorized into five vulnerability categories: not vulnerable (N), slightly vulnerable (SV), moderately vulner-able (MV), highly vulnervulner-able (HV), and extremely vulnervulner-able (EV). The resulting FAHP/GIS model was used to generate a watershed vulnerability map of discrete areas in Bernalillo County, which may be vulnerable to stormwater run-off events and soil erosion. Such high volume run-off events can cause erosion damage to property and infrastructure.
Alterna-How to cite this paper: Sadler, T., Rich-ardson, C.P. and Miller, P. (2019) Evaluat-ing Watershed Vulnerability in Bernalillo County, New Mexico Using Expert Testi-mony, Fuzzy Analytic Hierarchy Process, and GIS. Journal of Water Resource and Protection, 11, 866-885.
https://doi.org/10.4236/jwarp.2019.117053
Received: June 12, 2019 Accepted: July 27, 2019 Published: July 30, 2019
Copyright © 2019 by author(s) and Scientific Research Publishing Inc. This work is licensed under the Creative Commons Attribution International License (CC BY 4.0).
DOI: 10.4236/jwarp.2019.117053 867 Journal of Water Resource and Protection tively, in areas near urban development, stormwater run-off may contribute non-point-source pollutant contamination of New Mexico’s surface water resources. The most problematic areas in Bernalillo County are present in the Eastern and Northwestern portions. However, less than 1% of the total area lies within the lowest and highest vulnerability categories with the ma-jority centered around moderate vulnerability. The results of the model were compared with a previously published crisp AHP method. Both me-thods showed similar regional vulnerability trends. This MCDS/GIS ap-proach is intended to provide support to local governments and decision makers in selection of suitable structural or nonstructural stormwater con-trol measures.
Keywords
Stormwater Control Measures, Fuzzy Analytic Hierarchy Process (FAHP), Multi-Criteria Decision Support Systems, Geographic Information System, Watershed Vulnerability
1. Introduction
During precipitation events, water which is not absorbed into the ground flows over the ground surface eventually contributing to surface water features such as rivers and lakes. This phenomenon is called run-off and it is a major contributor of non-point source pollution, which can contaminate surface water features. Run-off can also cause erosion damage to property and infrastructure and in ex-treme cases, risk to human life. From May 1996 to December 2017, the National Climatic Data Center (NCDC) reported a total of 1292 flood/flash flood events caused by stormwater run-off with 32 deaths, 15 injuries, over $115 million in property damage, and over $5 million in crop damage [1]. Urban runoff is a major contributor to elevated levels of suspended sediments and of harmful pol-lutants in streams, lakes, rivers, and oceans. Common runoff polpol-lutants include nutrients, organic materials, pathogens, hydrocarbons, pesticides, metals, chlo-rides, grease, trash, and toxic substances [2]. These pollutants pose a serious threat to surface water quality and risk contamination of surrounding areas. Ad-ditionally, arid and semi-arid watersheds are especially vulnerable to run-off, due to infrequent but high-intensity episodic rainfall events which precipitate high volumes of water in a short period of time.
DOI: 10.4236/jwarp.2019.117053 868 Journal of Water Resource and Protection the identification of problem areas for stormwater run-off. These areas, if geo-graphically identified, may be evaluated for stormwater control measure (SCM) development. Structural and nonstructural SCMs are techniques, methods, ac-tivities, and practices that have the primary objective of controlling run-off vo-lume and preventing or reducing the quantity of pollutants present in runoff water before reaching natural water systems (Richardson et al. 2018). Imple-mentation of SCMs in strategic locations has the potential to prevent cata-strophic run-off events and present a solution for decreasing surface waterway contamination.
Successful implementation of SCM strategies should be based on the unique geographic characteristics, local requirements of each project, and wa-tershed-specific needs. Incorporating all of these potential decision making criteria for planning optimal SCM sites necessitates a system which allows for the comparison and prioritization of diverse criteria on a large scale. An ex-tensively used technique for improving SCM efficiency is incorporating multi-criteria decision support (MCDS) systems. MCDS involves the use of scientific and mathematical tools to evaluate complex trade-offs among different envi-ronmental and socioeconomic factors. Analytic hierarchy process (AHP) is one such commonly adopted MCDS technique. AHP is a measurement me-thod to derive a scale of relative importance of alternatives or criteria from pairwise comparisons [3]. AHP input can represent actual quantitative mea-surements or designations of subjective judgment. A more evolving concept is the integration of MCDS and geographic information system (GIS) processes into SCM suitability studies, which allows for the pinpointing of optimal loca-tions for SCM development.
An evaluation of watershed vulnerability in Bernalillo County, NM was per-formed by Amankwatia [4]. The research herein is based on this work, but uses fuzzy AHP (FAHP) to incorporate additional subjective judgment input regard-ing Bernalillo watershed processes. These subjective inputs were obtained from surveyed experts in the fields of geology and hydrology. Input from local experts was used to obtain a watershed vulnerability assessment of Bernalillo County comparable to the model produced in 2015.
DOI: 10.4236/jwarp.2019.117053 869 Journal of Water Resource and Protection
2. Stormwater Control Measures in the Desert Southwest
Despite widespread support of stormwater control measures (SCM) and projects in the United States, there has been little representation of such approaches in the desert Southwest [5]. The lack of implementation of SCMs in the Southwest is closely tied to the perception that these regions experience little or no rainfall and, hence, the expense and burden of SCMs seem unjustifiable. However, Gau-tam et al.[5] argue that one important reason for establishing SCM in desert en-virons is that limited, but high-intensity, episodic rainfall does occur. Such events can be a major contributing factor to the elevated levels of harmful pollu-tants found in natural watercourses. Precipitation in New Mexico is highly vari-able with some months exhibiting little to no precipitation and summer mon-soon storms bringing torrential downpours. These storms typical supply 50 per-cent of New Mexico’s annual precipitation during the months of July, August, and early September [6].In the semi-arid environment of New Mexico, stormwater is both an invalua-ble and limited resource. Limited availability of water resources and sustainabil-ity problems in this region actually intensify the need for the adoption of SCMs. Gautam et al.[5] suggested that given the rapid urbanization and severe water availability issues in the desert Southwest, the best strategy for implementing SCMs in such areas should be based on sustainable land use, water conservation, and water reuse techniques. The authors also stated that one critical SCM for long-term sustainability is through low-impact development by reducing imper-vious areas and limiting directly connected imperimper-vious surfaces.
MCDS Approach to Watershed Vulnerability and SCM Using AHP
and FAHP
DOI: 10.4236/jwarp.2019.117053 870 Journal of Water Resource and Protection with prioritization of decision criteria determined by a fuzzy analysis of expert knowledge of the study region. The purpose of using a weighted decision system is to provide a geographic framework for watershed vulnerability assessment, which is uniquely suited to the study watershed. This technique results in a vul-nerability map, which can inform SCM implementation predicated by expert knowledge of the interest area.
3. Factors Influencing Watershed Vulnerability
Watershed vulnerability, defined as high soil erosion and low infiltration poten-tial, is a complex process to model. Several watershed factors, such as slope gra-dient, soil texture, soil erodibility, soil permeability, land use and land cover, ve-getation cover, and drainage density, influence the development of the wa-tershed vulnerability model. The characteristics and effect of these factors on soil erosion and infiltration are outlined in this section.
3.1. Slope Gradient
Slope gradient (S), usually expressed as percent slope or degree slope, is used to represent the degree of variability in elevation and is found to strongly influence the velocity and direction of stormwater runoff. Generally, areas of watersheds with steeper slopes are characterized by high soil erosion susceptibility, whereas areas with mild or gentle slopes are suitable for infiltration and water harvesting practices. The SPA Digital Terrain Model (SPADTM) developed by the United States Army Corps of Engineers (USACE) Geospatial Center (~4.5 m resolution) was obtained with special permission from the New Mexico Department of Ge-ology and Mineral Resources and converted to slope gradient.
3.2. Soil Texture
Soil texture, defined as ratios of sand and clay, is known to have a strong influ-ence on the rate of infiltration and runoff potential of watersheds. The National Resources Conservation Service (NRCS) has identified four distinct soil groups (A, B, C, and D) based on their soil textures. Group A soils are generally com-prised of sand and gravel and have higher infiltration potential, whereas Group D soils have a high clay content and lower infiltration potential. Soil Survey Geographic Database (SSURGO) datasets are collected by National Cooperative Soil Survey, distributed by the United States Department of Agriculture (USDA). Hydraulic soil class dataset was downloaded from the USDA database and ac-cessed using Soil Data Viewer.
3.3. Soil Erodibility
DOI: 10.4236/jwarp.2019.117053 871 Journal of Water Resource and Protection low K values are highly stable compared with those with higher K values. K-factor values were obtained through SSURGO using Soil Data Viewer.
3.4. Vegetation Cover
The normalized difference vegetation index (NDVI) is a widely used standardi-zation parameter to represent vegetation cover. NDVI values typically range from 1.0 to −1.0 with non-vegetated areas such as streams and rivers producing small or slightly negative values, and vegetated areas producing values ranging from 0.4 to 1.0 [14]. Landsat 8 data was downloaded for the area covering Ber-nalillo County using Earth Explorer provided by the United States Geologic Survey (USGS). Data was collected from cloud-free fly-overs in June 2018. June represents the driest month of the year in New Mexico and conditions which would be present at the start of the annual monsoon season [6]. Landsat 8 data was converted to reflectance, corrected for sun angle, and NDVI was calculated from the red and near infrared data bands.
3.5. Soil Permeability
Soil permeability, or more correctly saturated hydraulic conductivity (Ksat), is an important physical soil property that refers to the ability of soils to conduct water. High Ksat values represent the portions of watersheds that are highly drained and are suitable for infiltration practices. Conversely, lower Ksat val-ues correspond to watershed regions that experience high runoff and are prone to soil erosion. Ksat values were obtained through SSURGO using Soil Data Viewer.
3.6. Land Use
Land use for purposes herein refers to the use of land for human activities. Land use directly translates to the amount of water penetration into soil layers or be-ing produced as runoff water. For example, rangeland or grassland will have dif-ferent infiltration or erosion potential than land which is used for industrial purposes. Land use data was downloaded from the USDA Geospatial Data Ga-teway and classified into risk categories.
3.7. Precipitation
DOI: 10.4236/jwarp.2019.117053 872 Journal of Water Resource and Protection engineering applications, such as the design of hydraulic structures such as cul-verts, roadway drainages, and bridges. PF estimate data were obtained from NOAA’s Hydrometeorological Design Studies Center—Precipitation Frequency Data Server (PFDS). This dataset consists of spatially distributed point PF esti-mates formatted as a georaster of the Southwestern United States. A high inten-sity, high volume storm is likely to pose a higher risk for erosion and storm wa-ter run-off. For this project, a precipitation depth for a 10-year, 6-hour storm was used to approximate precipitation for a severe monsoon storm, but alternate storm design frequencies could easily be substituted in the FAHP-GIS method.
3.8. Drainage Density
Drainage density is a quantitative indicator that represents the ratio of the total length of streams to the total watershed area. Low drainage density values are favorable for infiltration, whereas larger values indicate high runoff potential. High drainage density values are an indication of high soil erosion vulnerability, whereas lower values signify minor risk. The linear drainage file was down-loaded from USDA Geospatial Data Gateway and drainage density was deter-mined using the ArcMap line density function.
4. Site Description
This study was conducted using maps and digital data from Bernalillo County, New Mexico. The county is located in North Central New Mexico, centered at approximately longitude 106˚41'56.40''W and latitude 35˚3'14.4''N. Bernalillo County has a total area of approximately 3023 km2 (1167 mi2). Bernalillo County
is the most highly populated county in the State of New Mexico, and is home to the City of Albuquerque, its county seat. The region is covered by shrubs and scrubs (71%), deciduous, mixed, and evergreen forests (18%), associated urban (9%), and open water (1%). The two dominant soil orders are Entisols (47%) and Aridisols (32%) [2]. Albuquerque’s urban sprawl consisting of residential, commercial, military, and industrial land perpetuates a high risk of surface run-off events. Urban surface conditions result in contamination of surface wa-ter run-off, which poses risk nearby wawa-terways and nearby agricultural devel-opment. Limited water availability, unique soil characteristics, dominant shrub-land vegetation, and intricate climate, coupled with a forecasted 35% population growth over the next 20 years [15], makes Bernalillo County a suita-ble case study area for the current research.
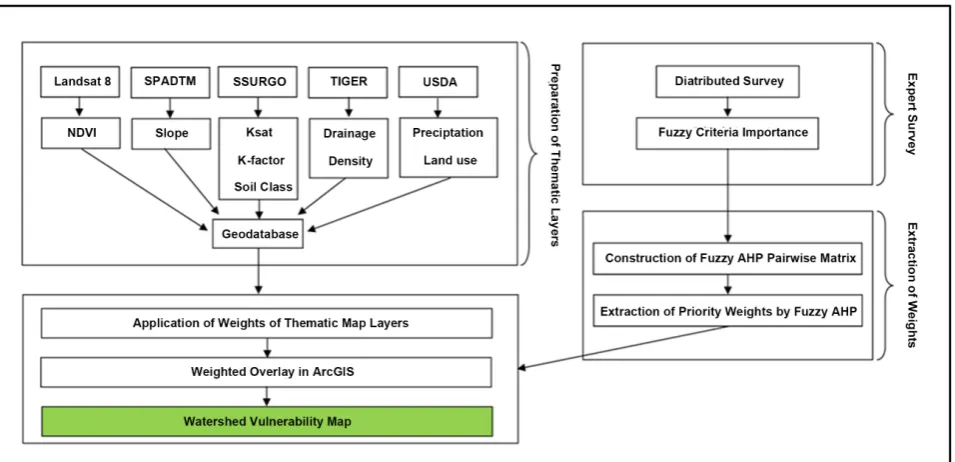
5. Modeling Approach
The overall modeling approach used for this project is based on Fuzzy AHP multicriteria decision making utilizing expert opinions collected by survey (Figure 1). The principal benefit of this method as an approach for evaluating watershed vulnerability is its ability to objectively and simultaneously consider an unlimited number of relative criteria.
DOI: 10.4236/jwarp.2019.117053 873 Journal of Water Resource and Protection Figure 1. Fuzzy AHP Model development.
One submodel assesses soil erosion potential and the other assesses infiltra-tion potential; each model incorporates multiple criteria. Coupled, these processes influence watershed vulnerability for stormwater run-off. The premise herein is that areas with high soil erosion potential and low infiltration potential are most vulnerable.
5.1. Soil Erosion Submodel
Soil erosion poses an imminent threat to infrastructure and property. As recent-ly as 2018, heavy monsoon rains in the area flooded homes, eroded dirt roads, blocked access to homes and businesses, and left thick blankets of sediment on agricultural crops. The City of Corrales, New Mexico in Sandoval County adja-cent to Bernalillo County saw up to three feet of silt and sand deposited in areas and extreme erosion in areas during the July 2013 floods [1]. The soil erosion submodel combines precipitation, soil erodibility, land slope, land use, and ve-getation cover.
5.2. Infiltration Submodel
Infiltration is the entry of water into the soil surface and its subsequent vertical motion through the soil profile. Areas which experience low soil infiltration will be more highly vulnerable for surface run-off events. The soil infiltration sub-model uses drainage density, hydrologic soil classification (HSC), land slope, land use, and saturated hydraulic conductivity as criteria to establish run-off po-tential.
6. Tools and Data Processing
implementa-DOI: 10.4236/jwarp.2019.117053 874 Journal of Water Resource and Protection tion of an AHP approach to assess watershed vulnerability. The following sec-tions summarize the tools and databases used for this research.
6.1. ArcGIS
ArcGIS is geographic information software system, which provides an exten-sive toolset to manage multiple layers of spatially-distributed geographic data. Modeling approaches based on GIS have been shown to be successful in as-sessing regional-scale soil erosion risks [16]. GIS-based models have also been extensively used in evaluating groundwater vulnerability in order to aid policy formulation. ArcGIS provides an infrastructure for making maps and working with large data sets of geographic and remotely sensed data. In this study, ArcMap was used for a range of geoprocessing tasks including spatial refe-rencing, resampling, mosaicking, clipping, reformation, and classifying geo-graphic data. ArcGIS’s raster calculator function was used to combine themat-ic data layers, creating erosion and infiltration models. Data analysis and deci-sion support tools were critical in creating custom watershed vulnerability maps.
6.2. Soil Data Viewer
The NRCS Soil Data Viewer is an ArcGIS extension for analyzing soil data and building soil-based thematic maps. The program enables map makers to in-terpret soil attributes and properties without having to deal with the complex-ity associated with querying and processing soil databases. Soil Data Viewer was used to create and export thematic layers such as soil texture, hydrologic soil groups, soil depth, and saturated hydraulic conductivity maps for the study area.
6.3. Data Processing
All layers were projected in ArcGIS to North American Datum (NAD) 1983 UTM zone 13 projection prior to assimilation into the model. A grid size of 30 × 30 (m) pixels was chosen for all spatial layers to cover the study area extent. All feature datasets were converted to raster format and all raster datasets were spatially resampled to 30 (m) resolution using the Data Management toolbox of ArcGIS. The Data Management toolbox was then used to clip the input thematic layers to conform to the spatial extent of the study area. In order to produce the soil data maps (including soil texture K-factor and Ksat), SSURGO data were loaded into Soil Data Viewer and individual layers were selected for export.
6.4. Expert Survey
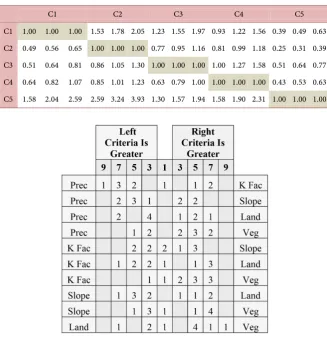
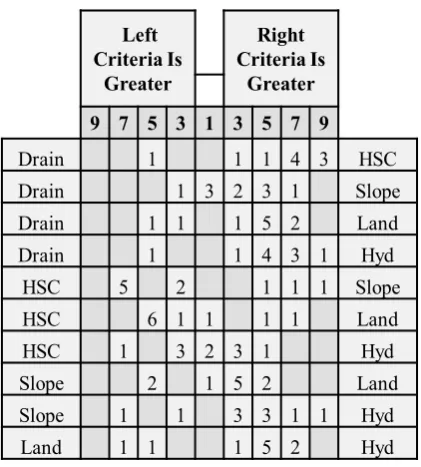
organ-DOI: 10.4236/jwarp.2019.117053 875 Journal of Water Resource and Protection izations familiar with watershed processes in Bernalillo County, New Mexico. These organizations included the New Mexico Institute of Mining and Technol-ogy, the New Mexico Bureau of Geology and Mineral Resources, and the United States Geologic Survey (USGS) in Albuquerque. Participants were provided with a description of each of the criteria used in developing the watershed vulnerabil-ity model. The survey was constructed in two parts. Part 1 asked participants to compare criteria influencing erosion and Part 2 compared criteria influencing infiltration. Participants compared each influencing criterion (A) to each other criterion (B) and evaluated whether (in their opinion) criterion A was equally as, slightly more, moderately more, strongly more, or absolutely more important than criterion B. Or conversely, participants indicated whether criterion B was equally as, slightly more, moderately more, strongly more, or absolutely more important than criterion A. In this distributed survey (soil erosion and infiltra-tion, respectively), each of the five influencing criteria is compared against each other criteria for the same phenomenon. Table 1 shows the relative scale of im-portance used for the respective pair-wise comparisons.
7. Development of Fuzzy AHP Model
7.1. Initial Comparison Matrix
Results from the criteria evaluation expert survey (10 participants) were used to construct an initial comparison matrix for each response as shown in Figure 2
and Figure 3.
Unlike “crisp” AHP, each comparison criteria is given as a set of possible val-ues or distribution. A triangular distribution was applied to the selected fuzzy numbers indicating importance. The triangular fuzzy number (TFN) is applied through a triangular membership function (μA) from 0 to 1 defined by three real numbers, expressed as a lower value, mean value, and an upper value (l, m, and u), where
( )
(
)
(
)
(
)
(
)
0, , , 0, A x l x ll x m m l
x
u x
m x u u m x u µ < − ≤ ≤ − = − ≤ ≤ −
>
(1)
DOI: 10.4236/jwarp.2019.117053 876 Journal of Water Resource and Protection Table 1. Fuzzy judgement for pair-wise comparisons.
Intensity of Importance Fuzzy Number Judgement Triangular Function 1 1* Equally As Important (1,1,1)
3 3* Slightly More Important (2,3,4)
5 5* Moderately More Important (4,5,6)
7 7* Strongly More Important (6,7,8)
[image:11.595.208.536.220.562.2]9 9* Absolutely More Important (8,9,10)
Table 2. Integrated fuzzified pair-wise comparison matrix for soil erosion.
C1 C2 C3 C4 C5
C1 1.00 1.00 1.00 1.53 1.78 2.05 1.23 1.55 1.97 0.93 1.22 1.56 0.39 0.49 0.63 C2 0.49 0.56 0.65 1.00 1.00 1.00 0.77 0.95 1.16 0.81 0.99 1.18 0.25 0.31 0.39 C3 0.51 0.64 0.81 0.86 1.05 1.30 1.00 1.00 1.00 1.00 1.27 1.58 0.51 0.64 0.77 C4 0.64 0.82 1.07 0.85 1.01 1.23 0.63 0.79 1.00 1.00 1.00 1.00 0.43 0.53 0.63 C5 1.58 2.04 2.59 2.59 3.24 3.93 1.30 1.57 1.94 1.58 1.90 2.31 1.00 1.00 1.00
Figure 2. Expert survey initial comparison matrix for soil erosion.
7.2. Consistency Evaluation
The principal behind using FAHP as a multicriteria decision making process (MCDS) relies on the consistency of input for the pairwise comparison matrix. In order to ensure that AHP judgments are accurate and reliable, a consistency ratio (CR) for each submodel was calculated according to method proposed by [18]
(
max n) (
1 n)
CR
RI
λ − −
DOI: 10.4236/jwarp.2019.117053 877 Journal of Water Resource and Protection Figure 3. Expert survey initial comparison for
infiltra-tion.
where n is the number of criteria in the comparison, λ max is the maximum Ei-genvalue, and RI is a random consistency index based on the number of criteria. The more consistent a comparison matrix is, the closer the value of computed maximum Eigenvalue (λmax) is to the number of criteria. Ideally, the consistency
ratio should be less than 10% for each submodel [19]. For both erosion and in-filtration the consistency ratio was found to be less than 0.02% or 2%. Because there are five comparison criteria for each submodel, the maximum Eigenvalue should approach a value of 5 for both. The calculated consistency ratios and maximum Eigenvalues for the erosion and infiltration sub models are CRerosion =
0.0161; λmax erosion= 5.07 and CRinfiltration = 0.0146; λmax infiltration = 5.06, respectively.
7.3. Defuzzification of Fuzzy Pair-Wise Comparison Matrix
Determining the crisp weight of each criteria from the integrated fuzzy compar-ison matrix uses the fuzzy extent analysis (FEA) method by Chang [20] with the Wang et al.[21] modification of the normalization process applied to calculate the values in the n x n fuzzy synthetic extent matrix (FSEM). The centroid me-thod was then used to calculate crisp criteria weights for each of the influencing criteria. The centroid method calculates the average for row i in the FSEM as (li +
mi + ui)/3, which are summed to give a total for n rows. Respective crisp criteria
weights (wi) are determined by dividing row i centroid average by the total.
8. Vulnerability Rating of Fuzzy AHP Model
A five-category rating system was used to classify vulnerability for this research. Each category is used to define a condition of vulnerability from “not vulnera-ble” to “extremely vulneravulnera-ble”. Vulnerability categorizations are as follows: 1)
Left Criteria Is
Greater
Right Criteria Is
Greater 9 7 5 3 1 3 5 7 9
Drain 1 1 1 4 3 HSC
Drain 1 3 2 3 1 Slope
Drain 1 1 1 5 2 Land
Drain 1 1 4 3 1 Hyd
HSC 5 2 1 1 1 Slope
HSC 6 1 1 1 1 Land
HSC 1 3 2 3 1 Hyd
Slope 2 1 5 2 Land
Slope 1 1 3 3 1 1 Hyd
DOI: 10.4236/jwarp.2019.117053 878 Journal of Water Resource and Protection Not Vulnerable; 2) Slightly Vulnerable; 3) Moderately Vulnerable; 4) Highly Vulnerable; and 5) Extremely Vulnerable.
Vulnerability Assessment
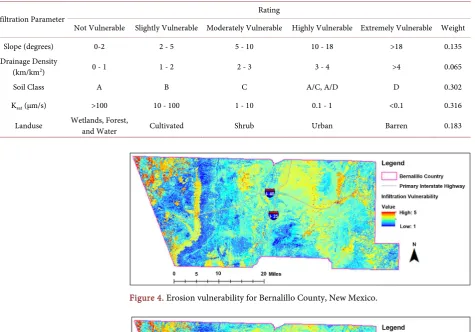
The next step is to assign vulnerability ratings for each criterion. Ranges were established to classify each criterion into risk categories for vulnerability. Rating categories were modeled after the works of Richardson and Amankwatia [2]. Categories were defined to reflect the level of vulnerability a criterion poses for stormwater run-off. For example, a slope of 0 - 2 degrees is considered not vul-nerable, 2 - 5 degrees is slightly vulvul-nerable, 5 - 10 degrees is moderately vulnera-ble, 10 - 18 degrees is highly vulnerable. and any slope greater than 18 degrees is extremely vulnerable. Each class is attributed to a value 1 - 5. All of the weight values for each submodel are scaled to add up to 1, such that after all the criteria are weighted and combined, the maximum vulnerability value remains on a scale from 1 to 5. Also note that land cover classifications “herbaceous”, “hay and pasture”, and “cultivated crops” were reclassified for this research as “culti-vated”. Criteria vulnerability ratings and the crisp weights derived from fuzzy AHP are presented in Table 3 and Table 4.
9. Results and Discussion
9.1. Evaluation of Watershed Vulnerability
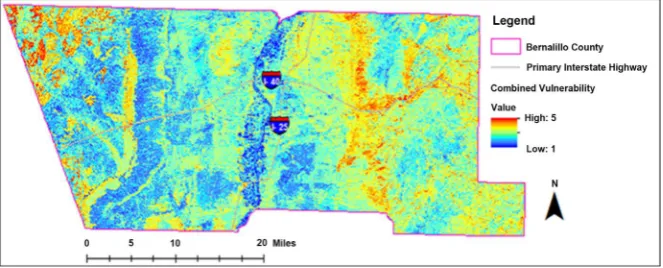
The weighted overlay of thematic map layers created a map of Bernalillo County, which indicates erosion vulnerability and infiltration vulnerability due to a storm event. The map of soil erosion potential for Bernalillo County is shown in Figure 4. Infiltration potential for Bernalillo County is shown in Figure 5. These two maps were combined to produce a map of overall watershed vulnerability for run-off related events. The scaled watershed vulnerability of Bernalillo County is given in Figure 6. Warm or red and orange-colored areas indicate re-gions of high vulnerability and cool-colored areas or blue and green areas indi-cate areas of lower vulnerability. For this study, the relationship of erosion and infiltration processes is combined with equal weighting to produce a map of combined vulnerability.
Weighting factors for each influencing parameter included in the study of erosion potential and infiltration potential are shown in Table 3 and Table 4, respectively. NDVI is a dominant criterion influencing soil erosion, followed by precipitation. Saturated hydraulic conductivity and soil texture are equally do-minant as influencing infiltration.
DOI: 10.4236/jwarp.2019.117053 879 Journal of Water Resource and Protection Table 3. Soil erosion criteria vulnerability rating.
Erosion Parameter Rating
Not Vulnerable Slightly Vulnerable Moderately Vulnerable Highly Vulnerable Extremely Vulnerable Weight
Slope (degrees) 0-2 2 - 5 5 - 10 10 - 18 >18 0.162
Precipitation
[image:14.595.67.543.250.582.2](inches) <1.4 1.4 - 1.5 1.5-1.6 1.6 - 1.7 >1.7 0.213 K-factor 0 - 0.1 0.1 - 0.2 0.2 - 0.3 0.3 - 0.4 >0.4 0.133 NDVI 0.8 - 1 0.6 - 0.8 0.6 - 0.4 0.4 - 0.2 <0.2 0.345 Landuse Wetlands, Forest, and Water Cultivated Shrub Urban Barren 0.147
Table 4. Infiltration criteria vulnerability rating.
Infiltration Parameter Rating
Not Vulnerable Slightly Vulnerable Moderately Vulnerable Highly Vulnerable Extremely Vulnerable Weight Slope (degrees) 0-2 2 - 5 5 - 10 10 - 18 >18 0.135 Drainage Density
(km/km2) 0 - 1 1 - 2 2 - 3 3 - 4 >4 0.065
Soil Class A B C A/C, A/D D 0.302
Ksat (μm/s) >100 10 - 100 1 - 10 0.1 - 1 <0.1 0.316
[image:14.595.198.541.567.705.2]Landuse Wetlands, Forest, and Water Cultivated Shrub Urban Barren 0.183
Figure 4. Erosion vulnerability for Bernalillo County, New Mexico.
DOI: 10.4236/jwarp.2019.117053 880 Journal of Water Resource and Protection Figure 6. Combined watershed vulnerability for Bernalillo County, New Mexico.
One benefit of working within a GIS platform is the potential for inclusion of areas of special interest in SCM implementation. As an example, infrastructure such as roadways may be added to a vulnerability map to identify target areas of importance for SCM development. Figure 7 shows watershed vulnerability for a section of eastern Bernalillo County with overlaid roadways, wherein there are a few neighborhoods and sections of highway which are designated as high vulne-rability areas. High vulnevulne-rability areas occurring at a great distance from target features may be designated as a low priority for SCM. In addition, specialized targets such as roadways, special properties, or contamination hotspots may be introduced to the model in order to assess which vulnerability areas are of the highest priority for development of SCM.
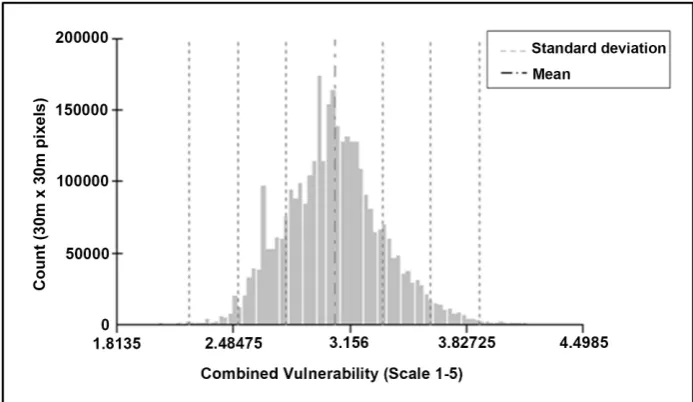
Most of the area of Bernalillo County represents moderate watershed vulnera-bility. The distribution of vulnerability values for the Bernalillo County area (in model pixels) is given in Figure 8. The mean vulnerability value of the model was determined to be 3.07 (on a scale of 1 to 5) with a standard deviation of 0.28. The majority of the pixels lie within two standard deviations of the mean. The distribution indicates that the “not vulnerable” and “extremely vulnerable” cat-egories do not represent a significant portion of total land area within Bernalillo County.
9.2. Advantages of Fuzzy AHP Model Approach
DOI: 10.4236/jwarp.2019.117053 881 Journal of Water Resource and Protection Figure 7. Roadway overlay on combined vulnerability map (zoomed-in view).
Figure 8. Scaled combined vulnerability value distribution.
the impact on the weighted priority results. If the rank order does not change, the results are said to be robust; otherwise, they are sensitive.
The FAHP approach presented herein offers several benefits in developing an understanding of regional-scale watershed vulnerability. The integration of FAHP and GIS techniques into watershed vulnerability studies for SCM suitabil-ity can be easily implemented in regions where precise spatial data are not rea-dily available without having to rely on expensive and time-consuming field surveys. Information from MCDS models can prove useful for large scale wa-tershed management and resource planning, narrowing down areas which can later be tested for SCM suitability.
10. Conclusions
[image:16.595.208.555.233.434.2]DOI: 10.4236/jwarp.2019.117053 882 Journal of Water Resource and Protection was generated for the Bernalillo County, New Mexico using an FAHP metho-dology based on judgements of experts on local watershed processes. The ap-proach incorporated drainage density, slope, precipitation, vegetative cover, land use, soil erodibility, soil texture, and soil permeability as the primary factors contributing to watershed vulnerability. The final map was produced by merging two submodels representing soil erosion and infiltration potential using the ArcGIS software. Analysis of the vulnerability map identifies that the most problematic areas are present in the Eastern and Northwestern portions of the study area. However, based on the analysis less than 1% of the total area lies within the lowest and highest vulnerability categories with the majority of land area centered around moderate vulnerability.
Results were compared with those using AHP derived weights from the Amankwatia (2015) effort. Both weighting methods showed similar regional vulnerability trends. The percentages associated with each vulnerability category were different, especially with the not vulnerable and extremely vulnerable cate-gories. The previous study showed approximately 4% of the total area was within the lowest and highest vulnerability classifications. This result is expected due to the differing weights (AHP versus FAHP) applied to each criterion. Further analysis is required to determine model sensitivity to each influencing criterion.
Fuzzy AHP is, therefore, an easily applied numerical method for evaluating criteria weights for MDCS systems. It allows for the quantitative evaluation of data from multiple, sometimes incomparable, sources by creating a system of numeric weights for a quantitative comparison and data incorporation. The method used in this process, couples two key hydrologic phenomena to assess watershed vulnerability (erosion and infiltration). The purpose of the applica-tion of this process is to identify vulnerable areas in need of implementaapplica-tion of stormwater management measures. FAHP relies on the experience of local ex-perts and allows for the inclusion of additional evaluation datasets (criteria) customizable to an area’s regionally specific watershed phenomena. This method produces site-specific vulnerability estimations that can be used for local discus-sions about individual risk. Information from the watershed vulnerability model can be useful for managing new structural or nonstructural SCM projects or im-proving existing ones to mitigate impact to stormwater contamination and run-off volume for identified vulnerable areas. Better prediction of problems al-lows for better planning and management of hazards, which contribute to wa-tershed vulnerability.
11. Recommendation for Future Work
DOI: 10.4236/jwarp.2019.117053 883 Journal of Water Resource and Protection Impacts of variation in spatial resolution of datasets should also be explored. While most datasets including SPADTM, SSURGO, Landsat 8, and USDA lan-duse data had a resolution of 30 (m) or less, the climate precipitation data was provided in an 800 (m) raster. This results in reduced spatial variation in the precipitation data when it is incorporated into the model and may impact inter-preted vulnerability by area. Amankwatia [4] used a 100 yr 24 hr precipitation depth criterion versus a 10 yr 6 hr precipitation depth criterion herein. NDVI data appropriate to the critical premonsoonal period should be extracted for multiple years and averaged to better address soil erosion potential. Amankwatia [4] based the NDVI criterion on an average annual maximum from 1995-2009, wherein this study used one premonsoonal month (June 2018). Additional ex-pert opinion could also be solicited for inclusion into the FAHP decision criteria weighting process.
Future studies should explore the relative weighting of erosion and infiltration submodels as they pertain to watershed vulnerability. For this study infiltration and erosion submodels were weighted with equal importance. Further research should be conducted to determine the respective influence of each submodel on watershed vulnerability.
In order to improve on the functionality and applicability of the model, other factors such as public awareness and economic indicators could be incorporated into the model. Integration of watershed vulnerability with infrastructure as-sessment and property maps can help to establish where implementation of SCM would be most critical. An example of this was provided with roadway overlays. Due to the large-scale nature of this data modeling process, it is feasible to ex-tend this study beyond the boundaries of Bernalillo County to model the State of New Mexico.
Acknowledgements
The high-resolution digital elevation data (SPADTM) was obtained with special permission from the New Mexico Department of Geology and Mineral Re-sources.
Conflicts of Interest
The authors declare no conflicts of interest regarding the publication of this pa-per.
References
[1] Blackwell, W. (2018) Mitigation. New Mexico State Hazard Mitigation Plan 2018. New Mexico Department of Homeland Security and Emergency Management (NM DHSEM). http://www.nmdhsem.org/Mitigation.aspx
[2] Richardson, C.P. and Amankwatia, K. (2018) GIS-Based Analytic Hierarchy Process Approach to Watershed Vulnerability in Bernalillo County, New Mexico. Journal of Hydrologic Engineering, 23, Article ID: 04018010.
DOI: 10.4236/jwarp.2019.117053 884 Journal of Water Resource and Protection
[3] Saaty, T.L. (1977) A Scaling Method for Priorities in Hierarchical Structures. Jour-nal of Mathematical Psychology, 15, 57-68.
https://doi.org/10.1016/0022-2496(77)90033-5
[4] Amankwatia, K. (2015) A GIS-Based Multi-Criteria Decision Support Approach to Stormwater Best Management Practices (SCMS): Identifying Potential SCM Vul-nerable Sites for Effective Water Conservation and Water Reuse in Bernalillo County, New Mexico. M.S. Thesis, New Mexico Institute of Mining and Technolo-gy, Socorro.
[5] Gautam, M.R., Acharya, K. and Stone, M. (2010) Best Management Practices for Stormwater Management in the Desert Southwest. Journal of Contemporary Water Research & Education, 146, 39-49.
https://doi.org/10.1111/j.1936-704X.2010.00390.x
[6] NOAA (2018) North American Monsoon Highlights.
https://www.weather.gov/abq/northamericanmonsoon-intro
[7] Young, K.D., Tamim, Y., Randel, D.L., David, K.F. and David, L.H. (2010) Applica-tion of the Analytic Hierarchy Process for Selecting and Modeling Stormwater Best Management Practices. Journal of Contemporary Water Research & Education, 146, 50-63.https://doi.org/10.1111/j.1936-704X.2010.00391.x
[8] Fernandez, D. and Lutz, M. (2010) Urban Flood Hazard Zoning in Tucumán Prov-ince, Argentina, Using GIS and Multicriteria Decision Analysis. Engineering Geol-ogy, 111, 90-98.
[9] Wang, Y., Li, Z., Tang, Z. and Zeng, G. (2011) A GIS-Based Spatial Multi-Criteria Approach for Flood Risk Assessment in the Dongting Lake Region, Hunan, Central China. Water Resource Management, 25, 3465-3484.
https://doi.org/10.1007/s11269-011-9866-2
[10] Agarwal, E., Agarwal, R., Garg, R. and Garg, P. (2013) Delineation of Groundwater Potential Zone: An AHP/ANP Approach. Journal of Earth System Science, 122, 887-898.https://doi.org/10.1007/s12040-013-0309-8
[11] Al-Abadi, A. and Al-Shamma’a, A. (2014) Groundwater Potential Mapping of the Major Aquifer in Northeastern Missan Governorate, South of Iraq by Using Ana-lytical Hierarchy Process and GIS. Journal of Environment and Earth Science, 4, 125-149.
[12] Nasiri, M. (2013) GIS Modelling for Locating the Risk Zone of Soil Erosion in De-ciduous Forest. Journal of Forest Science, 59, 87-91.
https://doi.org/10.17221/71/2012-JFS
[13] Kachouri, S., Achour, H., Abida, H. and Bouaziz, S. (2014) Soil Erosion Hazard Mapping Using Analytic Hierarchy Process and Logistic Regression: A Case Study of Haffouz Watershed, Central Tunisia. Arabian Journal of Geosciences, 8, 4257-4268.https://doi.org/10.1007/s12517-014-1464-1
[14] Bulut, G., Cal, M., Richardson, C. and Gallegos, J. (2012) A GIS-Based Soil Erosion Risk Map for New Mexico. World Environmental and Water Resources Congress, Reston, May 2012, 3754-3763.https://doi.org/10.1061/9780784412312.377
[15] Richardson, C.P. and Amankwatia, K. (2019) Assessing Watershed Vulnerability in Bernalillo County, New Mexico Using GIS-Based Fuzzy Inference. Journal of Water Resource and Protection, 11, 99-121.https://doi.org/10.4236/jwarp.2019.112007
[16] Mitra, B., Scott, H., Dixon, J. and McKimmey, J. (1998) Applications of Fuzzy Logic to the Prediction of Soil Erosion in a Large Watershed. Geoderma, 86, 183-209. https://doi.org/10.1016/S0016-7061(98)00050-0
Priori-DOI: 10.4236/jwarp.2019.117053 885 Journal of Water Resource and Protection
ties with the Analytic Hierarchy Process. European Journal of Operational Re-search, 108, 165-169.https://doi.org/10.1016/S0377-2217(97)00244-0
[18] Krois, J. and Schulte, A. (2014) GIS-Based Multi-Criteria Evaluation to Identify Po-tential Sites for Soil and Water Conservation Techniques in the Ronquillo Wa-tershed, Northern Peru. Applied Geography, 51, 131-142.
https://doi.org/10.1016/j.apgeog.2014.04.006
[19] Saaty, T.L. (1980) The Analytic Hierarchy Process. McGraw-Hill, New York. [20] Chang, D. (1996) Applications of the Extent Analysis Method on Fuzzy AHP.
Eu-ropean Journal of Operational Research, 95, 649-655. https://doi.org/10.1016/0377-2217(95)00300-2
[21] Wang, Y.M., Elhag, T.M.S. and Hua, Z.S. (2006) A Modified Fuzzy Logarithmic Least Squares Method for Fuzzy Analytic Hierarchy Process. Fuzzy Sets and Sys-tems, 157, 3055-3071.https://doi.org/10.1016/j.fss.2006.08.010