Safe Drive Stay Alive: exploring effectiveness of a real-world driving intervention for pre-drivers and the utility of the Health Action Process Approach
H. Dale NHS Fife Department of Psychology, Lynebank Hospital, Halbeath Road, Dunfermline, Fife, KY11 4UW, UK & University of St Andrews Medical School North Hague, St Andrews, Fife, KY16 9TF, UK
C. Scott University of Aberdeen, Health Psychology, 2nd Floor, Health Sciences Building, University of Aberdeen, Foresterhill, Aberdeen
AB25 2ZD
G. Ozakinci University of St Andrews Medical School North Hague, St Andrews, Fife, KY16 9TF, UK
Corresponding author: Hannah Dale, NHS Fife Department of Psychology, Lynebank Hospital, Halbeath Road, Dunfermline, Fife, KY11 4UW. [email protected] tel: +441334 696336 (no fax number available)
Keywords: attitudes, behaviour, psychological, youth, process/impact evaluation, motor vehicle
Word count: 1463
What is already known on this subject:
Preventative interventions for pre-drivers are often ineffective
Psychological theories can help explain behaviour and are used to evaluate
interventions
Safe Drive Stay Alive has been shown to influence only some psychological
determinants of behaviour as measured by the Theory of Planned Behaviour
What this study adds:
The Health Action Process Approach explains a significant amount of variance in driving intentions tested in a ‘real-world’ setting
Using theories and determinants in addition to the theory of planned
behaviour may expand our understanding of driving behaviour
Atheoretical preventative interventions that rely on persuasion, information
ABSTRACT
INTRODUCTION
Road traffic Collisions (RTCs) are the leading cause of death among young drivers, primarily as a result of risky driving.[1] Factors of influence include driving
environment, demographics, personality factors, driving ability, and psychological predictors such as beliefs, attitudes, and perceived susceptibility.[2,3] Psychological theory has been used to understand driving behaviour, most frequently the Theory of Planned Behaviour (TPB), which can explain up to 53% of variance in intention to speed and 40% of variance in speeding behaviour.[4]
Interventions to change determinants of driving behaviour include: multi-media campaigns;[5] speed camera interventions;[6] driver training programs.[7] These have all been found to influence driving behaviour or determinants of behaviour, however, they lack long-term follow-ups or effects diminish over time. A minority of interventions, which tend to involve smaller group work and discussion, show sustained results.[8]
Safe Drive Stay Alive (SDSA) is a driving intervention implemented in a range of areas in the UK, including Fife, Scotland, where it has been running yearly since 2002.[9] SDSA is intended to deliver thought provoking messages to young people, who are predominantly pre-drivers, or learning to drive, through a video
months later.[10, 11] Despite this, SDSA continues to be delivered in many areas of the UK, possibly due, in part, to a lack of awareness of the evidence, and due to its perceived face validity by organisers, funders, pupils and teachers.
since research in other behaviour areas has found it to be more predictive of behavioural intention than the TPB.[13]
We did not have any input into the development nor running of the intervention and no information on how theory or evidence may or may not have been used in its development was available. To explore and therefore better specify the ‘active
ingredients’ of the content of the intervention, our third aim is to code the intervention for behaviour change techniques (BCTs).Therefore, although detailed information about the intervention was not specified, this process brings more detail to the intervention content.
METHOD
Participants and Recruitment
The target participants for the evaluation were 16-18 year olds from schools and colleges in Fife, Scotland who attended the SDSA intervention in November 2011. All young people ages 16-18 in the county who were engaged in education at the time of the intervention were invited to attend, and classes were stopped for that period to allow for pupils and students to be transported to the venue, as part of their curriculum for that day. This represents around 4398 students, who were invited. Although exact numbers attending the intervention were not recorded by the organising committee, it is understood that the majority attended based on the theatre being near capacity for all performances. The aim for recruitment was at least 84 participants, based on a power calculation (4 variables in regression
before the intervention and 3 months after (timings for the evaluation were pre-determined by the SDSA Organising Committee). This was done using postcards with a web link to the evaluation and posters, which were distributed in schools and colleges to all young people due to attend the intervention. Follow-up participants were also recruited through email if they had participated at baseline. A prize draw, for driving-related gifts, was offered as an incentive. Pupils from all schools took part in the evaluation. Participants were matched by email address. Ethical approval was granted from the University of St Andrews.
Materials
The questionnaire was conducted online using Survey Monkey and included demographic questions (sex, age, and domicile postcode) and psychological determinants of driving behaviour (self-efficacy, outcome expectancies, risk
perception, and intention), assessed using the following scenario based on previous driving research: ‘You are driving a car down a country road with a few friends as passengers. It’s about 4 o’clock on a fine, dry afternoon. You can’t see any other cars. There are some bends in the road. The speed limit is 60 miles per hour.’[14]. This scenario was adapted to fit the video shown in SDSA and was done to make the scenario relatable and to create a perspective for non-drivers. Self-efficacy, outcome expectancies, risk perception, and intention HAPA variables were
specifically assessed around speed and slowing down for bends or other changes in the road. For example, ‘If I drive below 60 miles per hour, I will be able to respond to
risks better so have less chance of an accident.’ with answer choices on a 5-point
BCT taxonomy V1.[15] This was rated by two authors. Any discrepancies were discussed and agreed upon.
Analysis
Data were analysed using a combination of parametric and non-parametric tests. Data had skewness, predominantly due to ceiling effects, and z-scores were higher than the acceptable level. The non-normality of data was slightly less pronounced for the larger baseline sample, therefore, multiple regressions proceeded as planned for this element of analysis.
RESULTS
538 (12%) young people completed at least one part of the evaluation. We were able to match responses (using their email address) from 87 participants who completed both the baseline and follow-up evaluation (56% female; mean age = 16.98 years). Of these, the majority had never driven a car (N=75). There were no significant differences on any demographic factors (e.g. sex, driving status) or psychological determinants (e.g. self-efficacy, risk perception) at baseline between the 87 matched participants and the remaining 278 participants who took part in baseline only.
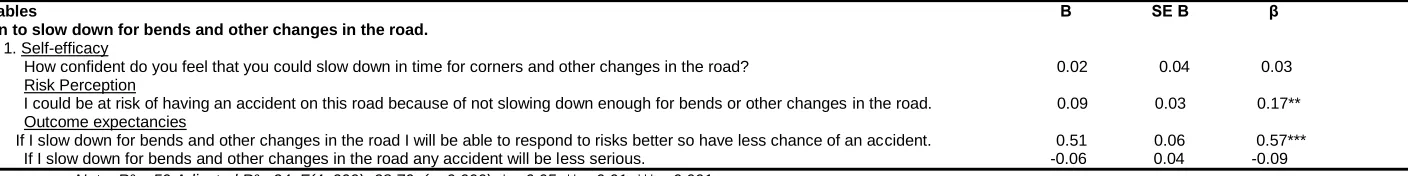
one of the outcome expectancy variables, followed by risk perception and self-efficacy. For intention to slow down for bends and other changes in the road (Table 3), the total variance explained by the motivational variables within the HAPA model as a whole was 59%, F(4,299)=38.70, p < 0.001, with the most variance again explained by one of the outcome expectancy variables, along with risk perception. This suggests that the motivational variables within HAPA model have utility in explaining driving intentions in this group.
<Insert Table 1 around here>
<Insert Table 2 around here>
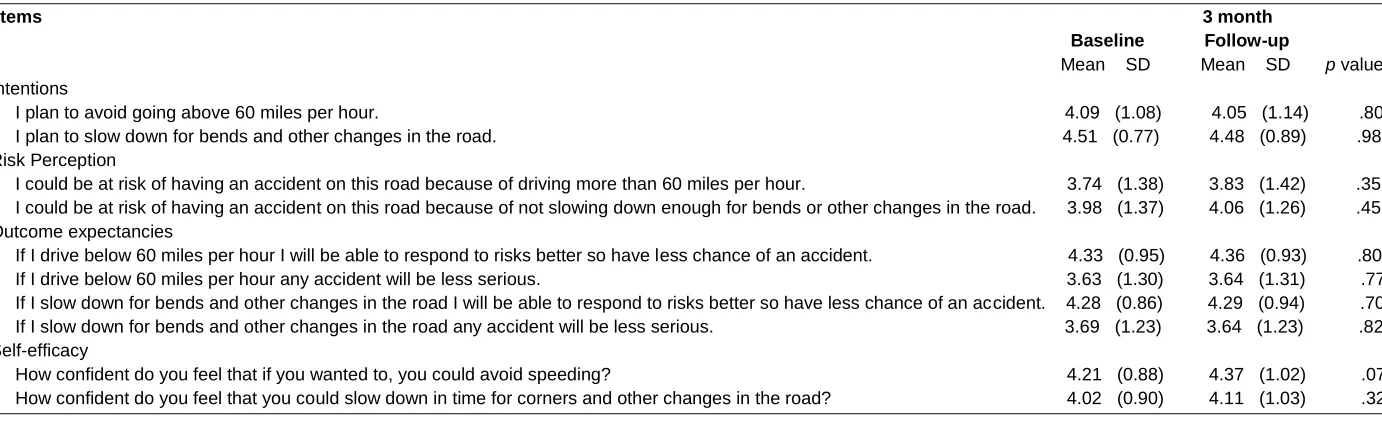
Wilcoxon Signed Ranks tests examining the effect of the intervention on driving intentions, risk perception, outcome expectancies and self-efficacy between baseline and follow-up were all non-significant (N=87; Table 1; aim two).
<Insert Table 3 around here>
Behaviour Change Techniques Taxonomy
A total of seven techniques were identified in the intervention video through coding the visual and audio messages given (aim three). These were ‘future punishment’,
‘persuasive source’, ‘salience of consequences’, ‘information about social and
environmental consequences’, ‘information about health consequences’, ‘information
DISCUSSION
The hierarchical regression analyses showed that the motivational HAPA variables explained more of the variance in intention to slow down for bends and changes in the road (59%) than speeding (47%). It was also found that one of the outcome expectancy variables was the strongest consistent predictor, followed by risk perception, then self-efficacy. This shows that the motivational determinants within the HAPA model can successfully predict driving intentions. However, there are other factors that the HAPA model does not specifically account for such as attitude and social cues, suggesting that interventions for different risky driving behaviours may need to target additional determinants to effect change.
Overall, there was no significant effect of the SDSA intervention on psychological determinants of driving behaviour from the motivational phase of the HAPA model at 3-month follow-up. The findings are in line with previous research, including a
previous SDSA evaluation, which found little or no effect of driving interventions in this predominantly pre-driving intervention.[5,11] Given that driving attitudes become riskier with driver training and experience, for a driving intervention to impact upon road traffic collisions, the intervention would need to be effective beyond 3
themselves from fear appeals.[5,17] The SDSA intervention may benefit from using less threatening messages, and possibly the use of humour.
The seven BCTs used in the intervention were all negatively framed, and provide more specificity to the intervention content than has previously been reported. It may be that using fewer negative consequences and framing parts of the intervention in a more positive way may have greater long-term effects.[17] Social norms marketing (which uses commercial marketing techniques to influence and change perceived social norms, for example towards perceiving that people do not speed) has been suggested as a useful tool in driving interventions and has successfully changed related behaviours.[18] Further, behavioural techniques and strategies may be
needed within an intervention, as suggested by the volitional phase of the HAPA. For example, implementation intentions has been found to be effective in increasing compliance with speed limits.[19]
have a self-selection bias, however, power was achieved for the sample. This also ties into problems of reach, with a low proportion of intervention participants taking part in the evaluation – another possible source of bias. Since the current study did not collect data immediately post-intervention it is unknown whether there was an initial effect that wore off by the follow-up. Never-the-less, for a driving intervention to impact upon road traffic accidents, especially one that targets young people
predominantly without any driving experience, the intervention would need to be effective in the long-term. Therefore, the lack of effect at 3-months is of importance. Further research utilising the motivational variables, within the HAPA, as well as the HAPA model on the whole may be warranted. It may also be timely to re-appraise SDSA and explore the use of theory as well as the evidence base and BCTs in modifying the intervention to increase effectiveness. Future research exploring the effectiveness of driving interventions in this population should aim to include longer term follow-ups to assess the impact on behaviour.
CONCLUSIONS
The motivational variables within the HAPA model has been found to be highly successful in predicting driving intentions and may offer an additional tool in
developing and evaluating interventions. Overall the current study was unable to find any main effects of the SDSA intervention. Therefore, interventions may in particular need to consider additional input to improve outcomes of interventions delivered in ‘real-world’ settings; evidence-based BCTs offer a way to inform these interventions.
Thanks go to all participants who took part in the evaluation, to Fife Community Safety Partnership Group and in particular the Fife Fire and Rescue Service for their support and facilitation in carrying out the evaluation, and the Safe Drive Stay Alive Organising Committee who gave their help and support in the evaluation.
REFERENCES
1 Toroyan T, Peden MM. Youth and Road Safety. Switzerland: World Health Organization 2007.
2 Department for Transport. The Conditions for Inappropriate High Speed: A Review of the Research Literature from 1995 to 2006. London: Department for Transport 2008.
3 Fernandes R, Hatfield J, Soames Job RF. A systematic investigation of the differential predictors for speeding, drink-driving, driving while fatigued, and not wearing a seat belt, among young drivers. Transp Res Part F 2010;13:179-196. 4 Stead M, Tagg S, MacKintosh AM, et al. Development and evaluation of a mass media Theory of Planned Behaviour intervention to reduce speeding. Health Educ Res 2005;20:36-50.
5 Whittam KP, Dwyer WO, Simpson PW, et al. Effectiveness of a Media Campaign to Reduce Traffic Crashes Involving Young Drivers. J Appl Soc Psychol
2006;36:614-628.
7 Lenné MG, Liu CC, Salmon PM, et al. Minimising risks and distractions for young drivers and their passengers: An evaluation of a novel driver-passenger training program. Transp Res Part F 2011;14:447-455.
8 King KA, Vidourek RA, Love J, et al. Teaching adolescents safe driving and passenger behaviors: Effectiveness of the You Hold the Key Teen Driving Countermeasure. J Safety Res 2008;39:19-24.
9 Scottish Community Safety Network. Safe Drive Stay Alive Fife. Edinburgh, 2013. Available at:
http://www.safercommunitiesscotland.org/publications/safe-drive-stay-alive.doc (date accessed 29/07/15)
10 Poulter DR, McKenna FR. Evaluating the effectiveness of a road safety education intervention for pre-drivers: An application of the theory of planned behaviour. BrJ Educ Psychol 2010;80:163- 181.
11 Symons D, Low R, Pugh G, et al. An evaluation of the Safe Drive Stay Alive (SDSA) road safety presentation for predrivers. London: London Road Safety Unit, 2008.
12 Schwarzer, R. (1992). Self-efficacy in the adoption and maintenance of health behaviors: Theoretical approaches and a new model. Hemisphere., Washington DC 13 Orbell S, Lidierth P, Henderson CJ, et al. Social–cognitive beliefs, alcohol, and tobacco use: A prospective community study of change following a ban on smoking in public places. Health Psychol 2009;28:753-761.
14 Parker D, Manstead ASR, Stradling SG, Reason JT, Baxter JS. Intention to commit driving violations: An application of the theory of planned behaviour. J Appl Psychol 1992;77;94-101.15 Michie S, Richardson M, Johnston M, et al. The
building an international concensus for the reporting of behaviour change interventions. Ann Behav Med 2013. doi: 10.1007/s12160-013-9486-6.
16 Rowe R, Maughan B, Gregory AM, et al. The development of risky attitudes from pre-driving to fully-qualified driving. Inj Prev 2013;19:244-249.
17 Lewis I, Watson B, White KM. An examination of message-relevant affect in road safety messages: Should road safety advertisements aim to make us feel good or bad? Transp Res Part F 2008;11:403-417.
18 Perkins HW, Linkenbach JW, Lewis MA, et al. Effectiveness of social norms media marketing in reducing drinking and driving: A statewide campaign. Addict Behav 2010;35:866-874.
19 Elliott MA, Armitage C. Effects of implementation intentions on the self-reported frequency of drivers’ compliance with speed limits. J Exp Psychol Appl 2006;12:108-117.
Table 1. Hierarchical regression summary for intention to avoid going above 60mph at baseline (N=289).
Note: R² =.47 Adjusted R²=.22, F(4, 289)=20.57, (p=0.000). *p<0.05, **p<0.01, ***p<0.001
Variables B SE B β I plan to avoid going above 60 miles per hour.
Step 1. Self-efficacy
How confident do you feel that if you wanted to, you could avoid speeding? 0.17 0.06 0.15** Risk Perception
I could be at risk of having an accident on this road because of driving more than 60 miles per hour. 0.15 0.05 0.17** Outcome expectancies
Table 2. Hierarchical regression summary for intention to slow down for bends and other changes in the road at baseline (N-299).
Note: R² =.59 Adjusted R²=.34, F(4, 299)=38.70, (p=0.000). *p<0.05, **p<0.01, ***p<0.001
Variables B SE B β I plan to slow down for bends and other changes in the road.
Step 1. Self-efficacy
How confident do you feel that you could slow down in time for corners and other changes in the road? 0.02 0.04 0.03 Risk Perception
I could be at risk of having an accident on this road because of not slowing down enough for bends or other changes in the road. 0.09 0.03 0.17** Outcome expectancies
Table 3. showing the descriptive statistics for intention and determinants of intention at baseline and follow up and statistical test values for the
difference between these scores from baseline to follow-up (N=87).
Items 3 month Baseline Follow-up
Mean SD Mean SD p value Intentions
I plan to avoid going above 60 miles per hour. 4.09 (1.08) 4.05 (1.14) .80
I plan to slow down for bends and other changes in the road. 4.51 (0.77) 4.48 (0.89) .98
Risk Perception I could be at risk of having an accident on this road because of driving more than 60 miles per hour. 3.74 (1.38) 3.83 (1.42) .35
I could be at risk of having an accident on this road because of not slowing down enough for bends or other changes in the road. 3.98 (1.37) 4.06 (1.26) .45
Outcome expectancies If I drive below 60 miles per hour I will be able to respond to risks better so have less chance of an accident. 4.33 (0.95) 4.36 (0.93) .80
If I drive below 60 miles per hour any accident will be less serious. 3.63 (1.30) 3.64 (1.31) .77
If I slow down for bends and other changes in the road I will be able to respond to risks better so have less chance of an accident. 4.28 (0.86) 4.29 (0.94) .70
If I slow down for bends and other changes in the road any accident will be less serious. 3.69 (1.23) 3.64 (1.23) .82
Self-efficacy How confident do you feel that if you wanted to, you could avoid speeding? 4.21 (0.88) 4.37 (1.02) .07
Table 4 showing the behaviour change techniques (BCTs) used in SDSA
BCT Definition Examples
59. Future Punishment Inform that future punishment or removal of reward will be a consequence Presentation of what would happen if they do of performance of an unwanted behaviour (may include fear arousal) (includes not drive safely. “They can and will happen to you
‘Threat’). unless...”.
72. Persuasive Source Present verbal or visual communication from a credible source in favour of or Testimonies by Police, Fire Brigade,
against the behaviour. against the behaviour.
78. Information about Provide information about social and environmental consequences of performing Damage to cars, life in a wheelchair, loss
social and environmental the behaviour. of friends or family.
consequences
79. Information about health Provide information about health consequences of performing the behaviour. Depiction of death and injury.
consequences
80. Information about Provide information about emotional consequences of performing the behaviour. Emotional impact of families of victims
emotional consequences and guilt of driver.
81. Salience of Use methods to emphasise (make more memorable) the consequences of changing Vivid reconstruction on screen.
consequences the behaviour (goes beyond informing about consequences).
84. Information about Provide information about what other people think about the behaviour. The Driver says “Faster doesn’t mean better”.
others’ approval Information clarifies whether others will like, approve or disapprove of what the