JOURNAL OF FOREST SCIENCE, 62, 2016 (5): 191–197
doi: 10.17221/48/2015-JFS
Application of the Economic Value Added index
in the performance evaluation of forest enterprise
E. Balážová
1, J. Luptáková
21Department of Economics and Management of Forestry, Faculty of Forestry, Technical University in Zvolen, Zvolen, Slovak Republic
2Institute of Foreign Languages, Technical University in Zvolen, Zvolen, Slovak Republic
ABSTRACT: The paper aims at pointing to possibilities of using the Economic Value Added index in evaluating the
forest enterprise performance. The given index ranks among the indices of fourth-generation evaluation emerging from the value-based management theory. When calculating the index, we took the financial statements of a chosen forest enterprise for our starting point. On the basis of the calculated results we can state that the index development in the enterprise had an increasing tendency during the period 2011–2013. Recognised values of the index were posi-tive, i.e. the enterprise reached a positive market value for the enterprise owners.
Keywords: cost of capital; net present value
Modern conceptions of measuring enterprise performance emphasize a need of not only finan-cial but also non-finanfinan-cial measures. They enable to make a dynamic picture of the competitive posi-tion of an enterprise in the market and help inter-link short-term performance with a long-term stra-tegic vision of the enterprise. Despite the intensive popularization of the non-financial indicators, the financial indicators remain irreplaceable. They re-flect past actions, provide a retrospective view on the competitive position of an enterprise and they are able to forecast the short-term development of an enterprise relatively precisely.
Nowadays, with traditional indicators of measur-ing the enterprise performance, the emphasis is being laid on modern indicators based on the en-terprise value-based management theory. To face keen competition, it is important to measure and evaluate the enterprise performance responsibly. The enterprise has to have at its disposal a set of financial and non-financial measures characteriz-ing its performance as accurately as possible. “Gen-erally, performance means the characteristic that
describes a way or course in which an examined business entity performs an activity on the basis of a similarity to the reference way of performing this activity. An interpretation of the characteristic pre-supposes an ability to compare the examined and reference phenomena from the standpoint of the set criteria” (Wagner 2009).
For the most part, the concept of performance is defined as the capability of a company (business entity) to evaluate investments in its business ac-tivities as well as possible. This definition leads to a view that a company is efficient if it reports good earnings. With regard to the given definition this conception seems to be incomplete. Furthermore, enterprise performance is evaluated by subjects performing in a market from different standpoints. According to the customer, a company is efficient if it is able to anticipate their needs and wishes at the moment when they arise and at the same time to offer them a quality product at a price correspond-ing to their image of how much they are willcorrespond-ing to pay for satisfying their needs. According to the cus-tomer conception, measures for this capability are
the following categories: price, delivery time, and quality. From the manager’s viewpoint, a company is highly efficient when it prospers, has a stable market share, loyal orders, low cost, balanced cash flows, and its economy is liquid and profitable. The entrepreneurial conception offers an increase in company competitiveness. A measure of this capability is the speed of response to the changes in macroeconomics and to arising new business opportunities. From the viewpoint of owners, the company performance presents the appreciation of capital they contributed to the company. Accord-ing to their opinion, a company is efficient when it is able to appreciate capital to the highest possible degree and within a period as short as possible. The capability to succeed is evaluated by measures re-sulting from the categories: return on investment, Economic Value Added (EVA), and enterprise val-ue (share valval-ue).
In the 1990s of the 20th century, the EVA became
the conception which spread out from the theoreti-cal level also to practice. The given fact was influ-enced by publishing the book “The Quest for Value” written by Bennet Stewart (Stewart 1991, 2013; Holečková 2008). Applying the EVA in company practice and exploring the relationship between the EVA and increase in the yield on shares were dealt with by several authors (Maditinos et al. 2006).
Performance is a relatively wide concept. It cov-ers both financial and non-financial measures which create a dynamic image of enterprise com-petitiveness and at the same time disclose pos-sibilities for further increase in its performance. Enterprise performance understood in both finan-cial and non-finanfinan-cial perspectives is conditioned by successfully carried out development activities (Šulák, Vacík 2005). The evaluation and analysis of performance, economic and financial efficiency of the forest enterprise were dealt with by several authors (Kovalčík 2007, 2011; Hajdúchová et al. 2011; Balážová 2014).
METHODS
The aim of the contribution is to point to a pos-sibility of applying the EVA index in evaluating the performance of a chosen forest enterprise, to de-scribe the procedure of the calculation and then to compare developments of the EVA index during a set period of time.
The input data and information were obtained from the internal materials of the forest enterprise which is an organisational part of the state-owned
enterprise Forests of the Slovak Republic Banská Bystrica. The branch is found in the south-west-ern part of Banská Bystrica region. The territory of the branch is situated in the regions of Banská Bystrica, Nitra, Trenčín, it reaches the districts of Žarnovica, Žiar nad Hronom, Prievidza, Zlaté Moravce, Levice, Banská Štiavnica, Zvolen and it comprises 79 cadastral territories. Its area is 105,689 ha and the forest land area managed by the enterprise is 36,563 ha. Concerning the spe-cies composition, beech and mixed oak-beech stands preponderate. The overall broadleaves rep-resentation is 75% with the beech share of more than 46%. Coniferous species are represented es-pecially by spruce growing at higher locations, fir and larch, and by pine in southern and dry sites. The main activities of the enterprise include sil-vicultural and logging operations, wood-process-ing, and wood trade.
In the contribution, the EVA index is calculated by means of the cost of capital. The EVA prefers eco-nomic profit, i.e. profit made up by the difference between capital gains and the economic cost (oper-ating cost) that is the cost including also so-called opportunity cost besides accounting cost. The differ-ence between traditional accounting profit and eco-nomic profit results from the following comparison:
accounting profit = revenues – accounting costs economic (operating) profit = total capital gain –
– cost of capital Accounting profit and operating profit differ from one another because of the following rea-sons: the accounting profit does not take into con-sideration the time value of money and risk. The accounting profit does not take into consideration the explicit costs resulting from the use of equity capital. The operating profit as a newly created value arises only when its value exceeds the value of profit derived from average capital costs exert-ed by crexert-editors (i.e. costs in the form of interests) and from costs spent by owners and shareholders (i.e. opportunity costs).
The positive evaluation of enterprise perfor-mance is if the EVA > 0. That means that the capital gain is higher than its value and then the enterprise “creates” a value for its owners. If the EVA < 0, the revenue is lower than the cost, the enterprise “de-stroys” the value.
NPV = –I + PV (1)
where:
NPV – net present value,
I – investment,
PV – present value.
To calculate the present value of a share, equation 2 is applied (Stehlíková 2002; Eq. 2):
PV = (EPS/re) + PVGO (2)
where:
EPS – net earnings per share,
re – cost of equity capital,
PVGO – present value of share growth opportunities.
The final equation after adjustment (Eq. 3): NPV1 = (((ROE – re) × VK)/re) + PVGOe (3)
where:
NPV1 – net present value of all shares, i.e. net present value of equity capital,
ROE – profitability of equity capital,
E – equity capital,
PVGOe – present value of growth opportunities for
equity capital.
First we can calculate the EVA by means of the for-mula for the cost of capital (Eq. 2). The EVA index is understood as net earnings of operational (econom-ic) activity of an enterprise less the cost of capital.
The basic calculation of Economic Value Added (EVA) (Eq. 4):
EVA = NOPAT – NOA × WACC (4)
where:
NOPAT – net operating profit after tax, profit from enterprise operating activities (profit from operations) after tax,
NOA – net operating assets, capital tied up in net assets,
WACC – weighted average cost of capital (Vlachynský et al. 2006).
Determining the NOA. To calculate the NOA, a starting point is the balance sheet of an enterprise. The task is:
(i) to eliminate non-operating assets from among assets;
(ii) at market valuation, to capitalize assets which are not recognized within assets in the financial statements;
(iii) to decrease assets by non-interest-bearing debt capital.
The enterprise assets consist of these main en-tries in the balance sheet: (i) fixed assets, (ii) cur-rent assets, (iii) deferred assets.
Elimination of non-operating assets. Here it is necessary to determine which assets are of an oper-ating character and so they are essential for the ba-sic activity of an enterprise. It is important to em-phasize that carried out adjustments depend on the current situation of a concrete enterprise. Financial assets – this category of the enterprise property in-cludes bank statements, cash, and luncheon vouch-ers that are charged as stamps and vouchvouch-ers. This kind of finances is considered to be important and therefore they are included in the final calculation of the NOA. We do not reflect about writing down assets in the sphere of short-term financial assets because on the basis of the internal enterprise in-formation we have considered it does not serve an enterprise as its strategic reserve. Other assets that are not needed for operating activity – assets that do not serve the basic enterprise activity include also land and buildings that are not used, or land and buildings under reconstruction. As the enter-prise does not own such assets, it will not be nec-essary to carry out any adjustments in this sphere.
Capitalizationof operating assets unreported in enterprise accountancy. From the standpoint of theoretical knowledge concerning the modern EVA index, it is necessary to include also the fi-nance lease in the NOA calculation. By means of the lease, the analysed enterprise acquires only motor vehicles. In 2011, the enterprise leased three cars by means of the finance lease and used them for working purposes. That year also the last instal-ment in the lease of one motor vehicle was paid back and it was the same in the year 2012. Toward 31st December 2013, the enterprise had only one
motor vehicle leased by means of finance lease. Weighted average cost of capital (WACC) is de-termined as the weighted average of costs of equity capital and costs of debt capital (Eq. 5):
WACC = (1 – T) × rd × D/C + re × E/C (5)
where:
T – income tax rate,
rd – cost of debt capital (rate), D – interest-bearing debt capital, C – total cost,
re – cost of equity capital (rate), E – equity capital.
The cost of debt capital will be expressed accord-ing to Eq. 6:
cost of debt capital = interest expenses/debt capital (6) The value of interest expenses was obtained from Table 4 “Total interest expenses”. The item of the interest-bearing debt capital was substituted by the sum of total liabilities and timing difference (accru-als) that are given in the balance sheet. With this calculation we have found out that the cost of capi-tal is in the amount of 1%. The resultant value – the interest rate of 1% will be used each year of the ob-served period.
The cost of equity capital is expressed by means of the following formula (Eq. 7):
cost of equity capital = earnings/equity capital (7) When calculating the cost of equity capital, we use the earnings in the accounting period.
RESULTS
Application of the EVA index in forest enterprise performance evaluation
In the following part we shall deal with calculating the EVA index in the period 2011–2013 in a chosen forest enterprise. The discount rate is set at a level of the cost of equity capital, however, at the zero indebt-edness of the enterprise. We will calculate and evalu-ate the EVA index according to capital charge. Apart from the amount of the average cost of capital, for the calculation of the EVA index by this method it is necessary to calculate the amount of NOPAT and the amount of NOA.
Asset capitalization includes also capitalization of differences in valuation (gains and losses), goodwill, hidden reserves etc. (Table 1). As there is not avail-able any information about such assets, we will write down operating assets by the interest-free debt capi-tal. When writing down the operating assets by the interest-free debt capital, it is mainly the elimination of all financial expenses from the operating earnings. It is necessary to write down the adjusted assets by
interest-free liabilities. The trend of interest-free li-abilities of the enterprise is shown in Table 2.
Having substituted particular values from Table 2, we calculated the values shown in Table 3.
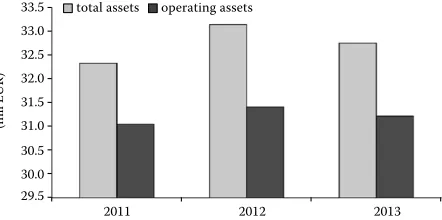
In Fig. 1 we can see the comparison of net operat-ing assets with total assets of the enterprise.
The main principle of defining the operating earnings of NOPAT is reaching the symmetry be-tween the NOA and NOPAT. When calculating it, as a starting point we used the earnings of current activity (before taxes). Then we carried out the ad-justments that we can see in Table 5. The earnings were added the interest expenses including implicit interests obtained in lease payments. With regard to the bank loans, we used directly interest expens-es paid by the enterprise as a starting point.
[image:4.595.309.530.514.624.2]Table 5, in the first line, shows the value of in-come from ordinary activities before tax. In the second line, the earnings before tax were changed so that we added interest expenses of loans and also lease. In the third line, there is a difference between the earnings after adjustment and original earn-ings. The difference between them is then taxed by the flat rate of 20% in the fifth line. In the fourth line, there is a value of the originally paid tax. The resultant value of NOPAT was obtained by deduct-ing the original tax and additionally calculated tax from the adjusted income before tax (differ-ence in the original earnings and the earnings after adjustments).
Table 2. Trend of the interest-free debt capital
2011 2012 2013
Reserves (EUR) 129,959 154,810 293,690
Fixed liabilities, interest-free (EUR) 181,959 222,610 350,690
Short-term liabilities (EUR) 1,004,522 1,371,680 901,250
Accrued liabilities (EUR) 0 0 0
Total (EUR) 1,316,440 1,749,100 1,545,630
Table 1. Values of instalments in finance lease
Year 2011 2012 2013
Finance lease capitalization (EUR) 27,510 17,280 7,720
29.5 30.0 30.5 31.0 31.5 32.0 32.5 33.0 33.5
2011 2012 2013
(mil E
U
R)
total assets operating assets
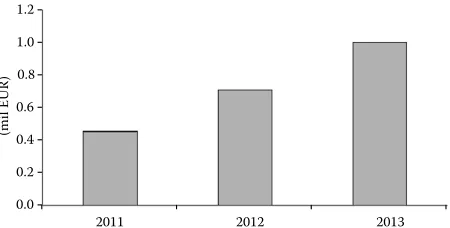
[image:4.595.63.534.681.758.2]Fig. 2 illustrates an increasing trend of the NOPAT, which proves the efficient use of operating assets.
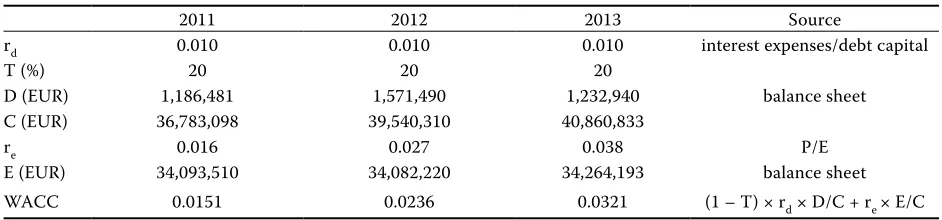
Then we will calculate the total cost of capital by the simple substitution of other values from the book closing (or balancing) into Eq. 5 for the calcu-lation of WACC. The results are shown in Table 6.
With regard to WACC, we can observe an increas-ing tendency in the enterprise within the examined period. In the year 2013 there was a growth of the WACC to the level of 3.21%. During the given year, the value of bank loans decreased and the enterprise was making a profit, thus increasing the share of its equity in the total invested capital.
Table 7 summarises the calculated data in regard to the EVA following the economic model and
us-ing Eq. 4. On the basis of the data in Table 7 we can state that the enterprise uses its assets effectively.
[image:5.595.65.531.73.229.2]EVA is a method more and more frequently ap-plied as a way of operating management on the basis of the value created for the enterprise owner or owners. The method is applied in evaluating the capital projects, investment decision-making, when measuring performance of an enterprise or when managing and motivating the staff and managers. While the EVA achieves positive values, then such an enterprise is successful. From the viewpoint of its owners, the enterprise value grows as they get back more than they invested in the enterprise and this is also in satisfying creditors – lenders. In Table 7 we can see that the EVA shows positive values dur-ing the whole observed period. These values have an increasing tendency each year, which means that the enterprise might prosper in the future. According to the previous findings and calculations of ratios, and
Table 3. Overview of net operating assets (NOA)
2011 2012 2013
Σ Fixed assets (EUR) 31,055,510 31,863,136 31,930,820
Fixed tangible assets (EUR) 30,987,000 31,784,711 31,873,650
Fixed intangible assets (EUR) 41,000 61,145 49,450
Long-term cash and investments (EUR) 0 0 0
Net working capital (EUR) –9,015 –449,028 –713,186
Inventory (EUR) 217,698 229,270 226,184
Receivables (EUR) 1,083,901 1,065,132 599,167
Financial accounts (EUR) 5,826 5,670 7,093
Accruals (time differences) (EUR) 0 0 0
Interest-free liabilities (EUR) 1,316,440 1,749,100 1,545,630
NOA (EUR) 102,024 200,102 289,545
[image:5.595.68.293.283.397.2]Lease value is added to the value of fixed tangible assets, the data concerning accruals (time differences) are left without changes; the interest-free liabilities were separated and so the value of assets in the balance sheet has been adjusted into net operating assets
Table 4. Interest expenses
2011 2012 2013
Interest expenses (EUR)
– loans 8,760 9,320 7,920
– lease 2,530 2,019 1,023
[image:5.595.303.533.562.631.2]– total 11,290 11,330 8,943
Table 5. The calculation of net operating profit after tax (NOPAT)
2011 2012 2013
(1) Earnings before tax (EUR) 555,280 909,419 1,289,998
(2) Earnings before tax after adjustment (EUR) 566,570 920,749 1,298,941
Difference (2) – (1) (EUR) 11,290 11,330 8,943
Tax paid originally (EUR) 111,056 209,166 296,699
Tax additionally calculated (equally 20%) (EUR) 2,258 2,266 1,789
NOPAT (EUR) 453,256 709,217 1,000,153
0.0 0.2 0.4 0.6 0.8 1.0 1.2
2011 2012 2013
(mil EUR)
[image:5.595.63.536.667.760.2]allowing for input quantities in the calculation of the EVA, we can state that the growing trend in the en-terprise performance should continue. However, a growth or increase in the EVA index need not lead to an increase in the enterprise value at the same time. Although the EVA increased, a decrease in the enterprise value can occur:
(i) if the increase in the EVA index at the present time has been achieved at the expense of the future surplus profits;
(ii) if the increase in the EVA index was influenced by the growing cost of capital.
DISCUSSION
The aim of the contribution was to point to pos-sibilities of making use of the EVA index in a forest enterprise. In their works, Hajdúchová et al. (2011) and Kovalčík (2007, 2011) evaluated the forest en-terprise performance by means of classical financial and economic indexes. The financial and economic indexes (e. g. profitability index) are important, how-ever, they see processes connected with an increase in the value for owners, shareholders only insufficiently. At the beginning of the 1990s of the 20th century, the
financial theory came up with new instruments for measuring the enterprise performance mainly thanks to Stewart (1991, 2013). The process of the value creation takes place at two basic levels: at the
[image:6.595.62.533.71.181.2]enter-prise level where the value is created and in capital markets where the value is realized. Especially impor-tant are such indexes of the enterprise performance whose development correlates with the fluctuation of share prices in capital markets as much as possible (Holečková 2008). Applying the EVA in corporate practice and exploring the relationship between the EVA and the change in the Greek share market, shifts in share prices were dealt with also by other authors (Maditinos et al. 2006). The aim of our contribution was not the investigation of the dependence (correla-tion) between the EVA and the change in the market value of shares, but the application of the EVA calcu-lation in a forest enterprise and research into a pos-sibility of using the index of measuring performance in the particular forest enterprise. When carrying out the analysis, we started from the basic principles of the theory of value management which we used in the forest enterprise performance evaluating by the quantification of the EVA index. In part 3 we have carried out the calculation of the basic components of the EVA index. To calculate the EVA by means of the capital charge method, it is necessary to identi-fy the amount of NOPAT and the amount of NOA. Part of the calculation is also the WACC. As the in-formation about such asset entries was not available, we wrote down operating assets by interest-free debt capital. When writing down operating assets by the interest-free debt capital, it is mainly the elimination of all financial expenses from the operating earnings (or net profit). It was necessary to write down the ad-justed assets by liabilities which were interest-free. Fig. 1 illustrates the trend of total and operating as-sets. The total assets had an uneven trend. In 2012, they reached the peak of 33,145,928 EUR. Also the operating assets reaching the value of 31,414,108 EUR were the highest in the year 2012. The highest share of operating assets was represented by receivables and interest-free debt capital – short-term liabilities. In this part we can also point to the fact that the net
Table 6. Input data for calculating the weighted average cost of capital (WACC) for the period 2011–2013
2011 2012 2013 Source
rd 0.010 0.010 0.010 interest expenses/debt capital
T (%) 20 20 20
balance sheet
D (EUR) 1,186,481 1,571,490 1,232,940
C (EUR) 36,783,098 39,540,310 40,860,833
re 0.016 0.027 0.038 P/E
E (EUR) 34,093,510 34,082,220 34,264,193 balance sheet
WACC 0.0151 0.0236 0.0321 (1 – T) × rd × D/C + re × E/C
[image:6.595.63.291.258.326.2]rd – cost of debt capital, T – income tax rate, D – interest-bearing debt capital, C – total capital, re – cost of equity capital, E – equity capital, P – profit for the accounting period
Table 7. Economic Value Added (EVA) index
2011 2012 2013
working capital is negative. The higher it is, the higher should be the ability of the enterprise to repay its li-abilities. If the net working capital has negative val-ues, it is so-called unsecured debt. Concerning the calculated values of the NOPAT, we can state that it acquires a positive value, which proves an efficient use of operating assets (Fig. 2). Table 6 documents the values of the weighted average cost of capital WACC. From the standpoint of the WACC, we can notice an increase in the enterprise in the examined period. In the year 2013, the growth of the WACC reached the level of 3.21%. In the given year the value of bank loans dropped and the enterprise was making a profit and so stockholder’s capital has increased within the total capital invested. The given facts have influenced also the enterprise market value that is expressed by the EVA index in Table 7. The EVA index was reaching a positive value in the enterprise and in the examined period it had even a growing tendency. If the EVA reaches positive values, then we can state that such an enterprise is effective, the enterprise value increases from the viewpoint of owners (in a sense of the val-ue-based management theory) because they get back more than they invested in the enterprise, and that is at the same time with satisfying creditors – lenders. From the previous calculations we can also state, if the market value of the analysed enterprise is higher than zero, the enterprise creates values and there are condi-tions that these values will increase in the future.
CONCLUSIONS
On the basis of the found out results we can say the aim of the contribution has been fulfilled as we proved the fact that the EVA index can be applied in evaluating the performance of a forest enterprise as well as when analysing the market value of the forest enterprise. However, there is a limit connected with the realization of the market value of an enterprise in the capital market. The performance of forest enterprises can be measured by means of the EVA, however, an essence of the theory of value manage-ment is the interlinking of shareholders’ (owners’) aims with the aims and decisions of the enterprise management. This interlinking should result in the maximization of the value creation for owners,
shareholders (shareholder value). It is a question of the increase in the margin between the value of vested capital and its present market value. The mar-ket value of an enterprise can be found out on the assumption about the existence and functioning of developed capital market in which the value of the enterprise is realized.
References
Balážová E. (2014): Hodnotenie výkonnosti lesného podniku. In: Sborník příspěvků z mezinárodní vědecké konference. Mezinárodní Masarykova konference pro doktorandy a mladé vědecké pracovníky, Hradec Králové, Dec 15–19, 2014: 1456–1462.
Hajdúchová I., Giertliová B., Trenčiansky M., Šulek R., Ivan L. (2011): Finančná stabilita podniku. Zvolen, Technical Uni-versity in Zvolen: 51.
Holečková J. (2008): Finanční analýza firmy. Prague, ASPI: 208. Kovalčík M. (2007): Porovnanie efektívnosti lesných podnikov
podľa Data Envelopment Analalysis a Cost Benefit analýzy. In: Zborník referátov z medzinárodnej vedeckej konferencie. Financovanie 2007 Lesy – Drevo, Zvolen, Nov 29, 2007: 7. Kovalčík M. (2011): Hodnotenie efektívnosti hospodárenia na
lesnej pôde. Lesnícky časopis, 3: 166–177.
Maditinos D., Šević Ž., Theriou G. (2006): The introduction of Economic Value Added (EVA) in the corporate world. Avail-able at http://citeseerx.ist.psu.edu/viewdoc/download?doi=1 0.1.1.456.5585&rep=rep1&type=pdf (accessed Feb 15, 2016). Maříková P., Mařík M. (2001): Moderní metody hodnocení
výkonnosti a oceňování podniku. Prague, Ekopress: 70. Stehlíková B. (2002): Finančná analýza ako metóda finančného
riadenia firmy. Acta Montanistica Slovaca, 5: 112–119. Stewart G.B. (1991): The Quest for Value: A Guide for Senior
Managers. 1st Ed. New York, Harper Business: 781.
Stewart G.B. (2013): Best-practice EVA: The Definitive Guide to Measuring and Maximizing Shareholder Value. Hoboken, John Wiley & Sons, Inc.: 324.
Šulák M., Vacík E. (2005): Meření výkonnosti firem. Prague, Vysoká škola finanční a správní: 89.
Vlachynský K. et al. (2006): Podnikové financie. Bratislava, Iura Edition: 482.
Wagner J. (2009): Meření výkonnosti: Jak meřit, vyhodnoco-vat a využívyhodnoco-vat informace o podnikové výkonnosti. Prague, Grada Publishing, a.s.: 248.
Received for publication May 19, 2015 Accepted after corrections March 31, 2016
Corresponding author: