Issues in the application of statistical techniques in sport
and exercise science.
MULLINEAUX, David R.
Available from Sheffield Hallam University Research Archive (SHURA) at:
http://shura.shu.ac.uk/20766/
This document is the author deposited version. You are advised to consult the
publisher's version if you wish to cite from it.
Published version
MULLINEAUX, David R. (2002). Issues in the application of statistical techniques in
sport and exercise science. Doctoral, Sheffield Hallam University (United Kingdom)..
Copyright and re-use policy
SHEFFIELD HALLAM UNIVERSITY LEARNING CENTRE COLLEGIATE CRESCENT
SHEFFIELD S10 2BP
ProQuest Number: 10702868
All rights reserved INFORMATION TO ALL USERS
The quality of this reproduction is dependent upon the quality of the copy submitted. In the unlikely event that the author did not send a com plete manuscript and there are missing pages, these will be noted. Also, if material had to be removed,
a note will indicate the deletion.
uest
ProQuest 10702868
Published by ProQuest LLC(2017). Copyright of the Dissertation is held by the Author. All rights reserved.
This work is protected against unauthorized copying under Title 17, United States C ode Microform Edition © ProQuest LLC.
ProQuest LLC.
789 East Eisenhower Parkway P.O. Box 1346
Issues in the application of
statistical techniques in sport and
exercise science
David R Mullineaux
PhD
Issues in the application of
statistical techniques in sport and
exercise science
David Ross Mullineaux
Published works submitted in partial fulfilment of the
requirements of Sheffield Hallam University for the degree
of Doctor of Philosophy on the basis of published work
Acknowledgements
Abstract
Contents
Preliminary pages
Title page i
Acknowledgements ii
Abstract iii
Contents iv
List of figures and tables ... vii
Nomenclature viii
Critical synopsis
Introduction 1
Repeated measures reliability ... 5
Allometric scaling 13
Mathematical modelling 19
Logistic regression 24
Review papers 29
Summary 31
References 32
Appendices of published papers
Repeated measures reliability2. Mullineaux, D.R., Barnes, C.A. and Batterham, A.M. (1999). Assessment of bias in comparing measurements: a reliability example. Measurement in Physical Education and Exercise Science, 4,195-205.
3. Mullineaux, D.R., Scott, M.A. and Batterham, A.M. (1994). The use of “agreement” for assessing digitiser reliability/objectivity. In Proceedings of the Biomechanics Section of the British Association of Sport and Exercise Sciences (edited by J. Watkins), pp. 17-20. Leeds: BASES.
Allometric scaling
4. Batterham, A.M., Barnes, C.A. and Mullineaux, D.R. (1999a). Modelling the influence of thigh muscle cross-sectional area on vertical jump performance in young professional soccer players. Journal of Sports Sciences, 17,807-8.
5. Batterham, A.M., George, K.P. and Mullineaux, D.R. (1995). Relationship between heart size and body dimensions: an allometric scaling approach. Medicine and Science in Sports and Exercise, 27, S158.
6. Batterham, A.M., George, K.P. and Mullineaux, D.R. (1997). Allometric scaling of left ventricular mass and body dimensions in males and females. Medicine and Science in Sports and Exercise, 29, 181-6.
7. Mullineaux, D.R., Barnes, C.A. and Batterham, A.M. (1998a). Allometric scaling of anaerobic performance and the use of ‘bootstrapping’ for statistical inference from a small sample. In Proceedings of the 2nd Australasian Biomechanics Conference (edited by P. Hume, R. Marshall, P. Hunter, S. Stanley, I. Anderson and P. McNair), pp. 72-3. Auckland: The University of Auckland.
Mathematical modelling
8. Payton, C.J., Hay, J.G. and Mullineaux, D.R. (1995). The effect of body roll on hand velocity in the front crawl. In Proceedings of the XVth Congress of the International Society of Biomechanics (edited by K. Hakkinen, K.L. Keskinen, P.V. Komi and A. Mero), pp. 720-1. Jyvaskyla: University of Jyvaskyla.
9. Payton, C.J., Hay, J.G. and Mullineaux, D.R. (1997). The effect of body roll on hand speed and hand path in the front crawl - a simulation study. Journal of Applied Biomechanics, 13, 300-15.
Trappe, J.M. Cappaert and T.A. Trappe), pp. 59-63. London: E & FN Spon.
Logistic regression
11. Mullineaux, D.R. and Barnes, C.A. (1998). Determinants of propensity to partake in adequate physical activity to promote health. Journal of Sports Sciences, 16,394-5.
12. Mullineaux, D.R., Barnes, C.A. and Barnes, E.F. (2001a). Factors affecting the likelihood to engage in adequate physical activity to promote health. Journal of Sports Sciences, 19, 279-88.
Review papers
13. Mullineaux, D.R. and Bartlett, R.M. (1997). Research methods and statistics. In Biomechanical Analysis of Movement in Sport and Exercise (edited by R.M. Bartlett), pp. 81-104. Leeds: BASES.
14. Mullineaux, D.R., Bartlett, R.M. and Bennett, S. (2001b). Research methods and statistics in biomechanics and motor control. Journal of Sports Sciences, 19, 739-60.
List of figures and tables
Figure
1. The relationship between the components of mathematical 19 modelling: modelling, simulation, optimisation and evaluation
(from Bartlett, 1999, p. 189)
2. Body roll angles during the front crawl pull. Dashed line: 22 breath-holding trials of swimmers throughout the four phases
(Payton et al., 1999). Solid line: mathematical model throughout three equivalent phases (Payton, Hay and Mullineaux, 1997)
3. New alternative method for presenting logistic regression 26 results (from Mullineaux et al., 2001 a)
Table
1. Tests for the assessment of repeated measures reliability 7 appropriate for different levels of measurement
Nomenclature
95% Cl a
ANOVA b
BM c
6
e FFM k In LOA LPR LVMMSb
MSr
MSw R
SEe
sex
a
VO2max
X X
Xf
x2 y y
95% confidence intervals
Constant (e.g. intercept in a linear regression; constant in non-linear scaling)
Analysis of variance
Constant (e.g. gradient in linear regression; power in non-linear scaling)
Body mass
Constant (e.g. constant for a second variable in non-linear multiple scaling)
Constant (e.g. power for a second variable in non-linear multiple scaling)
Mean of the differences between two repeat measures The natural logarithm base number
Fat free mass Number of groups
Conversion of the base number from a decimal to a natural logarithm Limits of agreement
Least-products regression Left ventricular mass Between-subjects variance
Within-subjects error/residual variance Within-subjects variance
Intraclass correlation
Standard error of the estimate
A dummy variable for sex where 0 is for males and 1 is for females Standard deviation of the differences between two repeat measures Maximal oxygen uptake
Mean value of x
Variable. Typically the independent variable
Variable. Typically an independent variable in multiple regression Variable. Typically an independent variable in multiple regression Mean value of y
Introduction
Sport and exercise science contributes to many areas of life including
education, leisure, sport and health. At the end of the last millennium this area
experienced rapid growth in the UK. In education, between 1997 and 2000,
undergraduate students enrolled on Sports Science categorised courses
increased by 46% to 6848 (UCAS, 2001). During this same period, in leisure,
consumer spending on active sport was forecast to increase by 11.2% to nearly
£6 billion (Gratton etal., 1999, p. 54). In sport, National Lottery funding enables
Sport England (1999) to promote sport for everyone via the Community
Projects funding and to increase international recognition via the World Class
funding. In health, the Government’s white paper ‘Saving Lives: Our Healthier
Nation’ details aims to reduce substantially death rates from cancer, coronary
heart disease, stroke, accidents and mental ill-health (Health Development
Agency, 1999). Promoting physical activity has been recognised within the
white paper as an important means to achieve such aims. This growth in
education, leisure, sport and health related activity demands investigation and
evaluation through applied research, a significant proportion of which will lie
within the scope of sport and exercise science and its associated fields.
Research in sport and exercise science will only be useful if it is well planned,
conducted, analysed and reported (Mullineaux and Bartlett, 1997).
Technological advances have enhanced the potential of each of these facets of
the research process. There is greater access to information to plan research
(e.g. via the World Wide Web), improved technology to collect data (e.g.
analyse data (e.g. statistics software) and readily available software to report
research (e.g. word processing packages). However, it is the improved access
to comprehensive and advanced ‘black box’ statistics software packages that
offers the greatest potential for misuse. This access provides a means to
overcome the difficulty of performing the mathematical calculations, but it does
not routinely provide information on the assumptions required for valid
analyses. The ‘black box’ software also offers the user a wealth of statistical
techniques that they would not necessarily have previously encountered.
There are many similar views on the definition of statistics. In general, statistics
are “a mathematical technique by which data are organised, treated, and
presented for interpretation and evaluation” (Vincent, 1999, p. 282). A specific
application of predicting population parameters is referred to as inferential
statistics which “consist of a set of statistical techniques that provide
predictions about population characteristics based on information in a sample
from that population” (Field, 2000, p. 4). The overall application of statistics
provides benefits that include the ability to explore, synthesise and summarise
data efficiently, simply and objectively. Statistics can also provide the scientific
rigour and objectivity (Matthews, 1998) that ‘gatekeepers’ such as journal
editors and funding bodies often seek (Mullineaux et al., 2001b). Despite such
potential benefits, data should only be analysed via an appropriate statistic but
the appropriateness of a statistic is not always obvious. The original rationale
for the development of individual tests, the subsequent mathematics
before researchers apply statistical techniques within the context of their
research.
The growth in sport and exercise science, the increasing availability of powerful
‘black box’ statistics packages, the desire of journal editors for ‘statistical
significance’ or ‘objectivity’ and researchers’ frequent lack of statistical
expertise have led to instances where statistics have been inappropriately
applied. This can produce inaccurate and misleading findings. For example, the
f-test, originating from the work by Student (1908), can be used to assess
whether chance can be discounted as an explanation for any differences
between two mean scores. The f-test does not provide any indication of random
variation between tests. However, Atkinson and Nevill (1998) identified that
sixteen out of seventy studies at the forty-third American College of Sports
Medicine conference had inappropriately used the f-test, or equivalent test, to
assess reliability or validity.
A potential way to reduce the incidence of inappropriate statistical analyses is
to publish more supporting literature on appropriate uses. Hence, the aim of
this research is to provide supporting literature on the appropriate use of less
well known, or developing, statistical tests in sport and exercise science. In this
thesis five topics incorporating statistical techniques have been selected.
Firstly, as measurement tools should be reliable as a prerequisite for validity,
techniques of testing repeated measures reliability are explored (e.g.
Mullineaux et al., 1999). The next three topics are concerned with selecting
underpinning theory. Allometric scaling is explored for testing the relationship
between body dimensions and performance measures (e.g. Batterham, George
and Mullineaux, 1997). Mathematical modelling is illustrated as a statistical
technique for investigating theoretical propositions that would be difficult to
provide support from empirical data (e.g. Payton, Hay and Mullineaux, 1997).
Logistic regression as a technique for analysing relationships in data of a
nominal or mixed level of measurement is illustrated (e.g. Mullineaux et al.,
2001a). Lastly, to promote further appropriate applications of statistical
techniques in specific disciplines consideration is made of the benefits of
review articles (e.g. Mullineaux et al., 2001b). A brief review of each of these
topics includes an explanation of the contribution of the example published
papers contained in Appendices 1 to 15 for demonstrating the application of the
statistical techniques or highlighting their contribution to the body of
knowledge. In addition, in these topics some clarification for future directions in
research concerned with the appropriate use of statistics in sport and exercise
Repeated measures reliability
Two important characteristics of a test or method of measurement are validity
and reliability. Validity relates to the degree to which a test or instrument
measures what it purports to measure. Reliability relates to the consistency and
dependability of the measures. It can be inherently difficult to assess validity,
but a sound research design evolved from theory can minimise uncertainty and
ensuring reliability can further support validity.
Reliability needs to be carefully considered at the outset of research so that it
is defined and tested appropriately within the study. For instance, 'alternative
forms’ reliability involves using different tests to measure the same construct.
Several other methods of reliability also exist, such as, ‘repeated measures’
reliability. This method is used to assess whether repeat measurements of the
same response are reproducible (Sale, 1991). This can involve testing whether
the measures obtained on two separate days, or by two testers, or with two
instruments, are reproducible and thus reliable. Note that the research design
used to assess repeated measures reliability should be considered with care.
For example, if the number of days between repeat measures is too few, then
an interaction of the pre-test with the post-test may influence the results.
Reliability is essential for validity. The tests available for appropriately
assessing reliability are dependent on such aspects as the working definition of
reliability, the number of repeat measures and level of measurement of the
data. In this thesis the focus is on reproducible results where repeated
repeated measures reliability (see Table 1). There may be some alternative
names for repeated measures reliability, such as, ‘test-retest reliability’ or
‘stability’; Often more than one test is available, where the choice of which to
use is dependent on such things as the preferences of researchers,
supervisors and journal editors on the theory underpinning the test, the
statistical assumptions and the type of data output. Although different authors
critique the appropriateness of these tests it is generally accepted that the
majority of alternative tests not listed in Table 1 are inappropriate (e.g. Pearson
product moment correlation). In addition, Table 1 refers to reliability when
assessing groups of participants, but when the data relate to a single
participant then alternative tests are available. For example, when several
measures at the interval or ratio level of measurement are obtained for a single
person, then the percentage coefficient of variation is suitable to test repeated
measures reliability (Sale, 1991; Atkinson and Nevill, 1998).
The reliability coefficient is the ratio of the true measurement variance to the
observed measurement variance. True measurement variance is obtained by
subtracting the error variance from the observed measurement variance. This
can be calculated using interclass (e.g. Pearson product moment correlation)
or intraclass correlations. Interclass correlation is inappropriate for repeated
measures reliability as it requires independent variables, is limited to two sets
of measurements and does not detect systematic errors (Thomas and Nelson,
2001). These limitations are overcome by using intraclass correlations (R), and
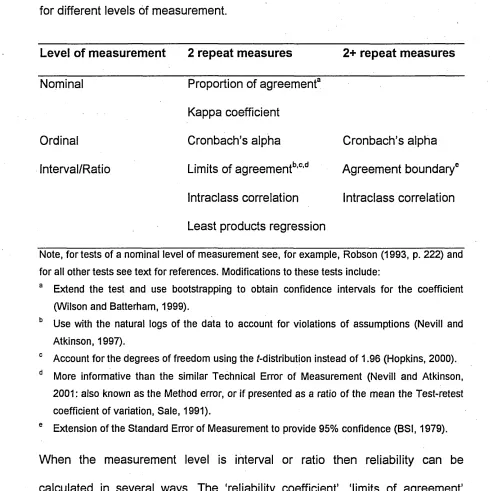
Table 1. Tests for the assessment of repeated measures reliability appropriate
for different levels of measurement.
Level of measurement 2 repeat measures 2+ repeat measures
Nominal Proportion of agreement3
Kappa coefficient
Ordinal Cronbach’s alpha Cronbach’s alpha
Interval/Ratio Limits of agreementb,c,d Agreement boundary®
Intraclass correlation Intraclass correlation
Least products regression
Note, for tests of a nominal level of measurement see, for example, Robson (1993, p. 222) and for all other tests see text for references. Modifications to these tests include:
a Extend the test and use bootstrapping to obtain confidence intervals for the coefficient (Wilson and Batterham, 1999).
b Use with the natural logs of the data to account for violations of assumptions (Nevill and Atkinson, 1997).
c Account for the degrees of freedom using the /-distribution instead of 1.96 (Hopkins, 2000). d More informative than the similar Technical Error of Measurement (Nevill and Atkinson,
2001: also known as the Method error, or if presented as a ratio of the mean the Test-retest coefficient of variation, Sale, 1991).
e Extension of the Standard Error of Measurement to provide 95% confidence (BSI, 1979).
When the measurement level is interval or ratio then reliability can be
calculated in several ways. The ‘reliability coefficient’, ‘limits of agreement’
(LOA) and ‘least-products regression’ (LPR; Ludbrook, 1997) are appropriate
techniques. LPR is also known as geometric mean regression (Ricker, 1973).
Analysis of variance (ANOVA) is often helpful for calculating the reliability
coefficient, or specifically, intraclass correlation. A simple version of the
[image:20.614.52.550.42.533.2]Wong, 1996), where, the variances are separated into components for
within-subjects (MSW) and between-subjects (MSB) effects.
Average Measure R = (MSB-M S w)l MSB [Equation 1]
A similar equation is sometimes known as Cronbach’s Alpha or Alpha
Coefficient (Equation 2; Vincent, 1999), where MSR is the within-subjects
error/residual variance. This can be used to assess reliability for two or more
measures at the ordinal level of measurement, or when the size of the means is
to be ignored (Vincent, 1999). This equation ignores within-subject variance
due to differences in between-subject means, and considers only the variance
due to the within-subject order with respect to the repeated trials.
Cronbach's Alpha = (MSB- MSR)IM SB [Equation 2]
Two of the most common versions of the intraclass correlation are described in
Equations 1 and 2. Other intraclass correlations have been described by
McGraw and Wong (1996) and Shrout and Fleiss (1979), many of which
feature in software packages such as SPSS (2001). These authors explain
where these equations may be more appropriate. For example, when no
systematic difference exists between the repeated measures then the Single
Measure R (Equation 3; McGraw and Wong, 1996; Shrout and Fleiss, 1979;
where k is the number of repeat measures) is appropriate if each measurement
is a single case. Alternatively, the Average Measure R is appropriate if each
Single Measure R = (MSB-M S W )/(MSB+(k -1 )- MSW ) [Equation 3]
Interpretation of the different versions of the intraclass correlation varies
between authors. Fleiss (1986) describes reliability as poor (R O .40), fair to
good (0.40<R<0.75) and excellent (R>0.75). A more conservative interpretation
was provided by Vincent (1999) with acceptable but questionable
(0.70<R<0.80), moderate (0.80<R<0.90) and high (R>0.90).
The variety of intraclass correlations does, however, cause problems as it is
often unclear which version of the intraclass correlation has been used thus
making comparisons between studies difficult. Problems also arise from the
reliability coefficient being severely affected by variability of the
between-subjects effects. If this variance (MSB) is large, a larger reliability coefficient is
given than for a smaller variance. This is supported by Looney (2000) who
considers that correct interpretation of intraclass correlation requires a
consideration of heterogeneity and that measurement error and differences
between the means of the repeated measures should be taken into account.
Atkinson and Nevill (1998) highlighted other potential limitations of intraclass
correlation in their review of reliability testing of variables relevant to sports
medicine. For example, no evidence could be found for analytical goals forming
the basis for the interpretation of the ranges of R proposed in the literature (e.g.
Vincent, 1999). Perhaps more important than the reliability coefficient is the
estimation of the error in the repeated measurements. This can be established
As intraclass correlation is a statistical relationship test, it has been proposed
that it should not be used to assess reliability as it does not identify the degree
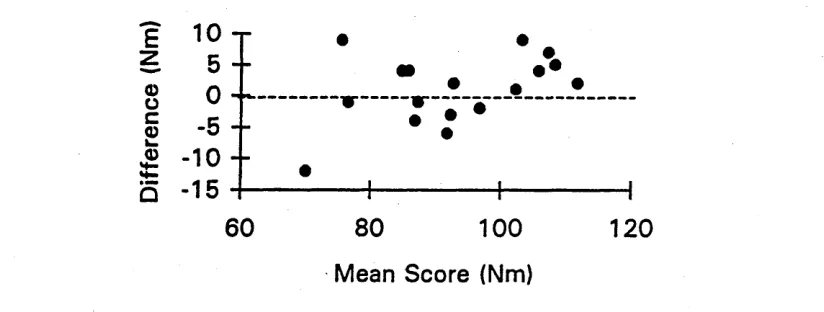
of compatibility or agreement between data sets (Bland and Altman, 1986;
Ottenbacher and Stull, 1993; Mullineaux et al., 1994). These authors propose
that the LOA test is used as it overcomes these problems and provides more
meaningful information in the form of descriptive statistics rather than as
statistical values. LOA for two sets of measurements are calculated by firstly
subtracting the values in one set from those of the other set and then
calculating the mean (6) and standard deviation (a) of the differences. The LOA
are calculated with 95% confidence using Equation 4 (Bland and Altman,
1986). For more than two groups the Agreement Boundary, providing a single
value is calculated with 95% confidence using Equation 5 (Bland, 2000; BSI,
1979; Mullineaux et al., 1994 - MSW also used instead of MSr to produce a
similar result).
LOA = 6 ±1.96 cr [Equation 4]
Agreement Boundary = ±1.96 • ^2 • MSR [Equation 5]
In sport and exercise science, LOA is often favoured (e.g. Ottenbacher and
Stull, 1993) as the calculation is simple and interpreting the data is
straightforward because results are reported in the original units of
measurement. Also, there is some measure of the fixed and proportional biases
in the measurement that traditional tests do not assess. Fixed bias is where
is where one method measures proportionally differently to the magnitude of
the other measurement. However, fixed and proportional biases often interact
and agreement does not provide a means to account for the independent effect
of each. It has therefore been proposed that to account for these related
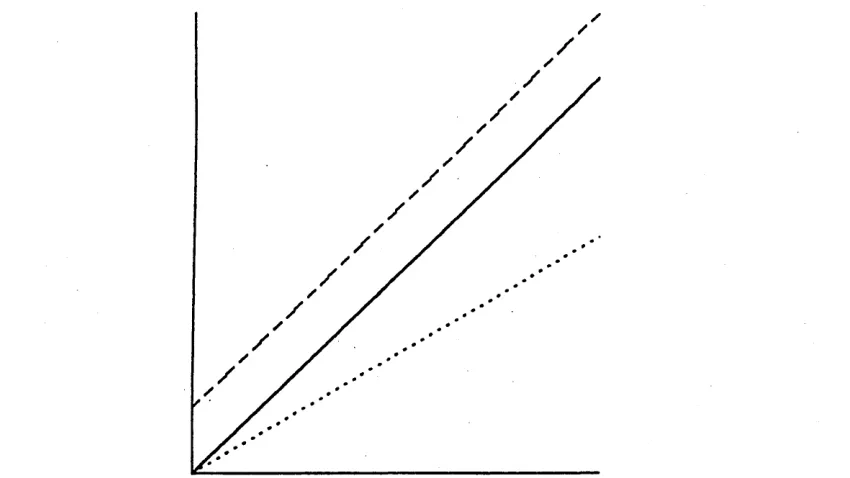
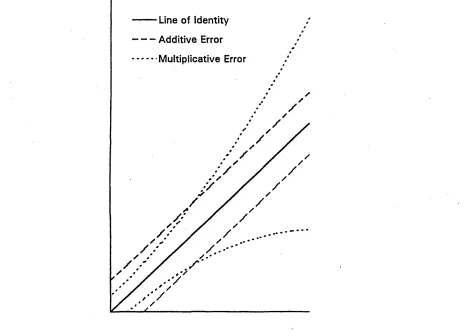
entities that a LPR is used (Ludbrook, 1997). Assumptions that must be met for
LPR include random error in x and y, normal distribution of the errors,
homoscedasticity (homogeneity of variance between the errors and the
predicted scores, i.e. additive error) and a linear relationship between the
measurements. LPR of the form y = a + b x can be calculated in several ways.
The simplest are: b is a ratio of the standard deviations of the y and x values
and a = y - b - x (where y and x are the mean values of y and x). In
interpreting LPR, the gradient (b) should ideally be 1 and the constant (a)
should ideally be 0. Whether any deviation from these ideal values is
acceptable should be considered with respect to, for example, the research
question where larger deviations may be acceptable for theory generating
work. Confidence intervals for the gradient and constant can be obtained using
bootstrapping (Zhu, 1997), the application of which has been illustrated by
Mullineaux et al. (1998b; 1999). If criterion validity is being assessed, where a
new technique is being compared to a ‘gold standard’, if no error is assumed to
exist in the ‘gold standard’ an ordinary least-squares regression could be used
instead of LPR.
The four techniques proposed in the literature to assess reliability are currently
all acceptable (i.e. R, LOA, Agreement Boundary and LPR). Which to use is a
dependent on which might provide the most meaningful statistical evaluation of
the data. The important point is that an assessment of the data is made that
supports reliability and, subsequently, validity of the chosen research design.
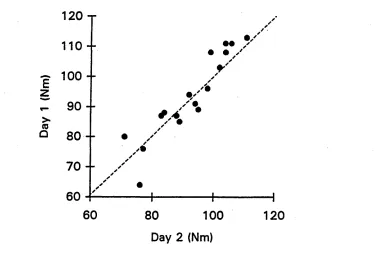
Mullineaux et al. (1999) compared the application of LOA and LPR and
demonstrated how the assumptions of each can be checked and the results
interpreted. If the proposal that these methods are more appropriate is widely
accepted, it is possible that LOA, Agreement boundary and LPR will supersede
the statistical relationship measurement (i.e. R). Further research applying
these techniques would be useful to confirm the benefits of these tests in
Allometric scaling
To express the relationship between physiological variables and body
dimensions a form of scaling known as allometric scaling (Schmidt-Nielsen,
1984) can be used to primarily identify non-linear relationships, although, the
result may be linear. There has been a renewed interest in this area applied to
humans, but Winter and Nevill (2001) cite scientific literature on allometry
dating back to 1838. Generally, allometry is appropriate for identifying the
extent to which performance differences are attributable to differences in size
or to differences in qualitative characteristics of the body’s tissues and
structures (Winter and Nevill, 2001, p. 275). In addition, as allometry can cater
for non-linear relationships, it is suitable for addressing the non-isometric and
isometric changes in dimensions with growth (e.g. Tanner, 1989). It is important
that such analyses are underpinned by a theory. Dimensionality theory offers
one possible theoretical underpinnings for an allometric scaling analysis.
Dimensionality theory is underpinned by the Systeme International d’Unites
that comprises seven base units (mass, length, time, electric current,
temperature, amount of substance and luminous intensity). From these seven
units all other units can be derived (e.g. area, volume, density, force, pressure,
energy, power, frequency).. Often for convenience, these units are renamed,
such as, the units of force of kg.m.s'2 are denoted as Newtons (N).
Dimensionality theory can be used for two main purposes (see, for example,
Duncan, 1987): dimensional homogeneity and dimensional analysis.
sides are partitioned into the same base units then the equation is correct.
Dimensional analysis can be used to predict the relationship between different
dimensions as a means to provide a theoretical foundation for a research
study, such as, between several continuous variables.
When there are two continuous variables (y and x), they can be scaled with
each other in many forms, three of which are common: ratio standard
(y = b-x); linear regression (y = a + b- x) and non-linear form (y = a - x b),
where a and b are some constants. The use of each of these scaling
techniques should be dictated by theory. This theory is not always obvious. In
addition, the mathematics of, and the assumptions for, a scaling technique
delimit their use theoretically and statistically. For example, non-linear scaling
may be appropriate for data that are not necessarily linear, theoretically
requires a zero intercept and contain multiplicative error about the regression.
The opposite of these is assumed in ratio standard or linear regression scaling
analyses in that the data are linear, the intercept is not fixed at zero and the
error is additive.
One form of dimensionality analysis that has been used to predict the
relationship between body dimensions and physiological variables is the
surface law relationship. This states that the surface area is proportional to its
volume to the power of 0.67 (Schmidt-Nielsen, 1984). On this basis, Winter et
al. (1991) showed that maximal oxygen uptake (V 02max) is proportional to body
been used to scale a variety of body dimensions with performance measures or
other body dimensions. These include body mass with cardiac dimensions (e.g.
Batterham, George and Mullineaux, 1995; George, Batterham, Gates and
Mullineaux, 1995), thigh cross sectional area with vertical jump performance
(Batterham, Barnes and Mullineaux, 1999a; 1999b) and fat free mass with peak
power output (Mullineaux et al., 1998a).
A further study by Batterham, George and Mullineaux (1997) showed that left
ventricular mass (LVM) was proportional to body mass (BM) to the power of
0.78 (0.65 to 0.91; 95% Cl). This is in agreement with the surface law
relationship as the power exponent is not statistically significant (P>0.05) from
0.67 as the 95% confidence intervals encompass this value. However, as
participants vary in body composition (e.g. percentage of fat free mass, FFM),
the predicted relationship derived from dimensionality analysis may be
inaccurate. As a link between skeletal and cardiac muscles has been proposed
(George et al., 1991), FFM may be more appropriate than BM as a predictor
variable of LVM. As such, LVM was found to equal FFM to the power of 1.07
(0.92 to 1.22, 95% Cl; Batterham, George and Mullineaux, 1997). Hence, ratio
standard scaling using BM may overestimate participants’ LVM owing to
greater percentages of body fat.
An additional benefit of allometric scaling is that more than one independent
variable, including one dummy variable (i.e. a dichotomous independent
variable coded as 0 and 1), can be included in a multiple non-linear scaling
extraneous variables, but a larger number of statistical assumptions (e.g.
multicollinearity) need to be checked. Although simple non-linear scaling is
easy to perform (i.e. y = a - x b), when there is more than one independent
h rl
variable (e.g. y = a • + c • x2 , where Xi and x2 are independent variables,
and c and d are constants) it is easier to use a log-log transformation method in
combination with multiple linear regression analyses. As the data are non
linear, where the error is often multiplicative, then the first log transformation
generally linearises the relationship, alters the error to being additive and
improves the normality distribution of the data. These are all necessary
assumptions underpinning a linear regression scaling analysis. At this stage
the standard error of the estimate (SEe) is accurate as the additive error
assumption is met. Subsequently, after the second log transformation is used to
obtain the non-linear equation, the SEe needs to be used in multiplicative form
of ± e SEe. Alternatively, the error can be considered by reporting the 95% Cl for
the power exponents obtained, for example, using bootstrapping (Zhu, 1997).
Subsequently, Batterham, George and Mullineaux (1997) extended their
analyses to include sex as an additional independent variable (i.e. as a dummy
variable coded 0 for males and 1 for females) and provide 95% Cl for the
power exponents. The data after the first log transformation are represented by
Equation 6 (excluding the 95% Cl for simplicity of presentation). The second
log transformation to obtain the non-linear equation, including the 95% Cl for
the power exponents, are presented in Equation 7 (Batterham, George and
In(LVM) = 0.96 - 0.18 • sex +1.07 • ln(FFMJ [Equation 6]
LVM = 2.6 • (eSEX )-°-18±0-10. FFM107±0/15 [Equation 7]
The confidence intervals allow for the power exponent to be assessed for
differences from theoretical values. In this instance, the confidence intervals for
the power exponent for FFM encompass one and is therefore not significantly
different from linearity. In addition, the constant for males (i.e. 2.6 (e0)'0'18 = 2.6)
and for females (i.e. 2.6 (e1)'0'18 = 2.2) from Equation 7 can be used to quantify
differences between the groups represented by the dummy variable. Hence,
independent of FFM, males possessed a LVM approximately 18% greater than
for females (i.e. male to female ratio minus one then multiplied by 100, that is,
( 2 .6 /2 .2 - 1 ) x 100).
In scaling analyses, providing a theory that supports the relationship identified
can be difficult. In particular, this is difficult in data analyses that routinely use
ratio standard or linear regression scaling analyses and yet their use is still
common. Papers on allometric scaling (e.g. Batterham, George and Mullineaux,
1997) address the need for a theoretical foundation for data analyses. A further
limitation of ratio standard and linear regression scaling has been proposed by
Batterham, George and Mullineaux (1997) in that extrapolation beyond the
actual data range should be avoided as these tests would not generally meet
the zero intercept assumption. However, this caution may also need to be
applied to allometrically scaled relationships as the assumption of a zero
research on allometrically scaled relationships requires further empirical data
to support the theoretical relationships. For instance, this support could be
provided by research providing evidence confirming the reliability of the data
Mathematical modelling
The applications of many statistical techniques are delimited by several
assumptions including the distribution of the sample. A statistical technique that
is not restricted by the sampling distribution is mathematical modelling. This
comprises one obligatory component (i.e. modelling) and three potential
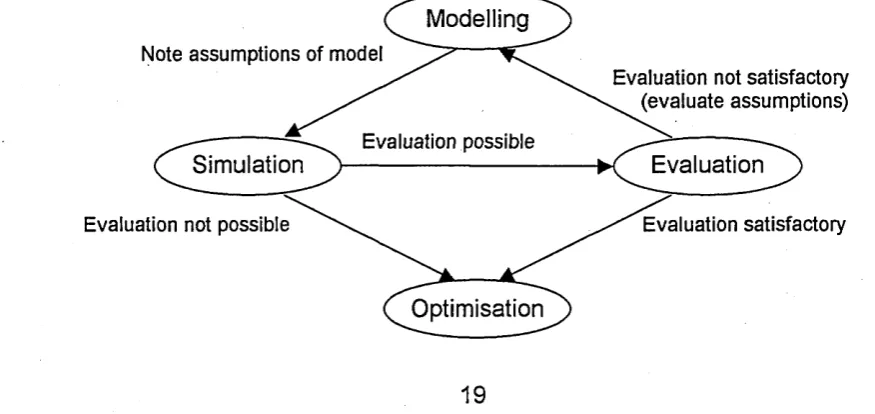
subsequent components (i.e. simulation, optimisation and evaluation). Figure 1
illustrates the links between these four concepts:
• Modelling is “an attempt to represent reality” (Nigg, 1999, p. 427).
• Simulation is “experimentation using a model” (Nigg, 1999, p. 429).
• Optimisation is an iterative process to identify the optimal simulation on a
performance objective (Marshall and Elliott, 1998).
• Evaluation or validation is “providing evidence that the model is strong and
[image:32.613.62.500.543.750.2]powerful” (Nigg, 1999, p. 429).
Figure 1. The relationship between the components of mathematical modelling:
modelling, simulation, optimisation and evaluation (from Bartlett, 1999, p. 189).
Modelling
Note assumptions of model
Evaluation not satisfactory . (evaluate assumptions) Evaluation possible
Simulation Evaluation
Evaluation satisfactory Evaluation not possible
Modelling is used throughout sport and exercise science, including,
dimensionality analysis in physiology (e.g. Batterham, George and Mullineaux,
1997 - see allometric scaling earlier), geometrical analysis in motor control
(e.g. Lee, 1976) and the equations of motion in biomechanics (e.g. Payton, Hay
and Mullineaux, 1997). Evaluating sport techniques on the basis of physical
laws through mathematical modelling provides a potentially more appropriate
method than using inferential statistical models. This is partly because of
limitations of experimental methodologies and the corresponding benefits of
mathematical modelling which include (Vaughan, 1984):
• It is safer than participants attempting potentially hazardous techniques.
• It saves time and money in running many simulations that have the potential
to predict optimal performance.
• Appropriate variables are clearly selected on theoretical grounds.
• It demonstrates how the movement could be rather than how it is performed.
• Inferential statistical assumptions are not required and thus not violated.
• There is high experimental control enabling technique to be precisely
manipulated to measure effects, or attribute changes to certain aspects of
techniques that occur without additional alterations resulting.
Research in the biomechanics of swimming is an example of where
mathematical modelling can be put to good use. This is because difficulties in
and a poor understanding of the area (Hay, 1988). It has subsequently been
proposed that mathematical modelling would probably contribute the most to a
better understanding of swimming biomechanics (Martin, 1989). However, few
mathematical models exist for swimming biomechanics (Gallenstein and
Huston, 1973; Martin et a/., 1981; Hay et al., 1993; Payton, Hay and
Mullineaux, 1995; Payton and Mullineaux, 1996; Payton, Hay and Mullineaux,
1997). Although different types of models exist (i.e. analytical, deductive,
black-box and conceptual; Nigg, 1999), a black-black-box approach, where a set of
mathematical functions determine the input to output relationship, has typically
been used in swimming biomechanics.
Mathematical modelling has its limitations (Vaughan, 1984). However, the
principal concern for any model is whether or not it effectively represents the
real world. Nigg (1999) suggested that the assumptions in the model required
to simplify the real world can be evaluated through either direct, indirect or
trend measurement methods (Nigg, 1999). In 1997, Payton, Hay and
Mullineaux (1997) using a black-box model investigated the effect of body roll
on hand path and hand speed in front crawl swimming. The simulations of the
model demonstrated that body roll alone can account for the medio-lateral
motions of the hand that are considered important in generating propulsive lift
forces required for better performance (e.g. Schleihauf et al., 1983). Such
models provide the basis for future research (e.g. Yanai, 2001). In addition, the
model by Payton, Hay and Mullineaux (1997) was the subject of a ‘direct
evaluation’ by Payton et al. (1999) where the results from the model were
represent the movements of the trunk and upper extremity used by the
swimmers” as “the assumption that the trunk rolls away from the neutral
position for the duration of the insweep ... was not the case ...” (p. 694). To
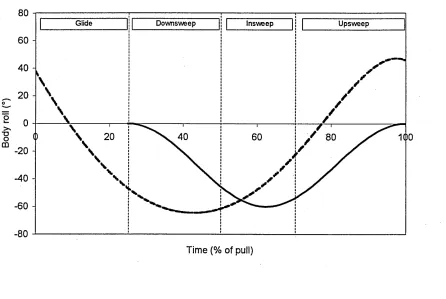
clarify this comparison, the body roll angles for the model and for the swimmers
are illustrated in Figure 2.
Figure 2. Body roll angles during the front crawl pull. Dashed line:
breath-holding trials of swimmers throughout the four phases (Payton et al., 1999).
Solid line: mathematical model throughout three equivalent phases (Payton,
Hay and Mullineaux, 1997).
80
60
40
_ 20
O
-40
-60
-80
---Time (% of pull)
It can be seen from Figure 2 that the shape of the model is similar to that of the
empirical data. However, the timing of the maximal body roll in the model at
[image:35.612.94.540.320.619.2]approximately 42% of the pull time as observed for the empirical data. This can
be achieved by including the glide phase within the model. In addition, the
modelling of the body roll, as a cosine function of the shoulder extension angle,
needs modifiying so that positive values aswell as negative values can be
obtained. Nevertheless, care should be taken that theory is used, and not the
existing action by swimmers, to develop the mathematical model further
because the action might not be optimal.
This mathematical model by Payton, Hay and Mullineaux (1997), although
provided the basis for future research (see Yanai, 2001 and Payton et al
1999), is currently at the stage of ‘evaluation not satisfactory’ (see Figure 1).
However, the modifications to the black-box model to include the glide phase
and to allow both positive and negative values will likely place the model at the
stage of ‘evaluation satisfactory’. This is because the pattern, timing and
magnitude of body roll angles in the model will more accurately simulate those
observed in swimmers (see Figure 2). This model would subsequently provide
the basis for future research on the ‘optimisation’ of technique and thus
promote further understanding of the influence of body roll angles in front crawl
Logistic regression
In sport and exercise science research, gathering data of a nominal level of
measurement has benefits that include the ease of its presentation and
interpretation of findings. As such, nominal data can be useful for publicising
meaning for practical, professional and political aims. This is particularly the
case for the often large data sets derived from surveys where the results are
often presented in a simple uni-factorial form such as frequency counts. An
example of such a survey is the Allied Dunbar National Fitness Survey of
English adults (Activity and Health Research, 1992). In presenting the results
from this survey only frequency data were reported in the original report. Such
surveys on sport, health and exercise provide a wealth of information that
allows for future secondary data analyses.
Secondary data analyses, owing to the more focused nature of the research
and reduced data set, often extend the uni-factorial analyses of the original
surveys and use advanced multi-factorial analyses such as discriminant
analysis. Discriminant analysis has been used to predict factors that determine
group membership. Although rarely used in sport and exercise psychology,
Biddle et al. (2001) considers its wider use could be beneficial. Conversely,
Munro (2001) considers logistic regression as a preferred test owing to a
number of advantages over discriminant analysis. These advantages include
that the independent variables can be of any level of measurement,
assumptions of the data are fewer (e.g. the normal distribution is not required)
the form of odds values that can be used to predict membership to each level of
a dichotomous dependent variable.
As with all regression analyses, there must be a theoretical relationship
between the dependent variable and independent variables. The complexity of
the relationship between variables can be accounted for in logistic regression
as the independent variables can be entered in three forms: categorical (e.g.
sex), continuous (e.g. age) or interaction (e.g. sex by age as a two-way
interaction). Examples in the literature use variables in combinations of the
different forms. Mullineaux and Barnes (1997; 1998) and Mullineaux et al.
(2001a) used the variables in categorical form. Brill et al. (2000) and Pollard
and Reep (1997) used a mixture of categorical and continuous forms of the
variables. Iwao et al. (2000) included variables in an interaction form. However,
the variety of variable combinations and the traditional tabular presentation of
the logistic regression model typically used in the literature can make
interpretation of the results difficult. Additional limitations of logistic regression
are that: the dependent variable is limited to two groups; the regression results
are obtained by an ‘iterative process’ or ‘best guess’ and do not provide
predictions based on an underlying mathematical theory and dissemination of
findings is difficult as many practitioners’ understanding of ‘odds’ values is
limited.
The aim of the study by Mullineaux et al. (2001a) was to demonstrate a use of
logistic regression via a secondary data analysis of the Allied Dunbar National
processes to overcome some of the limitations of this statistical technique. For
example, for ease of analysis: all independent variables were coded as
categorical variables; variables with the lowest odds were coded appropriately
so that only multiplication would be required in using the model and standard
error estimates were omitted. In addition, as in the literature the logistic
regression model is typically presented in tabular form, which is difficult to
interpret, in the study by Mullineaux et al. (2001a) the data were presented in
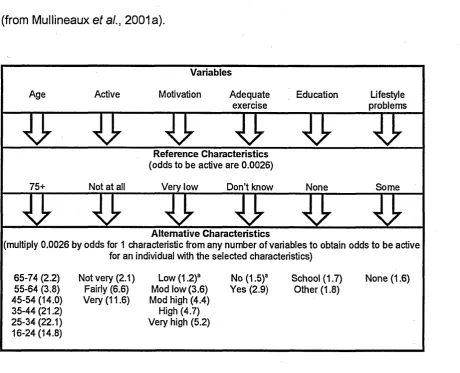
an alternative graphical form (Figure 3).
Figure 3. New alternative method for presenting logistic regression results
(from Mullineaux et al., 2001 a).
Variables
Age Active Motivation Adequate
exercise Education problemsLifestyle
Reference Characteristics (odds to be active are 0.0026)
75+ Not at all Very low Don’t know None Some
s i
Alternative Characteristics
(multiply 0.0026 by odds for 1 characteristic from any number of variables to obtain odds to be active for an individual with the selected characteristics)
65-74 (2.2) Not very (2.1) Low (1
2 f
No (1.5)a School (1.7) None (1.6) 55-64(3.8) Fairly (6.6) Mod low (3.6) Yes (2.9) Other (1.8)45-54(14.0) Very (11.6) Mod high (4.4)
35-44 (21.2) High (4.7)
25-34(22.1) Very high (5.2)
16-24 (14.8)
The same results from Figure 3 can be compared to the typical tabular form of
[image:39.614.85.546.285.658.2]presentation format for the logistic regression model by firstly better
highlighting the characteristics included in the constant term and secondly by
omitting the frequency data and confidence intervals for the odds that are not
required when using the model. Subsequently, selecting characteristics from
each variable are clearer to enable the odds of that individual to participate in
adequate physical activity to be calculated more easily. It is suggested that this
new graphical method will facilitate an easier application of logistic regression
models.
There were, however, several limitations in the study by Mullineaux et al.
(2001a). For instance, difficulty occurred in identifying any valid ethnic
influence for participation in physical activity. This was due to a small and
uneven sample proportions that led to an increase in the error and therefore
uncertainty in the results (Menard, 1995). Nevertheless, such restrictions apply
to many other statistical techniques and are not unique to logistic regression.
Furthermore, the analysis compared only the ‘sedentary’ to ‘sufficiently active’
groups, and did not analyse the ‘some activity’ group that participated at a level
lower than that deemed beneficial for health. Extending the study by Mullineaux
etal. (2001a) to use a multinomial or polychotomous logistic regression (SPSS,
2001) may overcome this latter limitation. This may provide greater information
on using such statistical tests for analysing data of a nominal or mixed level of
measurement to enable the dependent variable in the research to be defined
Table 2. Typical tabular method used to present logistic regression results
(data from Mullineaux et al., 2001a).
Variable Characteristic Frequency Odds 95%CI
Constant 0.0026 -3.50 to 3.51
Age 75+ 246
65 to 74 270 2.18 -0.57 to 4.94
55 to 64 276 3.80 0.96 to 6.63
45 to 54 295 14.02 11.19 to 16.86
35 to 44 313 21.23 18.38 to 24.10
25 to 34 336 22.13 19.26 to 25.00
16 to 24 269 14.78 11.88 to 17.67
Active Not at all 167
Not very 354 2.12 -0.51 to 4.76
Fairly 1038 6.57 3.96 to 9.18
Very 446 11.57 8.87 to 14.26
Motivation Very low 475
Low 145 1.20a -1.44 to 3.84
Mod low 270 3.63 1.08 to 6.17
Mod high 452 4.35 1.83 to 6.87
High 418 4.75 2.22 to 7.27
Very high 245 5.19 2.59 to 7.78
Adequate exercise Don’t know 60
No 760 1.48a -1.56 to 4.52
Yes 1185 2.95 -0.09 to 5.98
Education None 937
School 604 1.70 -0.59 to 3.99
Other 464 1.84 -0.46 to 4.14
Lifestyle problems Some 607
None 1398 1.63 -0.63 to 3.90
[image:41.615.67.544.90.692.2]Review papers
In addition to analysing specific techniques, review papers addressing a
breadth of issues for different disciplines of sport and exercise science provide
additional benefits for researchers. Part of the title for a review paper on sport
psychology by Schutz and Gessaroli (1993), ‘use, misuse and disuse’,
highlights potential benefits of review papers. More specifically, benefits
highlighted include the breadths of traditional and novel statistical applications
that are relevant for different disciplines. In addition, an indication of the
diversity of theoretical topics in the area is provided, papers can be more up to
date than information provided in textbooks and existing publications may be
critiqued for appropriate and inappropriate applications of statistics. Owing to
the potential benefits of overview papers, several have been published for each
of the main disciplines of sport and exercise science. These include papers by
James and Bates (1997) and Mullineaux and Bartlett (1997) for biomechanics,
Shultz and Sands (1995) for physiology and Schutz and Gessaroli (1993) for
psychology.
More recently, I proposed that a special issue on Research Methods and
Statistics be commissioned by the Journal of Sports Sciences. This has been
published and is summarised through the editorial by Nevill, Atkinson and
Mullineaux (2001). This issue included invited review papers for the four areas
of sport performance research (Atkinson and Nevill, 2001), psychology (Biddle
et al., 2001), physiology of exercise and kinanthropometry (Winter et al., 2001)
statistics that will further facilitate more appropriate use of statistics in sport and
Summary
The aim of this thesis is to highlight some appropriate uses of statistical
techniques through applied examples in sport and exercise science research.
The preceding sections provide an overview of selected techniques on five
topics. Firstly, as measurement tools should be reliable for validity, LOA and
LPR were proposed as appropriate techniques of testing repeated measures
reliability (e.g. Mullineaux et a l, 1999). The next three topics were concerned
with the necessity to analyse data with respect to an underpinning theory. The
use of allometric scaling was shown to be appropriate for testing the
relationship between body dimensions and performance measures (e.g.
Batterham, George and Mullineaux, 1997). The use of mathematical modelling
was demonstrated as beneficial for investigating a research question that
would be difficult to test empirically (e.g. Payton, Hay and Mullineaux, 1997).
The use of logistic regression to explore data of a nominal or mixed level of
measurement was also highlighted (e.g. Mullineaux et al., 2001a). Lastly, the
benefits of review articles for promoting the understanding and appropriateness
of applications of statistical techniques in specific disciplines were outlined
(e.g. Mullineaux et al., 2001b). In addition to the brief review of each of these
topics, the contribution of the appended published papers to highlighting an
appropriate use of statistical analyses and directions for future research were
provided. Statistical analysis techniques will continue to become more easily
available and will allow increasingly complex questions to be investigated. As a
result, the need for publications that emphasise the appropriate use of
References
Activity and Health Research (1992). Allied Dunbar National Fitness Survey:
Main Findings. London: Sports Council and Health Education Authority.
Atkinson, G. and Nevill, A.M. (1998). Statistical methods for assessing
measurement error (reliability) in variables relevant to sports medicine. Sports
Medicine, 26, 217-38.
Atkinson, G. and Nevill, A.M. (2001). Selected issues in the design and
analysis of sport performance research. Journal of Sports Sciences, 19,
811-27.
Bartlett, R.M. (1999). Sports Biomechanics: Reducing Injury and Improving
Performance. London: E & FN Spon.
Batterham, A.M., Barnes, C.A. and Mullineaux, D.R. (1999a). Modelling the
influence of thigh muscle cross-sectional area on vertical jump performance in
young professional soccer players. Journal of Sports Sciences, 17, 807-8.
Batterham, A.M., Barnes, C.A. and Mullineaux, D.R. (1999b). Modelling the
influence of thigh muscle cross-sectional area on vertical jump performance in
young professional soccer players. In Proceedings of the World Congress of
Science and Football IV, p. 11. Sydney: University of Technology.
Batterham, A.M., George, K.P. and Mullineaux, D.R. (1995). Relationship
between heart size and body dimensions: an allometric scaling approach.
Batterham, A.M., George, K.P. and Mullineaux, D.R. (1997). Allometric scaling
of left ventricular mass and body dimensions in males and females. Medicine
and Science in Sports and Exercise, 29, 181 -6.
Biddle, S.J.H., Markland, D., Gilbourne, D., Chatzisarantis, N.L.D. and Sparkes,
A.C. (2001). Research methods in sport and exercise psychology: quantitative
and qualitative issues. Journal of Sports Science, 19, 777-809.
Bland, J.M. (2000). An Introduction to Medical Statistics. Oxford: Oxford
University Press.
Bland, J.M. and Altman, D.G. (1986). Statistical methods for assessing
agreement between two methods of clinical measurement. The Lancet, 1,
307-10
.Brill, P.A., Macera, C.A., Davis, D.R., Blair, S.N. and Gordon, N. (2000).
Muscular strength and physical function. Medicine and Science in Sports and
Exercise, 32, 412-6.
BSI (1979). Precision of Test Methods 1: Guide for the Determination and
Reproducibility of a Standard Test Method (BS 5497, Part 1). London: British
Standards Institute.
Duncan, T. (1987). Physics: A Textbook for Advanced Level Students. London:
John Murray.
Fleiss, J.L. (1986). The Design and Analysis of Clinical Experiments. New York:
Wiley.
Gallenstein, J. and Huston, R.L. (1973). Analysis of swimming motions. Human
Factors, 15, 91-8.
George, K.P., Batterham, A.M., Gates, P.E. and Mullineaux, D.R. (1995).
Ratio-standard versus allometric scaling in cardiac dimensions of athletes and
controls. Medicine and Science in Sports and Exercise, 27, S158.
George, K.P., Wolfe, L.A. and Burggraf, G.W. (1991). The ‘athletic heart
syndrome’: a critical review. Sports Medicine, 11, 300-31.
Gratton, C., Shibli, S. and Kokolakakis, T. (1999). Leisure Forecasts 1999
-2003. Sheffield: Leisure Industries Research Centre.
Hay, J.G. (1988). The status of research on the biomechanics of swimming. In
Swimming Science V (edited by B.E. Ungerechts, K. Wilke and K. Reischle),
pp. 3-14. Champaign, IL: Human Kinetics.
Hay, J.G., Liu, Q. and Andrews, J.G. (1993). Body roll and handpath in
freestyle swimming: a computer simulation study. Journal of Applied
Biomechanics, 9, 227-37.
Health Development Agency (1999). Saving Lives: Our Healthier Nation.
London: The Stationary Office.
Hopkins, W.G. (2000). Measures of reliability in sports medicine and science.
Iwao, N., Iwao, S., Muller, D.C., Elahi, D., Shimokata, H. and Andres, R. (2000).
A test of recently proposed BMI standards with respect to old age.
Aging-Clinical and Experimental Research, 12, 461 -9.
James, C.R. and Bates, B.T. (1997). Experimental and statistical design issues
in human movement research. Measurement in Physical Education and
Exercise Science, 1, 55-69.
Lee, D.N. (1976). A theory of visual control of braking based on information
about time-to-collision. Perception, 5, 437-59.
Looney, M.A. (2000). When is the intraclass correlation coefficient misleading?
Measurement in Physical Education and Exercise Science, 4, 73-8.
Ludbrook, J. (1997). Comparing methods of measurement. Clinical and
Experimental Pharmacology Physiology, 24, 193-203.
Marshall, R.N. and Elliott, B.C. (1998). The analysis and development of
technique in sport. In Training in Sport: Applying Sport Science (edited by B.C.
Elliott), pp. 117-44. Chichester: Wiley.
Martin, R.B. (1989). Swimming: forces on aquatic animals and humans. In
Biomechanics of Sport (edited by C.L. Vaughan), pp. 35-51. Boca Raton, FL:
CRC Press.
Martin, R.B., Yeater, R.A. and White, M.K. (1981). A simple analytical model for
the crawl stroke. Journal of Biomechanics, 14, 539-48.
McGraw, K.O. and Wong, S.P. (1996). Forming inferences about some
intraclass correlation coefficients. Psychological Methods, 1, 30-46.
Menard, S. (1995