DEVELOPMENT AND VALIDATION OF STABILITY INDICATING
RP-HPLC METHOD FOR ESTIMATION OF ROSUVASTATIN AND
EZETIMIBE IN CAPSULE DOSAGE FORM.
Patel Aesha A.* and Dr. Paresh Patel
Department of Pharmaceutical Quality Assurance, Shree S. K. Patel College of
Pharmaceutical Education and Research, Ganpat University, Ganpat Vidyanagar– 384012,
Mahesana, Gujarat, India.
ABSTRACT
Rosuvastatin and Ezetimibe are used for the treatment of
hyperlipidemia. A stability-indicating RP-HPLC method was
developed and validated for the estimation of Rosuvastatin and
Ezetimibe in Capsule dosage form using Inertsil ODS 3 (100 mm x 4.6
mm i.d, 3 µm particle size) column with mobile phase consisting of
Buffer solution (dissolve about 3.4 gm of Disodium hydrogen
phosphate dihydrate in 1000 ml water and mix. Adjust pH of 5.0 with
dilute phosphoric acid.) and acetonitrile (60:40 %v/v) with a flow rate
of 1.5 ml/min (UV detection 232 nm). Linearity was observed over the
concentration range 5.0-20 μg/ml for both Rosuvastatin (r2=0.9994)
and Ezetimibe (r2=0.9990). The LOD and LOQ were found to be
0.0282 μg/ml and 0.0853 μg/ml for Rosuvastatin and the LOD and LOQ for Ezetimibe were 0.0297 μg/ml and 0.0901 μg/ml respectively.
Rosuvastatin and Ezetimibe were subjected to stress conditions of
degradation in aqueous solutions including acidic, alkaline, oxidation, Humidity and thermal
degradation. The method was validated as per ICH guidelines. The percentage RSD for
precision was found to be 0.4 % and 0.7 % for Rosuvastatin and Ezetimibe. The method is
simple, specific, precise, robust and accurate for estimation of Rosuvastatin and Ezetimibe in
Capsule dosage form. The method was successfully applied to the determination of these
drugs in pharmaceutical dosage form.
KEYWORDS: Rosuvastatin, Ezetimibe, RP-HPLC, ICH guidelines, Stability Indicating,
Validation.
Volume 7, Issue 7, 1502-1516. Research Article ISSN 2277– 7105
*Corresponding Author
Patel Aesha A.
Department of
Pharmaceutical Quality
Assurance, Shree S. K. Patel
College of Pharmaceutical
Education and Research,
Ganpat University, Ganpat
Vidyanagar– 384012,
Mahesana, Gujarat, India. Article Received on 12 Feb. 2018,
Revised on 05 March 2018, Accepted on 27 March 2018
DOI: 10.20959/wjpr20187-11776
INTRODUCTION
Rosuvastatin (RST) is chemically designated as (3R, 5S, 6E) - 7 - [4 - (4 - fluorophenyl) - 2 -
(N – methyl methane sulfonamido) - 6 - (propane - 2 - yl) pyrimidin - 5 - yl] - 3, 5 -
dihydroxyhept - 6 - enoic acid. It is a member of the drug class of statins. It is used in the
treatment of Hyperlipidemia(Figure-1). Rosuvastatin Calcium is a selective and competitive
inhibitor of hydroxyl methyl glutaryl coenzyme A (HMG Co A) reductase (a precursor of
cholesterol), the rate- limiting enzyme that converts 3-hydroxyl-3-methylglutaryl coenzyme
A to mevalonate. It reduces levels of low-density lipoprotein, apolipoprotein B and
triglycerides in the blood, while increasing levels of high-density lipoprotein in the
management of hyper lipidaemias. Ezetimibe (EZT) chemically designated as (3R, 4S) - 1 -
(4 - fluorophenyl) - 3 - [(3S) - 3 - (4 - fluorophenyl) - 3 - hydroxypropyl] - 4 - (4 -
hydroxyphenyl) azetidin - 2 – one (Figure-2). It is a selective cholesterol absorption inhibitor,
used for the treatment of hyperlipidemia, which potentially inhibits the absorption of biliary
and dietary cholesterol. Ezetimibe prevents intestinal absorption of cholesterol without
affecting absorption of triglycerides, fatty acids and fat-soluble vitamins.
Figure. 1. Rosuvastatin Chemical structure.
Figure. 2. Ezetimibe Chemical Structure.
Various analytical techniques such as micellar liquid chromatography, HPLC, HPTLC,
densitometry TLC, spectrophotometry and spectrofluorimetryhave been developed for the
estimation of rosuvastatin and ezetimibe in pharmaceutical formulations. In the present study
an attempt has been made to develop a validated stability indicating RP-HPLC method for the
estimation of rosuvastatin and ezetimibe in pharmaceutical formulations as per ICH
MATERIALS AND METHODS
Apparatus
RP-HPLC instrument equipped with an UV –Visible detector and a photodiode array detector
(ultimate dionex 3000 , Shimadzu Japan, Waters) ,an auto-Sampler ,Uv –visible spectroscopy
(Shimadzu-1700 Series, Japan) ,Analytical Balance (Mettler Toledo, India) , A Hot air oven
(Grover, New Delhi) , Digital pH meter (Lab India , Pico+ , Mumbai) ,Sonicator (Ultrasonic
cleaner ,Frontline FS 4, Mumbai), Milli Q water System ( Siemens Ultra clear,Malaysia),
Water Bath (Equitron , Mumbai), Pre-validated volumetric flasks, pipettes, etc.
Chemicals and Reagents
Rosuvastatin and Ezetimibe standard powder were gifted by Zydus Cadila Healthcare Ltd.
The capsule formulations containing 10 mg rosuvastatin and 10 mg ezetimibe were procured
From Zydus Cadila Healthcare ltd. Methanol and Acetonitrile, Water
(HPLC & Spectroscopy grade, Spectrochem pvt ltd, Mumbai)
Hydrochloric acid, Sodium Hydroxide and Disodium Hydrogen Phosphate Dihydrate Salt
(L R grade, Merck Pharmaceuticals Ltd, India)
Chromatographic Conditions
The chromatographic separations were performed using Inertsil ODS 3 (100 mm x 4.6 mm
i.d, 3 µm particle size) column at 25 ºC temperature. The optimum mobile phase consisted of
Buffer solution (dissolve about 3.4 gm of Disodium hydrogen phosphate dihydrate in 1000
ml water and mix. Adjust pH of 5.0 with dilute phosphoric acid.) and acetonitrile in the ratio
of 60:40 %v/v. Auto sampler 30 µl was used and kept at Room temperature. Analysis was
done with flow rate of 1.5 ml/min at 232 nm (λ max of Rosuvastatin and Ezetimibe)
wavelength by using photodiode array (PDA) detector.
Software
Chromeleon software Ultimate Dionex 3000 HPLC.
Preparation of standard stock solution of Rosuvastatin
Transfer an accurately weighed quantity of about 52 mg of Rosuvastatin Calcium and add
into a 100 ml volumetric flask, add about 50.0 ml of diluent & sonicate to dissolve. Make
Preparation of standard stock solution of Ezetimibe
Transfer an accurately weighed quantity of about 50 mg of Ezetimibe and add into a 100 ml
volumetric flask, add about 50.0 ml of acetonitrile & sonicate to dissolve. Make volume up to
the mark with acetonitrile and mix it.
Preparation of standard stock solution of Rosuvastatin and Ezetimibe
Dilute 2.0 ml of each Rosuvastatin standard stock and Ezetimibe standard stock Solution; add
into a 100 ml volumetric flask and diluted up to the mark with Mobile phase & mix it.
Calibration curves of RSV and EZE
Calibration curve were plotted over a concentration range of 5-20 µg/ml for RSV and EZE
drugs. For this aliquots of 5, 8, 10, 12, 15, 18, and 20 μl for RSV and EZE. The calibration
curves were obtained by plotting peak area Vs concentration (µg/ml) of RSV and EZE the
regression equation was calculated.
Determination of wavelength of maximum absorbance
The standard solution of RSV and ezetimibe was scanned into UV. It is detected between the
range of 200-400 nm. Maximum absorbance was achieved at 232 nm; both drugs were
detected at this wavelength.
Validation of the Developed Method
Linearity
A calibration curve was plotted in concentration range from 20 µg/ml for RSV and EZE
5-20 µg/ml was used. Linearity curve plotted by taking aliquots of 5,8,10,12,15,18 and 5-20
µg/ml for RSV and EZE. The solution was filtered and diluted with Diluent (Water: ACN).
30 µl were injected from this solution to HPLC. Calibration curve plotted by putting peak
area vs. concentration on axis then regression line equation was calculate.
Precision
The repeatability of the instrument was checked by repeatedly solutions (n = 6) solution of
RSV (10 µg/ml) and SMV (10 µg/ml). Without changing the parameters of the developed
method It showed low % RSD of peak area of RSV and EZE. The inter-day and intra-day
variation was determined at three different concentration levels on three different days over a
period of one week (interday precision) and three different times on same day (intraday
Limit of detection and limit of quantification
LOD and LOQ of the drug were calculated by using the following equations designated by
ICH guideline: LOD = 3.3 X σ/S and LOQ = 10 X σ/S.
Where, σ = the standard deviation of the response
S = slope of the calibration curve.
Recovery studies
The accuracy of the method was determined by calculating recoveries of RSV and EZE by
the standard addition method. Known amounts of standard solution of RSV and EZE were
added at 50 %, 100 % and 150 % levels to pre quantified sample solutions of RSV and EZE.
Accuracy was determined in terms of percentage recovery. The experiment was conducted in
triplicate.
Specificity
The specificity of the method was ascertained by analyzing blank sample solution and sample
solution of RSV and EZE. The peak purity was assessed for blank, standard solution and
sample solution for both the drugs.
System suitability: In this system suitability method, standard drug solutions of RSV and
EZE were injected for six times to check suitability for instrument. The results were
calculated in % RSD which isn’t more than 2.
Solution stability: The solution stability of Rosuvastatin and Ezetimibe in the assay method
was carried out by leaving both the sample and reference standard solutions in tightly capped
volumetric flasks at room temperature for 20 h. The same sample solutions were assayed at 3
hrs intervals over the study period.
Filter Compatibility: In this method, drug sample solutions of Rosuvastatin and ezetimibe
were filtered with 0.45 PVDF Filter and 3ml, 5ml, 7 ml discarded samples were compared
with unfiltered sample (initial) & Calculate % Difference between filtrate and unfiltrate.
Robustness
The robustness of the assay method was established by introducing small changes in the
HPLC conditions which included wavelength (232 and 230 nm, 234nm), column temperature
(20, 25,30C) and flow rate (1.4 and 1.5, 1.7 ml/min). Robustness of the method was studied
Assay of RSV AND EZE
Weigh 10 tablets and calculate average weight. Weigh and transfer 5 intact tablets in to 200.0
ml volumetric flask. Add about 10 ml of water and sonicate till completely disperse The
tablets. And add about 125 ml of Diluent and sonicate for 30 minutes with occasional
Shaking. Make volume up to the mark with diluent and mix. Filter the solution through 0.45
µm Millipore PVDF filter, collect the filtrate by discarding first 5.0 ml of the filtrate And
Dilute 4.0 ml of the filtrate to 100.0 ml with mobile Phase and mix.
Forced degradation studies
Stress studies were performed to evaluate the specificity of the method. All samples were
diluted with mobile phase to give a final concentration 10 μg/ml and filtered through 0.45 μm
PVDF filter before inject it.
Acidic conditions
Acidic degradation was conducted by dissolving 1 intact tablet into 50 ml volumetric flask
and add 2.5 ml water to sonicate till completely disperse the tablet, & add almost 1 ml 0.01 N
of Hcl and Add into the volumetric flask , reflux at 60 C for 30 min in reflux bath. And after
all the process, neutralized with 1 ml 0.01 N NaOH and mark with diluent. Lastly, dilute 1 ml
into the 20 ml volumetric flask. 30µl solution was injected into the HPLC system.
Alkaline conditions
Alkaline degradation was conducted by dissolving 1 intact tablet into 50 ml volumetric flask
and add 2.5 ml water to sonicate till completely disperse the tablet, & add almost 1 ml of 0.01
N NaOH and Add into the volumetric flask, reflux at 40 C for 10 min in reflux bath for RS
and at 60 C for 30 min in reflux bath for E E. nd after all the process, neutralized with 1 ml
of 0.01 N Hcl and mark with diluent. Lastly, dilute 1 ml into the 20 ml volumetric flask. 30µl
solution was injected into the HPLC system.
Oxidation conditions
Oxidation degradation was performed by treating the drug solution mixture (containing
1intact tablet of RSV and EZE) and add 1 ml of 10% H2O2, reflux at 60 C for 10 min. The
drug solution mixture was cooled and then diluted with mobile phase as per the requirement
Neutral conditions: Neutral degradation was performed by treating the drug solution
mixture (containing 1intact tablet of RSV and EZE) with 1 ml of water at Room temperature
for 24 hrs. nd Make up with mobile phase as per requirement and 30 μl of the solution was
injected in to the HPLC system.
Humidity conditions: Humidity degradation was performed by treating the drug solution
mixture (containing 1intact tablet of RSV and EZE) in Humidity chamber maintained at
50 C, 80% for 24 hrs and cooled, And Make up with mobile phase as per requirement and 30 μl of the solution was injected in to the HPLC system.
Thermal conditions
The drug solution mixture (containing 1 intact tablet of RSV and EZE) was in a thermostat
maintained at 105ºC for 24 hours, cooled and 30 μl of the solution was injected in to
the HPLC system after necessary dilution with mobile phase.
RESULTS AND DISCUSSION
Method Development: In this work, a method based on RP-HPLC, using PDA detector, was
developed and validated for Rosuvastatin and Ezetimibe in Pharmaceutical formulations. The
experimental conditions were selected after different stationary and mobile phases were
tested. C8 and C18 columns were used. However, best results were observed when the
Inertsil ODS 3 (100 mm x 4.6 mm i.d, 3 µm particle size) column at 25 ºC temperature was
used. The mobile phase, Buffer solution (dissolve about 3.4 gm of Disodium hydrogen
phosphate dihydrate in 1000 ml with water and mix. Adjust pH of 5.0 with dilute phosphoric
acid.) and acetonitrile in the ratio of 60:40 % v/v was used. The retention Time was found to
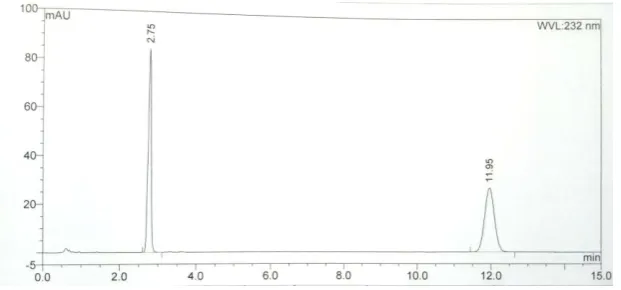
be 3.03 min for Rosuvastatin and 11.89 min for ezetimibe. The duration of separation of two
[image:7.595.145.456.602.747.2]drugs are 7 min. so, It is superior method.
Validation data of the method
Linearity
The combination of RSV and EZE shows linearity over a concentration range of 5.0-20 μg/ml
(Table) and the linear regression equations were found to be y = 3832.2x – 5026.07
(r2=0.9994) and y = 4697.1x + 4099.7 (r2=0.9990) for Rosuvastatin and Ezetimibe
respectively. (This is shown in Table. I).
Table. I summary of linear regression analysis and optical characteristics of RSV &
EZE
Parameter RSV EZE
Wavelength , nm 242 nm 232 nm
Linear concentration range, μg/ml 5-20 μg/ml 5-20 μg/ml Regression equation y = 3832.2x – 5026.07 y = 4697.1x + 4099.7
Correlation coefficients, r r2=0.9994 r2=0.9990
LOD, μg ml-1 0.0282 μg/ml 0.0853 μg/ml
LOQ, μg ml-1 0.0297 μg/ml 0.0901 μg/ml
Recovery studies
The accuracy study was repeated over three consecutive days and the resultant % RSD was
found to be 0.2-0.3 and 0.1-0.6 for Rosuvastatin and Ezetimibe indicating that the method is
precise. The recovery of for Rosuvastatin and Ezetimibe was found to be 99.3- 101.9 % and
102.8-103.6 % respectively (Table.II).
Table. II recovery studies of RSV & EZE.
Parameter Level Mg
Added
Mg Recovered
% Recovery
Mean %
Recovery % RSD
Rosuvastatin
50 % 25.0 24.86 101.6 101.9 0.3
100 % 25.0 49.15 100.4 100.5 0.2
150 % 25.0 73.07 99.5 99.3 0.2
Ezetimibe
50 % 25.0 25.07 102.4 103.0 0.6
100 % 25.0 50.34 102.8 102.8 0.1
150 % 25.0 76.15 103.7 103.6 0.1
Precision
The % RSD for precision was found to be 0.4 and 0.7 for Rosuvastatin and Ezetimibe
Table. III Precision studies of Rosuvastatin and ezetimibe.
Precision Label Claim
Of RSV
Label claim Of EZE
Mean Assay % Of RSV
Mean Assay % OF EZE
% RSD Of RSV
% RSD Of EZE
Set-I 10.29 9.63
102.5 95.7 0.4 0.7
Set-II 10.26 9.57
Set-III 10.31 9.66
Set-IV 10.23 9.54
Set-V 10.20 9.52
Set-VI 10.21 9.50
Limit of quantification (LOQ) and limit of detection (LOD)
The LOD and LOQ were found to be 0.0282 μg/ml and 0.0853 μg/ml for Rosuvastatin and
the LOD and LOQ for Ezetimibe were 0.0297 μg/ml and 0.0901 μg/ml respectively.
System suitability
Standard response of Rosuvastatin and ezetimibe were found to be 0.2 % and 0.1 % RSD
respectively. System is specific and precise.
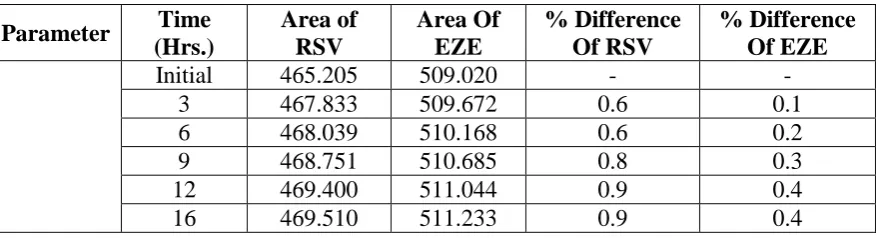
Solution stability
The Sample solution of Rosuvastatin and Ezetimibe were stable for 16 hrs to 24 hrs time
period. Difference between the sample solution was according to 0.6 to 0.9 % and 0.1 to 0.4
% for Rosuvastatin and ezetimibe respectively. (Table.IV)
Table. IV. Solution Stability studies of Rosuvastatin & Ezetimibe.
Parameter Time
(Hrs.) Area of RSV Area Of EZE % Difference Of RSV % Difference Of EZE
Initial 465.205 509.020 - -
3 467.833 509.672 0.6 0.1
6 468.039 510.168 0.6 0.2
9 468.751 510.685 0.8 0.3
12 469.400 511.044 0.9 0.4
16 469.510 511.233 0.9 0.4
Filter Compatibility
Sample solution of Rosuvastatin and ezetimibe were filtered through the 0.45 PVDF filter
and difference between the sample solution of Rosuvastatin and ezetimibe were accordingly
[image:9.595.81.523.488.607.2]Table. V Filter Compatibility of Rosuvastatin and Ezetimibe
Parameter Time
(Hrs.) Area of RSV Area Of EZE % Difference Of RSV % Difference Of EZE
Initial 471.231 512.250 - -
3 ml 470.975 510.933 -0.1 -0.3
5 ml 468.937 507.194 -0.5 -1.0
7 ml 467.255 506.947 -0.8 -1.0
Robustness: Usually a slight change in flow rate, Column temperature, etc. affects the
chromatographic response such as retention time, tailing factor and theoretical plates etc.
During this study the Theoretical plates were found to be more than 2000 for both the drugs
and at the same time the % RSD was found to be < 2.0% (0.1-0.6% and 0.2-0.9 % for
Rosuvastatin and Ezetimibe respectively) indicating that the proposed method is robust. The
[image:10.595.69.530.350.512.2]results were shown in Table.VI.
Table. VI Robustness studies of Rosuvastatin & Ezetimibe.
Parameter Mean Area
of RSV Mean Area of EZE % RSD OF RSV % RSD OF EZE Column Temperature
CT 20 C 389.915 475.571 0.4 0.7
CT 25 C 386.247 466.344 0.1 0.2
CT 30 C 390.154 477.225 0.4 0.8
Flow Rate
Flow Rate 1.4 391.729 479.725 0.5 0.4
Flow Rate 1.5 386.247 466.344 0.1 0.2
Flow Rate 1.7 340.864 421.123 0.3 0.3
Wavelength
WL-230 390.556 480.548 0.4 0.4
WL-232 386.247 466.344 0.1 0.2
WL-234 388.696 485.390 0.6 0.9
Assay of RSV AND EZE
The proposed method was applied for the determination of Rosuvastatin and Ezetimibe. And
The % Assay was found 102% and 98.9 % for Rosuvastatin and ezetimibe.(Table.VII)
Table. VII Assay of Rosuvastatin and Ezetimibe.
Formulations Label claim (mg) AmountFound (mg) Assay (%)
RSV EZE RSV EZE RSV EZE
Formulation-I 10 10 10.20 9.89 102.0 % 98.9 %
Formulation-II 10 10 10.20 9.87 102.0 % 98.7 %
Forced degradation studies: Rosuvastatin is highly resistant towards acidic, alkaline,
oxidation, neutral, Humidity and thermal degradations as the percentage of degradation was
[image:10.595.68.534.618.679.2]for RSV and EZE were found 6 to 5 %. And there were no degradation found in neutral
studies. Thermal degradation was found to be 20 -18 % for RS and E E at 105 C 24 Hrs.
and also Humidity degradation was found to be 20 to 15% in Rosuvastatin and ezetimibe.
[image:11.595.52.546.189.631.2]The degradation studies and specificity results were shown in Table.VIII.
Table. VIII Forced degradation studies of Rosuvastatin & Ezetimibe.
Stress Conditions % Recovered % Decomposed Purity Angle Purity Threshold
Rosuvastatin
Acidic Degradation 85.8 16.2 0.758 0.899
Alkaline Degradation 91.6 10.4 0.712 0.844
Oxidative Degradation 87.6 14.4 1.641 4.620
Neutral Degradation 101.2 - 0.691 0.925
Thermal Degradation 81.4 20.6 0.735 6.992
Humidity Degradation 88.1 13.9 0.575 0.674
Stress Conditions % Recovered % Decomposed Purity Angle Purity Threshold
Ezetimibe
Acidic Degradation 80.6 17.4 2.416 4.022
Alkaline Degradation 87.7 10.3 1.011 2.526
Oxidative Degradation 92.8 5.2 40.837 90.000
Neutral Degradation 98.3 - 1.801 4.939
Thermal Degradation 84.5 13.5 0.755 17.140
Humidity Degradation 80.2 17.8 0.484 1.541
Figure. 5. Alkaline degradation of RSV and EZE.
Figure. 6. Neutral degradation of Rosuvastatin and ezetimibe.
[image:12.595.142.452.538.702.2]Figure. 8. Thermal degradation of Rosuvastatin and Ezetimibe.
Figure. 9. Humidity degradation of RSV and EZE.
CONCLUSION
The High performance liquid chromatography method was developed for determination of
RSV and EZE in Pharmaceutical formulations. Method was found to be precise and accurate
as can be reflected from validation parameter data. Developed method was efficiently applied
for determination of RSV and EZE in capsule formulations and there for method can be
extended for the analysis of formulation.
ACKNOWLEDGMENT
The authors are thankful to Zydus cadila Healthcare Ltd., Ahmedabad, for gifting pure API
drug sample of RSV and EZE. Authors also wish heartfelt thanks to Zydus cadila family to
get this opportunity for work. And I m very thankful to S. K. Patel College of Pharmaceutical
[image:13.595.144.453.308.485.2]REFERENCES
1. Rang HP, Dale MM, Ritter J M, Moore P.K., Pharmacology, 6th edition, Churchill
Livingston: New York, 2009; 325-328.
2. Hardman JG, Gilman AG, Limbird LE. Goodman Gilman's: The Pharmacological Basis
of Therapeutics. 9th edition, MC Grew Hill, Medical Publishing Division New York,
1995; 971-980.
3. Tripathi KD, Essential of Medical Pharmacology, 7th edition, Antihypolipidemic drugs,
Jaypee Brothers, New Delhi, 2013; 612.
4. Goyal R.K, Mehta , Blraman R. Derasri and Gandhi’s Element of Pharmacology, 13th
edition, B.S. Shah Prakashan, Silver oak Building Ahmedabad, 2004; 425-428.
5. Feussner G, Piesch S, Dobmeyer J, Fischer C. Genetics of type III hyperlipoproteinemia.
Genet Epidemiol, 1997; 14(3): 283-97.
6. Executive Summary of the Third Report of the National Cholesterol Education Program
(NCEP) Expert Panel on Detection, Evaluation, and Treatment of High Blood Cholesterol
in Adults (Adult Treatment Panel III). JAMA, 2000; 285(19): 2486-97.
7. Executive Summary of the Third Report of the National Cholesterol Education Program
(NCEP) Expert Panel on Detection, Evaluation, and Treatment of High Blood Cholesterol
in Adults (Adult Treatment Panel III). JAMA, 2000; 285(19): 2486-97.
8. Ford ES, Giles WH, Dietz WH. Prevalence of the metabolic syndrome among US adults:
findings from the third National Health and Nutrition Examination Survey. JAMA, 2002;
287(3): 356-9.
9. Maryadele J. O’Neil, Patricia E. Heckelman, Cherie B. Koch. The Merck Index an
encyclopedia of Chemicals, Drugs and Biologicals. Rosuvastatin, 14th edition, Merck
Research Laboratories, Merck & Co. Inc. Whitehouse Station NJ, USA, 2006; 8270.
10.Maryadele J. O’Neil, Patricia E. Heckelman, Cherie B. Koch. The Merck Index an
encyclopedia of Chemicals, Drugs and Biologicals. Ezetimibe, 14th edition, Merck
Research Laboratories, Merck & Co. Inc. Whitehouse Station NJ, USA, 2006; 8686.
11.Grundy SM, Cleeman JI, Merz CN, et al. Implications of recent clinical trials for the
National Cholesterol Program Adult Treatment Panel III guidelines. Circulation. 2004;
110:227–239.2Vol. Year 2011; (3): 498-504.
12.Singh R, Rehman Z, Current trends in forced degradation study for pharmaceutical
product development. J Pharmaceutical Education Res., 2012; 3: 54-63.
14.Sandy L. High Performance Liquid Chromatography; John Wiley and Sons 1991; 81-87.
15.Vishal V. Rajkondwar, Pramila Maini1 and Monika Vishwakarma. Characterization and
method development for estimation and validation of Rosuvastatin Calcium by UV –
visible spectrophotometry. nternational Journal of Theoretical & Applied Sciences, 2009;
1(1): 48-53.
16.Hasumati A. Raj, Sadhana J. Rajput, Jayant B. Dave and Chaggan N. Patel. Development
And Validation Of Two Chromatographic Stability-Indicating Methods For
Determination of Rosuvastatin In Pure Form And Pharmaceutical Preparation.
International Journal of ChemTech Research, 2009; 1(3): 677-689.
17.Caroline K. Hull, Paul D. Martin, Michael J. Warwick, Elizabeth Thomas. Quantification
of the N-desmethyl metabolite of Rosuvastatin in human plasma by automated SPE
followed by HPLC with tandem MS detection. Journal of Pharmaceutical and Biomedical
Analysis, 2004; 35: 609–614.
18.SafwanAshour, Soulafa Omar. Validated High-Performance Liquid Chromatographic
Method for the Estimation of Rosuvastatin Calcium in Bulk and Pharmaceutical
Formulations. Int J Biomed Sci., 2011; 7(4): 283-288.
19.Ramnath Y. Lahare, Ashish N. Phuge, Ajit L. Gite and Arjun K. Jadhav. A Review on
Ultraviolet Spectrophotometric Determination of Rosuvastatin Calcium in Marketed