http://wrap.warwick.ac.uk
Original citation:
Birch, Rebecca, Peet, Andrew C., Arvanitis, Theodoros N. and Wilson, Martin. (2014)
Sensitivity encoding for fast1H MR spectroscopic imaging water reference acquisition.
Magnetic Resonance in Medicine . ISSN 0740-3194
Permanent WRAP url:
http://wrap.warwick.ac.uk/66730
Copyright and reuse:
The Warwick Research Archive Portal (WRAP) makes this work of researchers of the
University of Warwick available open access under the following conditions.
This article is made available under the Creative Commons Attribution 4.0 International
license (CC BY 4.0) and may be reused according to the conditions of the license. For
more details see:
http://creativecommons.org/licenses/by/4.0/
A note on versions:
The version presented in WRAP is the published version, or, version of record, and may
be cited as it appears here.
Sensitivity Encoding for Fast
1
H MR Spectroscopic
Imaging Water Reference Acquisition
Rebecca Birch,
1,2Andrew C. Peet,
2,3Theodoros N. Arvanitis,
2,4and Martin Wilson
2,3*
Purpose: Accurate and fast 1H MR spectroscopic imaging (MRSI) water reference scans are important for absolute quan-tification of metabolites. However, the additional acquisition time required often precludes the water reference quantitation method for MRSI studies. Sensitivity encoding (SENSE) is a successful MR technique developed to reduce scan time. This study quantitatively assesses the accuracy of SENSE for water reference MRSI data acquisition, compared with the more commonly used reduced resolution technique. Methods: 2D MRSI water reference data were collected from a phantom and three volunteers at 3 Tesla for full acquisition (306 s); 2 reduced resolution (64 s) and SENSE R¼3 (56 s) scans. Water amplitudes were extracted using MRS quantitation software (TARQUIN). Intensity maps and Bland-Altman statistics were generated to assess the accuracy of the fast-MRSI techni-ques.Results: The average mean and standard deviation of differences from the full acquisition were 2.163.2% for SENSE and 10.3610.7% for the reduced resolution tech-nique, demonstrating that SENSE acquisition is approximately three times more accurate than the reduced resolution tech-nique. Conclusion: SENSE was shown to accurately recon-struct water reference data for the purposes of in vivo absolute metabolite quantification, offering significant improve-ment over the more commonly used reduced resolution tech-nique. Magn Reson Med 000:000–000, 2014.VC 2014 The
Authors. Magnetic Resonance in Medicine Published by Wiley Periodicals, Inc. on behalf of International Society of Medicine in Resonance. This is an open access article under the terms of the Creative Commons Attribution License, which permits use, distribution, and reproduction in any medium, provided the original work is properly cited.
Key words:
INTRODUCTION
1H Magnetic Resonance Spectroscopy (MRS) is a
noninva-sive technique which measures metabolite levels within a volume of interest (1–3). Several studies have demon-strated the value of this technique for investigating disor-ders of the central nervous system (4), with improvements in brain tumor (5,6) diagnosis (6), prognosis (7), and char-acterization (5,8) being particularly important due to the relatively poor outcome of this disease group.
The two most popular types of MRS investigation are single voxel spectroscopy (SVS) and MR spectroscopic imaging (MRSI). Single voxel spectroscopy (SVS) collects metabolic information from a single volume (voxel) of interest and is more commonly used than MRSI due to its shorter scan time (9) and relative ease of data collec-tion and analysis. However, the restriccollec-tion of informacollec-tion from a single location limits the number of appropriate clinical applications for the method. MR spectroscopic imaging (MRSI) or chemical shift imaging (CSI) is a mul-tivoxel technique which can spatially map metabolite information throughout a predefined volume (10). This technique is practically promising for the investigation of diseases such as brain tumors, where tumor heteroge-neity (11) and diffuse margins (12) are commonly observed features, with significant clinical interest. MRSI also offers advantages over SVS for investigating neuro-degenerative diseases such as Alzheimer’s (13) and neu-rometabolic disorders (4,14); where the most clinically relevant brain area may not be known in advance.
Absolute quantification of metabolite levels is challeng-ing but offers advantages over simple metabolite ratios. First, ratios can become unstable when the denominator metabolite is present at low levels; and, second, an overall reduction or increase in tissue metabolism would be diffi-cult to detect using ratios, because all metabolites may be equally affected. Absolute quantitation is most commonly performed by referencing metabolite signal amplitudes to the signal obtained from water which acts as an internal standard (15–17). This method has been shown to be effective for SVS and can be routinely performed due to a minimal increase in scan time (<20 s). However, the com-bined collection of metabolite and water reference data for MRSI results in significantly longer acquisition times, as both data sets require phase encoding for spatial local-ization (18). The additional time required for standard MRSI phase encoding may preclude absolute quantitation for routine clinical use (19).
In recent years, fast-MRSI methods have been developed to reduce the number of phase encoding steps and, there-fore, scan time. Sensitivity encoding (SENSE) is a parallel imaging technique which reduces the k-space sampling density by exploiting known spatial sensitivity profiles of multiple receiver coils; allowing more rapid spatial
1
PSIBS Doctoral Training Centre, University of Birmingham, United Kingdom.
2
Department of Oncology, Birmingham Children’s Hospital NHS Foundation Trust, Birmingham, United Kingdom.
3
School of Cancer Sciences, University of Birmingham, United Kingdom. 4
Institute of Digital Healthcare, WMG, University of Warwick, Coventry, United Kingdom.
*Correspondence to: Martin Wilson, Ph.D., Institute of Child Health, Whittall Street, Birmingham, West Midlands, B4 6NH, UK. E-mail: [email protected] Additional Supporting Information may be found in the online version of this article.
The copyright line for this article was changed on 29 September 2014 after original online publication.
Received 24 February 2014; revised 10 June 2014; accepted 14 June 2014 DOI 10.1002/mrm.25355
Published online 00 Month 2014 in Wiley Online Library (wileyonlinelibrary.c-om).
VC 2014 The Authors. Magnetic Resonance in Medicine Published by Wiley Periodicals, Inc. on behalf of International Society of Medicine in Resonance. This is an open access article under the terms of the Creative Commons Attribution License, which permits use, distribution, and reproduction in any medium, provided the original work is properly cited.
Magnetic Resonance in Medicine 00:00–00 (2014)
encoding (10,18). The amount of k-space sampling density reduction is defined by a reduction factor R (20), for exam-ple R¼3 represent a three times reduction in the number of phase encoding steps. The fully sampled information is then algorithmically reconstructed from the undersampled data from each coil and the corresponding sensitivity and noise profiles (10,18). SENSE is particularly popular for reducing MRI scan times and presents significant advan-tages over other fast techniques as it can easily be incorpo-rated within any existing MRSI pulse sequence, avoiding pulse sequence related SNR losses (10).
A simpler method for reducing MRSI scan time is known as reduced k-space acquisition (reduced resolution). This method samples fewer points in k-space, resulting in a lower resolution scan. To ensure these data can be used as a quantitation reference for higher resolution (water sup-pressed) scans, the matrix size is increased by zero-filling the outer rim of k-space, effectively interpolating the miss-ing data in the spatial domain (9). On some platforms, reduced resolution data may be collected primarily to assist postprocessing steps such as phase-correction and lineshape distortion removal; however, here we focus on its use for absolute metabolite quantitation.
Spatial resolution is theoretically preserved in the SENSE method, with an associated loss of SNR associated with higher reduction factors (20). Because SNR is extremely high for water reference data we hypothesise that SENSE will be a superior method for rapid water reference MRSI data acquisi-tion when compared with the reduced k-space acquisiacquisi-tion (the current default for the Philips MRSI protocol). In this study, we compare the accuracy of the reduced resolution and SENSE R¼3 techniques for obtaining a fast-MRSI water reference scan. To evaluate the accuracy of the two fast meth-ods—water amplitudes were compared with equivalent fully sampled MRSI water reference acquisitions. The fast method that provided water amplitudes closest to the fully sampled method was regarded as the most accurate. Data were col-lected from three volunteers and a standard MRS phantom (“braino”) to validate the proposed methodology.
METHODS
MRSI Data Collection
Data were collected from three healthy volunteers (aged between 20 and 25 years) and a MRS “braino” phantom containing 10 mM creatine hydrate, 2 mM choline chlo-ride, 5 mM dl-lactic acid, 1 mL/L Gd-DPTA (Magnevist), 12.5 mM l-glutamic acid, 7.5 mM myo-inositol, 12.5 mM N-acetyl-laspartic acid (NAA), 0.1% sodium azide, 56 mM sodium hydroxide (NaOH), and 50 mM potas-sium phosphate monobasic (KH2PO4) (21). This study
had full ethical approval and informed consent.
All MR scanning was performed on a 3 Tesla (T) Phi-lips Achieva TX MR system with a 32-channel head coil at Birmingham Children’s Hospital, UK. An initial T1 weighted three-dimensional Fast Low Angle SHot (FLASH) MRI 1mm isotropic reference scan was obtained for MRSI grid positioning. All MRSI scans were manually positioned above the corpus callosum (see Figure 1a for example) with the following acquisition parameters: field of view (FOV) matrix size 15 13; voxel size 13 mm 13 mm 13 mm; TE¼35 ms; repetition time¼2 s; half-echo acquisition mode. In each case PRESS localization was used to excite a 66 voxel region (78 mm78 mm 13 mm) centrally within the FOV. This corresponded to a fully exited 5 5 voxel region with a1=2voxel
mar-gin outside the PRESS excitation region. Because NMR visible water concentrations are fairly constant throughout the head (40 M) we intentionally included partially excited voxels (77 region) in the analysis to ensure the fast methods can be used to accurately reconstruct non-uniform water distributions. In all MRSI examinations, the points of k-space outside an elliptical boundary were not sampled to reduce acquisition time (22). A k-space hamming filter was applied as a postprocessing step to reduce ringing artifacts. No additional averaging was per-formed during k-space acquisition.
[image:3.612.60.408.74.306.2]Initial studies comparing SENSE with a full MRSI acquisition highlighted a systematic difference in the
FIG. 1.a:MRSI geometry for vol-unteer 2 including 6 6 voxel PRESS volume which is collocated with the shim box shown in orange. b: Water amplitude maps extracted from volunteer 2 for full acquisition; reduced resolution acquisition; and SENSE acquisition (R¼3).
scaling factor between SENSE and no SENSE acquisi-tions. This was due to a rescaling step required for SENSE reconstruction. To allow a true comparison between the SENSE R¼3 and reduced resolution method, SENSE reconstruction was also enabled for the reduced resolution and full acquisition scans with a speedup factor of R¼1 (no undersampling). This resulted in a consistent scaling factor between the full acquisition, reduced resolution and SENSE methods. For the remainder of the manuscript the following terms will be used to describe the MRSI acquisitions used: “full acquisition (no-SENSE)” will refer to the fully sampled MRSI grid without SENSE scaling, 153 phase encoding steps¼5 min 6 s; “full acquisition” will refer to the fully sampled MRSI grid with sensitivity scaling (R¼1), 153 phase encoding steps¼5 min 6 s; “reduced resolution acquisition” will refer to a 2 reduction in k-space sam-pling for both dimensions with sensitivity scaling (R¼1), 32 phase encoding steps¼1 min 4 s; and “SENSE acquisition” will refer to the standard SENSE reconstruction with a 3 reduction k-space sampling for both dimensions (R¼3), 28 phase encoding steps¼56 s.
For the patient and phantom studies MRSI scans were performed in succession with identical field of view and PRESS geometries within a session. The following scans were collected for both patient and phantom data: full acquisition no-SENSE; full acquisition (R¼1); SENSE R¼3 acquisition; and reduced resolution acquisition.
Data Analysis
MRSI spectra were exported from the scanner worksta-tion into the DICOM format and imported into the TAR-QUIN MRS quantitation software (23) for analysis. Water amplitudes were extracted from the time-domain data by back extrapolating the initial part of the FID to time¼0 (details of method given in Wilson et al) (23). Water amplitudes for each voxel within the FOV were then imported into MATLAB R2012a for statistical analysis. Grid maps of intensity were generated for no SENSE, SENSE R¼1, SENSE R¼3 and reduced resolution 2.
All voxels within the PRESS box (VOI) and the sur-rounding partially exited region (7 7 grid) were used for subsequent analysis. Bland Altman plots and associ-ated statistics (24) were used to measure the agreement between the different MRSI acquisition protocols.
RESULTS
Scaling of Sensitivity Encoded MRSI Data in Comparison with the Full Acquisition (no-SENSE)
Before the comparison between the faster MRSI methods, a quantitative analysis between the full acquisition and full acquisition (no-SENSE) data were performed to vali-date the subsequent use of full acquisition (R¼1) as a valid comparator data set. Figure 2 shows a Bland Alt-man plot between the full acquisition methods for a phantom and volunteer data set. The mean difference and standard deviations in amplitude between the no-SENSE and SENSE R¼1 full acquisitions were 0.1363.62% for a phantom and0.4865.51% for vol-unteer data (Fig. 2).
Comparison between Full Acquisition and Fast-MRSI Techniques
A 6 6 voxel VOI was excited using PRESS (Fig. 1a) and water amplitude (Fig. 1b) maps were produced for all MRSI acquisition methods for both phantom and vol-unteer data. A visual inspection of the water amplitude intensity maps (Fig. 1b) show that SENSE R¼3 gives a more accurate reconstruction of the full acquisition data when compared with the reduced resolution technique.
[image:4.612.66.550.75.258.2]Table 1 shows the mean differences and standard devi-ations between the full acquisition versus SENSE and reduced resolution acquisitions for the phantom and all the volunteers. These were used to quantitatively deter-mine any systematic or randomly distributed differences between full acquisition and the fast-MRSI acquisitions. For SENSE acquisition a mean difference in water ampli-tude of 2.3162.09% was observed for a phantom, low variability is observed about the mean. The reduced reso-lution technique showed greater variability with a mean
difference and standard deviation in water amplitude for the phantom of 11.1611.1%.
In general the results are consistent between the vol-unteers and similar errors are seen between the phantom and volunteer results for the reduced resolution and SENSE acquisitions. The average mean and standard deviation was 2.163.2% for the SENSE acquisition and 10.3610.7% for the reduced resolution technique. Therefore, we can conclude that the SENSE acquisition is approximately three times more accurate than the reduced resolution technique, both in terms of system-atic bias and randomly distributed differences. These sta-tistics are consistent with the visual differences seen in the intensity map in Figure 1.
Water Amplitude MRSI Reproducibility
Full acquisition (R¼1) and SENSE (R¼3) MRSI scans were acquired in duplicate for both the “braino” phan-tom and a volunteer data set to measure the reproduci-bility of the scans. The mean difference and its standard deviation between repeats were determined.
For the full acquisition (R¼1) data a mean difference of0.0260.26% was found for water amplitude for the “braino” phantom, and0.4560.8% for volunteer data. An increase of SENSE factor to R¼3 produced a mean
amplitude difference between “braino” scans of 0.2660.34% and a mean difference of 0.9461.1% for the volunteer. In both cases, the reproducibility was bet-ter for the phantom, suggesting that subject motion causes an additional random error of less than 1%.
Phantom Metabolite Concentrations Using SENSE and Reduced Resolution Water Reference Data
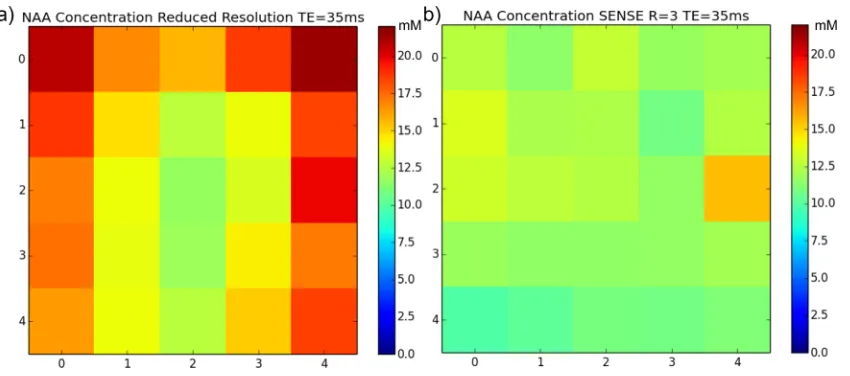
SENSE (R¼3) and reduced resolution water reference data were used to estimate absolute metabolite concentrations found in the braino phantom. The same fully sampled water suppressed data were used for both analyses to ensure any differences could be attributed to the water ref-erence data. The following metabolites were present in the phantom at known concentrations: 2.5 mM total N-acetyl-laspartic acid (tNAA), 10 mM total Creatine (tCr), 2 mM total Choline (tCho), and 12.5 mM glutamate (Glu). Mean metabolite concentrations were extracted from the central 55 voxel region, and estimated values were found to be more accurate for the SENSE water data in comparison with the reduced resolution technique. For SENSE : tNAA concentration¼11.9861.14 mM, tCr¼9.7561.49 mM, tCho¼2.7260.47 mM, and Glu¼13.761.07 mM. For the reduced resolution technique : tNAA concentration ¼16.0162.71 mM, tCr¼12.9262.29 mM, tCho¼3.616
0.72 mM, and Glu¼18.3963.42 mM. A consistent overesti-mation in concentrations was found with the reduced reso-lution technique (Fig. 3a) due to an incorrect reduction of the water amplitude at the PRESS box edges (Fig. 1). SENSE provides a more uniform metabolite distribution as expected with a phantom.
Parietal White Matter Metabolite Concentrations Using SENSE and Reduced Resolution Water Reference Data
[image:5.612.60.301.106.228.2]Absolute metabolite quantitation using the TARQUIN algorithm was performed on the volunteer data to dem-onstrate the feasibility of combining fully sampled water suppressed data with rapidly collected MRSI water refer-ence data. Left and right parietal white mater voxels were analyzed for each of the three volunteers resulting
Table 1
Comparison of Mean Differences between Reduced Resolution 2 and SENSE R¼3 Versus Full Acquisition MRSI
Water amplitude/ max amplitude (%)
Mean difference SD SENSE R¼3
Vs full acquisition
Braino phantom 2.31 2.09 Volunteer 1 0.75 2.95 Volunteer 2 2.49 3.40 Volunteer 3 3.17 3.21 Reduced
resolution x2 Vs full acquisition
Braino phantom 11.11 11.09 Volunteer 1 9.87 10.16 Volunteer 2 11.19 11.12 Volunteer 3 9.95 10.96
FIG. 3. NAA concentration map for a phantom calculated from reduced resolution water reference data (a) and SENSE (R¼3) water refer-ence data (b) for the central 55 voxel region. [Color figure can be viewed in the online issue, which is available at wileyonlinelibrary.com.]
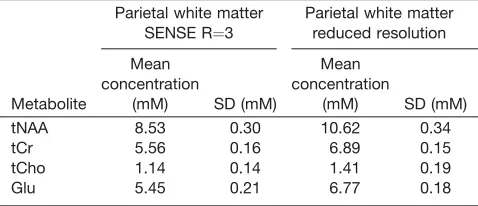
[image:5.612.98.523.540.728.2]in six voxels. Supporting Figure S1, which is available online, shows a typical example spectrum for this brain region. Table 2 shows the average volunteer metabolite concentrations for tNAA, tCr, tCho, and Glu calculated from the six voxels. Metabolite concentrations were determined using SENSE (R¼3) and reduced resolution water reference data. Concentrations calculated using the SENSE water data were found to be more consistent with those found in literature for healthy volunteers (25,26) whereas the reduced resolution technique was found to over-estimate these values.
DISCUSSION
The purpose of this study was to validate the use of SENSE for collecting fast-MRSI water reference data of the brain for the absolute quantification of metabolites. SENSE and reduced resolution methods were compared with: (i) equivalent fully sampled data sets from volun-teer and phantom data; (ii) known metabolite concentra-tions from phantom data, and (iii) metabolite concentrations from healthy volunteers. In each of these cases it was found that SENSE MRSI offers a significant improvement in accuracy over the reduced resolution method. To the best of the author’s knowledge this is the first study to have validated the use of SENSE for this purpose.
The improvement in accuracy of SENSE over the reduced resolution method is expected, because reduced resolution involves zero-filling in k-space, which is equivalent to interpolation. For a given spatial dimen-sion the point spread function of the reduced resolution method is inversely proportional to the number of the acquired phase encoding points (for a fixed field of view)—rather than the number of zero-filled points. The SENSE method is based on k-space reconstruction rather than interpolation, and, therefore, provides improved resolution over a time-equivalent reduced resolution method.
Figure 1 shows that the SENSE method outperforms the reduced resolution method, particularly at the edges of the PRESS excitation region. Whilst this study has not directly tested the accuracy of the methods on greatly heterogeneous tissue water concentrations distributions, the heterogeneity caused by the PRESS excitation bound-ary is a valid model for testing accuracy. We expect that
a similar investigation into heterogeneous tissue water distributions, for example in pathology, would yield comparable results. Furthermore, accurate quantitation (and, therefore, water amplitude measures) close to the boundary of the PRESS excitation region are desirable, and it is clear from this work that SENSE outperforms the reduced resolution method in these regions.
Absolute metabolite quantitation is generally preferred over using metabolite ratios because, in the case of ratios, the source of variation for a given ratio cannot be determined as to whether it is due to a relative increase in one metabolite or a decrease in the other (15). Whilst fast and accurate absolute metabolite quantitation for MRSI was the main goal for this work; water reference data can also be used to determine the “proton resonance frequency shift” for the purposes of noninvasive ther-mometry (27). Therefore, we anticipate this type of acquisition may also be useful for providing absolute temperate maps across the brain.
Pattern recognition performed directly on spectral data has been used previously as an alternative to absolute quantitation. These methods offer the advantage of being straightforward to implement because statistical meth-ods, such as independent component analysis, are read-ily available. However, these widely available methods are not currently optimized for MRS specific issues such as variable line widths, unstable baselines, and residual water. Therefore, pattern recognition applied to the results from absolute quantitation offers the best of both approaches and has been demonstrated in pediatric and adult brain tumor studies (28,29).
As with all MR methods, the protocol used in this study represents a compromise between scan-time, spa-tial resolution (voxel size) and unwanted T1/T2 weight-ing. Whilst MRSI resolution is comparatively poor, the additional spectral dimension allows a unique noninva-sive view on tissue metabolism that makes it well suited for the investigation of certain diseases, in particular cancer. The MRSI parameters chosen for this study rep-resent typical values for clinical MRSI where short scan times are particularly important. Whilst partial volume effects and incomplete relaxation are inevitable, clini-cally useful information can still be obtained from voxel sizes and repetition times used in this study.
The data quality of metabolite information acquired using SENSE has previously been assessed by several groups concluding that no significant losses were found in comparison with full acquisition data (18,30,31). How-ever, Van Cauter et al found high SNR losses in lower concentration metabolites such as myo-inositol when using a SENSE factor of R¼3.6 (19). Therefore, to pre-serve these lower concentration metabolites we propose the use of SENSE R¼1 for collection of metabolite data and SENSE R¼3 for water reference data collection reducing the scan time for both metabolite and water ref-erence data from 10 min 16 s to 6 min 6 s.
[image:6.612.61.300.127.230.2]In addition to SENSE, two other methods have been shown to provide a promising acceleration of MRSI data acquisition: (i) EPI based methods such as PEPSI (32,33) and (ii) compressed sensing (34). In this work, we chose to focus on SENSE due to its wider commercial availabil-ity and, therefore, greater clinical relevance. However,
Table 2
Average Metabolite Concentrations, Using SENSE R¼3 and Reduced Resolution Water Data, across Three Volunteers, the Mean Is Taken from 6 Parietal White Matter Voxels (Two from Each Volunteer)
Parietal white matter SENSE R¼3
Parietal white matter reduced resolution
Metabolite
Mean concentration
(mM) SD (mM)
Mean concentration
(mM) SD (mM) tNAA 8.53 0.30 10.62 0.34
tCr 5.56 0.16 6.89 0.15
tCho 1.14 0.14 1.41 0.19
the underlying strategy of sacrificing SNR (rather than resolution) for reducing scan time is generic. Unlike MRSI water suppressed scans for metabolite signal mea-surement, MRSI water reference data have an extremely high SNR; therefore, it is likely that other fast methods that sacrifice SNR for a reduction in scan time will be similarly successful. In particular, compressed sensing, in isolation or combination with SENSE, may offer fur-ther reductions in scan time and would, fur-therefore, make an interesting extension to this work.
CONCLUSIONS
SENSE has been shown to be approximately three times more accurate than the reduced resolution approach for acquiring fast MRSI water reference maps. Differences in water amplitude levels using SENSE were found to be less than 4% when compared with an equivalent full resolution acquisition. These findings validate the use of SENSE MRSI to obtain accurate water reference data in a feasible time frame for the purposes of absolute metabo-lite quantitation in a clinical setting.
ACKNOWLEDGMENTS
This work was supported by the Engineering and Physi-cal Sciences Research Council [EP/F50053X/1] and National Institute for Health Research.
REFERENCES
1. Liang ZP, Lauterbur PC. A generalized series approach to MR spectro-scopic imaging. IEEE Trans Med Imaging 1991;10:132–137.
2. Harris LM, Davies NP, Wilson S, Macpherson L, Natarajan K, English MW, Brundler M, Arvanitis TN, Grundy RG, Peet AC. Short echo time single voxel 1H magnetic resonance spectroscopy in the diagno-sis and characterisation of pineal tumours in children. Pediatr Blood Cancer 2011;57:972–977.
3. Howe FA, Opstad KS. 1H MR spectroscopy of brain tumours and masses. NMR Biomed 2003;16:123–131.
4. Oz G, Alger JR, Barker PB, et al. Clinical proton MR spectroscopy in central nervous system disorders. Radiology 2014;270:658–679. 5. Wilson M, Cummins CL, Macpherson L, Sun Y. Magnetic resonance
spectroscopy metabolite profiles predict survival in paediatric brain tumours. Eur J Cancer 2013;49:457–464.
6. Preul MC, Caramanos Z, Collins DL, Villemure JG, Leblanc R, Olivier A, Pokrupa R, Arnold DL. Accurate, noninvasive diagnosis of human brain tumors by using proton magnetic resonance spectroscopy. Nat Med 1996;2:323–325.
7. Astrakas LG, Zurakowski D, Tzika AA, Zarifi MK, Anthony DC, De Girolami U, Tarbell NJ, Black PM. Noninvasive magnetic resonance spectroscopic imaging biomarkers to predict the clinical grade of pediatric brain tumors to predict the clinical grade of pediatric brain tumors. Clin Cancer Res 2004;10:8220–8228.
8. Sorensen AG. Magnetic resonance as a cancer imaging biomarker. J Clin Oncol 2006;24:3274–3281.
9. Skoch A, Jiru F, Bunke J. Spectroscopic imaging: basic principles. Eur J Radiol 2008;67:230–239.
10. Barker PB, Lin DDM. In vivo proton MR spectroscopy of the human brain. Prog Nucl Magn Reson Spectrosc 2006;49:99–128.
11. Peet AC, Arvanitis TN, Auer DP, et al. The value of magnetic resonance spectroscopy in tumour imaging. Arch Dis Child 2008;93:725–727. 12. Steffen-Smith EA, Shih JH, Hipp SJ, Bent R, Warren KE. Proton
mag-netic resonance spectroscopy predicts survival in children with dif-fuse intrinsic pontine glioma. J Neurooncol 2011;105:365–373. 13. Colla M, Ende G, Bohrer M, Deuschle M, Kronenberg G, Henn F,
Heuser I. MR spectroscopy in Alzheimer’s disease: gender differences in probabilistic learning capacity. Neurobiol Aging 2003;24:545–552.
14. Davison JE, Davies NP, Wilson M, Sun Y, Chakrapani A, McKiernan PJ, Walter JH, Gissen P, Peet AC. MR spectroscopy-based brain metabolite profiling in propionic acidaemia: metabolic changes in the basal ganglia during acute decompensation and effect of liver trans-plantation. Orphanet J Rare Dis 2011;6:19.
15. Tong Z, Yamaki T, Harada K, Houkin K. In vivo quantification of the metabolites in normal brain and brain tumors by proton MR spectros-copy using water as an internal standard. Magn Reson Imaging 2004; 22:735–742.
16. Ernst T, Kreis R, Ross B. Absolute quantitation of water and metabo-lites in the human brain. I. Compartments and water. J Magn Reson Ser B 1993;102:1–8.
17. Keevil SF, Barbiroli B, Brooks JC. Absolute metabolite quantification by in vivo MR spectroscopy: II. A multicentre trial of protocols for in vivo localised proton studies of human brain. Magn Reson Imaging 1998;16:1093–1106.
18. Bonekamp D, Smith MA, Zhu H, Barker PB. Quantitative SENSE-MRSI of the human brain. Magn Reson Imaging 2010;28: 305–313.
19. Van Cauter S, Sima DM, Luts J, et al. Reproducibility of rapid short echo time CSI at 3 tesla for clinical applications. J Magn Reson Imag-ing 2013;37:445–456.
20. Pruessmann KP, Weiger M, Sheidegger MB, Boesiger P. SENSE: sensitivity encoding for fast-MRI. Magn Reson Med 1999;42:952– 962.
21. Soreni N, Noseworthy MD, Cormier T, Oakden WK, Bells S, Schachar R. Intraindividual variability of striatal 1 H-MRS brain metabolite measurements at 3 T B. Magn Reson Imaging 2006;24: 187–194.
22. Maudsley AA, Matson GB, Hugg JW, Weiner MW. Reduced phase encoding in spectroscopic imaging. Magn Reson Med 1994;31:645– 651.
23. Wilson M, Reynolds G, Kauppinen RA, Arvanitis TN, Peet AC. A constrained least-squares approach to the automated quantitation of in vivo1H magnetic resonance spectroscopy data. Magn Reson Med
2011;65:1–12.
24. Bland JM, Altman DG. Statistical methods for assessing agreement between two methods of clinical measurement. Lancet 1986;1:307– 310.
25. Wiebenga OT, Klauser AM, Nagtegaal GJA, Schoonheim MM, Barkhof F, Geurts JJG, Pouwels PJW. Longitudinal absolute metabolite quantification of white and gray matter regions in healthy controls using proton MR spectroscopic imaging. NMR Biomed 2014;27:304– 311.
26. Natt O, Bezkorovaynyy V, Michaelis T, Frahm J. Use of phased array coils for a determination of absolute metabolite concentrations. Magn Reson Med 2005;53:3–8.
27. Bainbridge A, Kendall GS, Vita ED, Hagmann C, Kapetanakis A, Cady EB, Robertson NJ. Regional neonatal brain absolute thermometry by (1) H MRS. NMR Biomed 2012;26:416–423.
28. Opstad KS, Ladroue C, Bell BA, Griffiths JR, Howe FA. Linear dis-criminant analysis of brain tumour (1)H MR spectra: a comparison of classification using whole spectra versus metabolite quantification. NMR Biomed 2007;20:763–770.
29. Davies NP, Wilson M, Harris LM, Natarajan K, Lateef S, Macpherson L, Sgouros S, Grundy RG, Arvanitis TN, Peet AC. Identification and characterisation of childhood cerebellar tumours by in vivo proton MRS. NMR Biomed 2008;21:908–918.
30. Dydak U, Meier D, Lamerichs R, Boesiger P. Trading spectral separa-tion at 3T for acquisisepara-tion speed in multi spin-echo spectroscopic imaging. AJNR Am J Neuroradiol 2006;27:1441–1446.
31. Dydak U, Weiger M, Pruessmann KP, Meier D, Boesiger P. Sensitiv-ity-encoded spectroscopic imaging. Magn Reson Med 2001;46:713– 722.
32. Posse S, Tedeschi G, Risinger R, Ogg R, Le Bihan D. High speed 1H spectroscopic imaging in human brain by echo planar spatial-spectral encoding. Magn Reson Med 1995;33:34–40.
33. Mansfield P. Spatial mapping of the chemical shift in NMR. Magn Reson Med 1984;1:370–386.
34. Geethanath S, Baek H-M, Ganji SK, Ding Y, Maher EA, Sims RD, Choi C, Lewis MA, Kodibagkar VD. Compressive sensing could accel-erate 1H MR metabolic imaging in the clinic. Radiology 2012;262: 985–994.