Original citation:
Spicer, Jake and Sanborn, Adam N. (2017) A rational approach to stereotype change. In:
CogSci 2017 : 39th Annual Meeting of the Cognitive Science Society, London, UK, 26–29 Jul
2017. Published in: Proceedings of the 39th Annual Conference of the Cognitive Science
Society (In Press)
Permanent WRAP URL:
http://wrap.warwick.ac.uk/90820
Copyright and reuse:
The Warwick Research Archive Portal (WRAP) makes this work by researchers of the
University of Warwick available open access under the following conditions. Copyright ©
and all moral rights to the version of the paper presented here belong to the individual
author(s) and/or other copyright owners. To the extent reasonable and practicable the
material made available in WRAP has been checked for eligibility before being made
available.
Copies of full items can be used for personal research or study, educational, or not-for-profit
purposes without prior permission or charge. Provided that the authors, title and full
bibliographic details are credited, a hyperlink and/or URL is given for the original metadata
page and the content is not changed in any way.
Publisher’s statement:
http://cognitivesciencesociety.org/wp-content/uploads/archival/cognitivesciencesociety.org/conference_archival.html
A note on versions:
The version presented here may differ from the published version or, version of record, if
you wish to cite this item you are advised to consult the publisher’s version. Please see the
‘permanent WRAP URL’ above for details on accessing the published version and note that
access may require a subscription.
A Rational Approach to Stereotype Change
Jake Spicer ([email protected])
Department of Psychology, Humanities Building, University of Warwick, Coventry, UK
Adam Sanborn ([email protected])
Department of Psychology, Humanities Building, University of Warwick, Coventry, UK
Abstract
Existing theories of stereotype change have often made use of categorisation principles in order to provide qualitative expla-nations for both the revision and maintenance of stereotypical beliefs. The present paper examines the quantitative methods underlying these explanations, contrasting both rational and heuristic models of stereotype change using participant data and model fits. In a comparison of three models each simulat-ing existsimulat-ing descriptions of stereotype change, both empirical data and model fits suggest that stereotypes are updated using rational categorisation processes. This presents stereotype use as a more rational behaviour than may commonly be assumed, and provides new avenues of encouraging stereotype change according to rational principles.
Keywords:Stereotypes; Categorisation; Rational Behaviour
Introduction
Stereotypes have often been found to be resistant to change, with beliefs and expectations regarding a group often per-sisting even when faced with directly contradictory infor-mation (Hilton & von Hippel, 1996). This presents a prob-lem when trying to combat stereotypes underlying prejudice or discrimination through out-group exposure as has often been suggested by theories such as the Contact Hypothesis (Allport, 1954), as there is no assurance that simply demon-strating the inaccuracy of these beliefs will be effective in encouraging revision. It is therefore necessary to examine the processes by which stereotypes are updated with experi-ence, and, in cases of stereotype persistexperi-ence, determine how counter-stereotypical information can be disregarded in order to develop better methods to encourage change.
Past research into this field has offered three possible pro-cesses of stereotype revision: book-keeping, in which the stereotype is slowly adjusted with each relevant observation;
conversion, in which the stereotype can undergo sudden and
drastic changes in response to particularly notable contradic-tory exemplars; andsubtyping, in which counter-stereotypical evidence is isolated from the rest of the category in a dis-tinct subgroup, ignored when making category judgements. This presents three potential explanations for stereotype per-sistence: stereotype-incongruent exemplars may be noted via book-keeping but remain out-weighed by prior stereotypical beliefs; these exemplars may not have been sufficiently sig-nificant to evoke change via conversion; or these exemplars may have been excluded entirely via subtyping.
This distinction was examined by Weber and Crocker (1983) by manipulating the presentation format of counter-stereotypical evidence in summaries of lawyers: equal
amounts of stereotype-incongruent evidence were either con-centrated into only a few exemplars, or dispersed across many exemplars. This generates three competing expectations be-tween the three models: conversion suggests that these con-centrated exemplars would act as extreme disconfirmers, en-couraging significant revision to the stereotype. Conversely, subtyping would suggest that concentrating incongruent ev-idence should make it easier to isolate, thereby preserving existing stereotypical beliefs. Book-keeping, meanwhile, fo-cuses only on the amount of data rather than the presen-tation format, and so suggests no difference between these conditions. Measures of the strength of stereotypical be-liefs following exposure to these exemplars were found to be stronger in the concentrated condition, supporting the subtyp-ing model, an effect that has since been replicated in a num-ber of studies (Bott & Murphy, 2007; Johnston & Hewstone, 1992).
This depicts stereotype persistence as an issue of categori-sation, occurring where counter-stereotypical group members are placed in a distinct subgroup rather than integrated into existing structures. The mechanisms underlying stereotype revision could then be well described by existing models of categorisation, particularly those which perform a similar process of partitioning a category into lower-order subgroups. One key example of such a model is the Rational Model of Categorisation (RMC) developed by Anderson (1991), which organises a category into ‘clusters’ of exemplars based on similarities in observed features. The organisation of these clusters then determines the impact of stored data on subse-quent judgements, with larger clusters tending to have more influence on expectations of given traits appearing in the cat-egory.
than it may initially seem, and so could be fought using simi-larly rational mechanisms to encourage stereotype change.
The present study therefore presents a rational approach to stereotype use; in the following paper, we develop several candidate models to approximate the existing depictions of stereotype revision, contrast the predictions of these models with participant data to assess their accuracy, and use these findings to offer some insight into the process of stereotype change.
Model Details
We began by developing an edited version of the RMC in order to examine the categorical explanation proposed for the subtyping effect. This made use of the standard version of the RMC using discrete exemplar dimensions as defined by Anderson (1991), chosen for its reasonable level of simplicity and ease of application to the design of Weber and Crocker (1983). The RMC assigns exemplars sequentially to a cluster based on similarities in observed features using a Bayesian model to approximate the ideal partition:
p(k|f) = p(k)p(f|k)
∑kp(k)p(f|k)
(1)
wherekis the cluster and f is the feature set of the exemplar under consideration. This posterior probability is calculated for all existing clusters as well as a new potential cluster, with the highest probability determining assignment. Following Anderson (1991), the prior probability was defined as:
p(k) =
cnk
(1−c) +cn ifkis old (1−c)
(1−c) +cn ifkis new
(2)
wherenkis the number of exemplars in clusterk,nis the total
number of members assigned to the partition, andcis a cou-pling parameter describing the probability of two exemplars being grouped together independent of any observations.
The likelihood also followed the format of Anderson (1991):
p(f|k) =
∏
i
pi(j|k) (3)
where the exemplar’s features are divided into dimensionsi
holding values j. As stated above, the discrete form of this probability was used, in keeping with the exemplar structure used by Weber and Crocker (1983):
pi(j|k) =
nj+αj
nk+α0
(4)
wherenjis the number of exemplars in clusterkshowing trait
value jon dimensioni,nk is the number of cluster members
showing a value on that dimension andαjis a parameter
re-flecting the prior expectation of the occurrence of that value, whileα0is the sum of these alpha values.
Once a partition has been generated, the model is then able to calculate a probability value measuring the likelihood of a
new group member exhibiting a congruent trait value on any dimension. This is done by taking an average of the rate of congruent traits in each cluster weighted by the probability of that cluster:
p(con) =
∑
k
p(k)p(con|k) (5)
wherep(con|k)follows the format of Equation 4, focussing on congruent trait values. This explains how isolating incon-gruent data in a distinct subtype mitigates its impact: smaller clusters provide less evidence to outweigh prior expectations, here represented by theαparameter. As such, there is less
confidence that future members of the incongruent cluster will demonstrate similar trait values, while the larger con-gruent cluster carries more certainty. To illustrate, consider a case in which 30 exemplars, 20 congruent and 10 incon-gruent, are either integrated or segregated. For the purposes of this illustration,α=1 for both congruent and incongruent
traits, andc=1, meaning no new cluster is considered:
As this shows, stereotype-congruency is estimated to be more probable in the segregated case because the α values are more impactful in the smaller cluster, offsetting the actual ratio of traits to a greater degree.
Stereotypes as Prior Clusters
As the category in question is a familiar social group with which participants are likely to have previous experience, the model included a cluster of exemplars added to the partition before exposure to the main exemplar set in order to simulate this prior knowledge. This also provided a more valid de-piction of the origins of the group stereotype by making the members of this prior cluster stereotype-congruent, as well as allowing for potential interactions between prior knowl-edge and new information, as have been observed in other categorical modelling studies (Heit, Briggs, & Bott, 2004). Exemplars in the prior cluster therefore displayed stereotype-congruent values on all stereotypical dimensions, as well as group membership on a separate dimension, while the num-ber of cluster memnum-bers was added as an additional model pa-rameter.
Alternative Models
must be compared with a more heuristic depiction of the sub-typing mechanism. A second model was therefore developed in which the segregated incongruent data is ignored rather than simply mitigated, essentially redrawing category bound-aries to exclude counter-stereotypical information. This was achieved by restricting the clusters considered when mak-ing probability estimates to only the cluster with the highest posterior probability. This restriction was based on the find-ings of Murphy and Ross (1994), which suggested that par-ticipants often only considered the most likely cluster when making probability estimates rather than all generated clus-ters. This creates an additional candidate model for assess-ment, labelled the Restricted Rational Model of Categorisa-tion (RRMC).
In addition, as a counterpoint to this ‘extreme subtyping’ model, a third model was developed in which book-keeping was enforced; this was achieved by limiting the RMC to us-ing only a sus-ingle cluster by fixus-ing thecparameter at 1, forcing all exemplars to be grouped together despite any differences in features. This ‘Single Cluster Model’ (SCM) therefore re-moves the possibility of segregating incongruent data, elimi-nating any influence of data format and focussing entirely on the ratio of traits in the partition.
These three models therefore present three different mech-anisms of stereotype revision: while both the RMC and RRMC use a partition that flexibly adapts to observed data patterns, the RRMC subsequently simplifies this partition by focussing on only one cluster, heightening any effects this representation may have generated, while the RMC remains more moderate. Conversely, the SCM focuses on trait ratios rather than data pattern, thereby dismissing any effects that may be predicted by the other candidate models.
There is, however, a key distinction between these rational and heuristic models which can be used to determine their va-lidity: in the RMC, the subtyping effect is dependent on the smaller size of the subtype cluster, meaning that increasing the size of the subtype by adding more incongruent members should reduce and ultimately eliminate this effect. In contrast, the RRMC will continue to ignore the subtype regardless of its size unless the subtype becomes so large that it is se-lected as the most likely cluster, at which point estimates will change drastically to reflect the subtype’s much lower rate of congruency. This could essentially reverse the subtyping ef-fect at higher volumes of incongruent evidence, focussing on counter-stereotypical rather than stereotypical clusters, and so bearing a closer resemblance to the conversion-effect de-scribed above. The SCM, meanwhile, is unable to exclude incongruent data at all, and therefore predicts no subtyping effect at any volume of incongruent information.
The accuracy of these models can therefore be contrasted according to the change in the subtyping effect with further exposure to stereotype-incongruent evidence: the RMC pre-dicts a reduction in subtyping at higher volumes of counter-stereotypical data; the RRMC predicts a stable subtyping ef-fect until a sudden reversal; and the SCM predicts no
sub-typing effect at any point. The following experiment there-fore set out to compare these model predictions by extend-ing the concentration design of Weber and Crocker (1983) across a higher total volume of evidence and taking measures of stereotypical beliefs throughout exposure. This also pro-vided direct behavioural data for use in assessing the fit of the candidate models for a more complete test of these pre-dictions.
Experimental Data
Method
Participants One-hundred-and-sixteen participants were selected from a University of Warwick undergraduate psy-chology class as part of a course requirement. The sample in-cluded 102 females and 14 males, while age ranged between 18 and 27 years, with a mean of 19.
Design and Materials The experiment followed the con-centration design of Weber and Crocker (1983) with an ad-ditional within-subjects manipulation of data volume: mea-sures of stereotypical beliefs were taken at fixed intervals dur-ing the observation of a set of exemplar descriptions where stereotype-incongruent information was either concentrated in a subset of exemplars or dispersed across all exemplars. Two exemplar sets were therefore created for use in the ex-periment, each containing 90 total exemplars displaying four trait dimensions: the first dimension described the occupa-tional label, and so was identical for all exemplars, while the remaining three dimensions described personality traits with three possible values (congruent, stereotype-incongruent or neutral). In both sets, two-thirds of the 270 total traits were incongruent, one-sixth were congruent and one-sixth were neutral; incongruent traits made up the major-ity in order to allow for a potential incongruent cluster to be larger than any other in the category. In the concentrated ex-emplar set, these incongruent traits were concentrated such that 60 exemplars each displayed incongruent traits on all three personality dimensions, with the congruent and neutral traits being distributed equally between the remaining exem-plars. In the dispersed exemplar set, all traits were distributed as equally as possible.
Procedure Upon arriving at the lab, participants were first randomly assigned to one of the two concentration condi-tions, determining which set of exemplars would be viewed; this was balanced to provide equal numbers, meaning 58 participants were allocated to each condition. Participants were told the experiment tested how perceptions of a group changed with experience, involving both viewing summaries of group members and answering questions about the traits of the group in general.
The experiment began by asking participants to estimate the likelihood of certain traits appearing in the category of lawyers according to the number of members in a sample of 100 lawyers displaying that trait. Estimates were requested for all 16 possible personality traits, though only 9 were used in the subsequent member summaries. This first question block therefore provided a measure of baseline beliefs before any experimental exemplars were viewed.
After providing estimates for all traits, participants began a presentation block in which member summaries were shown on screen for the participants to examine. In order to maintain attention on this information, participants were asked to rate the pleasantness of each group member on a scale of 1-10, though this measure was not used during analysis.
At set intervals of presentation, the test block was repeated, and participants were again asked to estimate the likelihood of each of the 16 traits appearing in the category to measure any changes in expectation. This occurred after viewing 6, 18, 36, 60 and 90 total exemplars, with the ratio of traits within each interval being consistent with that of the com-plete exemplar set. At the start of each test block, partici-pants were informed that though some of the questions had been asked before, they should answer based on how they felt at that point in time.
After viewing all 90 lawyer summaries and completing the final test block, the experiment ended, and participants were debriefed as to the aims and expectations of the study.
Results
Data Analysis
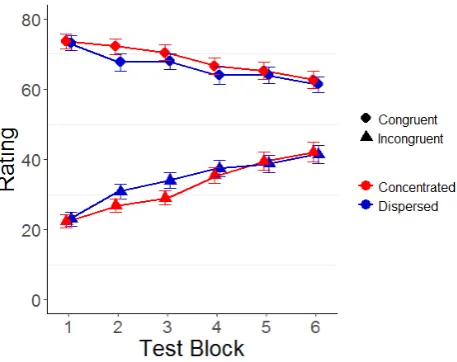
The results of the experiment were analysed using a mixed linear regression model including the factors of evidence vol-ume, concentration condition and trait type. As the first test block was intended to provide a baseline, being unaffected by either volume or concentration, ratings from this round were not included in the regression model. This was confirmed us-ing independent t-tests, findus-ing no significant difference be-tween conditions in either congruent ratings (t(114) = .190, p = .850) or incongruent ratings (t(114) = .296, p = .768) in the first test block.
The regression model showed significant effects for vol-ume in both congruent (β= -2.23, t(5086) = 6.41, p<.001)
and incongruent ratings (β= 6.49, t(5086) = 15.6, p<.001),
with congruent ratings decreasing and incongruent ratings in-creasing over the task. Similarly, condition is shown to be a significant predictor for both congruent (β= -6.36, t(114)
= 2.50, p = .014) and incongruent ratings (β= 12.6, t(114) = 3.19, p = .001), with congruent ratings being higher and incongruent ratings lower in the concentrated condition. Fi-nally, the interaction between concentration and volume was found to significantly differ between congruent and incongru-ent ratings (β= -2.21, t(5086) = 3.76, p<.001), potentially
indicating differences in the level of the subtyping effect over the task.
This was investigated further using two additional mixed linear regression models for each trait type, both including the factors of condition and evidence volume. Coefficient es-timates from the congruent ratings model suggested evidence volume to be a significant predictor (β= -3.11, t(1620) = 6.63,
p<.001), but concentration condition to be non-significant (β = -3.63, t(114) = 1.24, p = .218), with no significant
in-teraction between these factors (β= .58, t(1620) = .88, p =
.379). Conversely, the incongruent ratings model suggested a significant effect of volume (β= 4.48, t(1620) = 7.79, p<
.001) and condition (β= 7.40, t(114) = 2.40, p = .018), with a near-significant interaction (β= -1.52, t(1620) = 1.87, p = .062). The findings of the general model are therefore most evident in the incongruent ratings when the two trait types are separated, while congruent ratings do not display such strong effects.
Model Comparison
Participant data was compared with model predictions made by the three candidate models to determine which provided the most accurate depiction of behaviour in the task. This used a grid search function across the three parameters, with the considered values being: for c, 0.01 to 0.99 in steps of 0.01; forα, 0.1, 0.2, 0.3, 0.5, 1, 2, 3, 5, 10, 15, 20, 25 and 30;
[image:5.595.320.549.511.692.2]and for membership frequency of the prior cluster, 0 to 50 in steps of 1. The models were run through the same exemplar sets given to participants at each combination of parameter
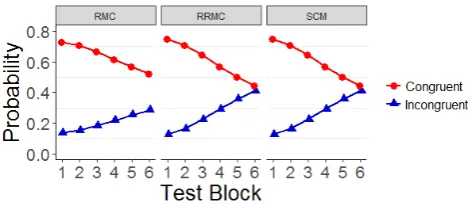
values to generate estimates of the probability of both con-gruency and inconcon-gruency in new category members at each of the six exemplar intervals. These values were then used to calculate model likelihoods assuming identical parameter values for all participants in order to allow the model to fit both conditions simultaneously. Likelihoods were calculated in each of the six test blocks according to the product of the probability of all participant ratings for that trait type in that test block; these probabilities were defined according to a normal distribution using the model probability estimate as a mean and variance fit to maximise the final product. These values were then transformed into log likelihoods before be-ing summed across test blocks and concentration conditions to create a single model log likelihood for all participants at that set of parameter values. Maximum log likelihoods from each model were then used to calculate BIC values for com-parison. The RMC was found to have the lowest BIC score (11926,α= 0.5, c = 0.01, prior membership = 21), indicating this model had a better fit to the experimental data than either the RRMC (11937,α= 10, c = 0.09, prior membership = 50) or the SCM (11929,α= 10, prior membership = 50).
Interestingly, when the predictions for this best fit for the RMC are examined, probability estimates for both measures are in fact identical between conditions; this is because all experimental exemplars were assigned to separate, single-member clusters despite any similarities in features, mitigat-ing all exemplars equally in both sets. This suggests that the differences observed in participant ratings between concen-tration conditions were sufficiently small such that the data could be best fit by identical behaviour in both conditions. As previously described, this is in fact a tenet of the SCM, which ignores the concentration of data via full integration of all ex-emplars; however, the SCM shows a steeper curve in both measures compared to the RMC, therefore predicting greater stereotype revision. As such, the scattering behaviour of the RMC better corresponds with the greater degree of mainte-nance observed in the data.
[image:6.595.56.292.577.680.2]It is also notable that the best fit of the RRMC matches that of the SCM, as the maximum likelihood of the RRMC was found when all exemplars were grouped in a single cluster.
Figure 2: Trait probability estimates from the best fits of the three candidate models. Due to equality in estimates between conditions for all models, only one line is used for each mea-sure.
As such, the RRMC also predicts greater revision than was observed in the experiment; however, because the SCM does not use a coupling parameter, the SCM holds a lower BIC value than the RRMC despite equal log likelihoods. It should be noted however that this comparison reveals only the best fit of the three candidate models rather than an absolute de-scription of behaviour in the task; more complex models may therefore be needed to reflect the subtle differences observed in the participant data.
Discussion
The results of the experiment provide three key findings: firstly, ratings of trait likelihood for both congruent and in-congruent traits became less stereotypical over the course of the experiment, indicating that higher volumes of incongruent evidence were effective in evoking greater revision of stereo-typical beliefs. Secondly, ratings were more stereostereo-typical in the concentrated condition compared to the dispersed condi-tion, as would be expected by subtyping. Thirdly, this con-centration effect differed somewhat in size across the task, showing smaller differences between groups at higher vol-umes of evidence. When the trait types are separated, these findings are seen to be stronger in the incongruent ratings, while congruent ratings did not demonstrate the condition or interaction effects.
In general, these results appear to partially correspond with previous depictions of the subtyping effect: beliefs are more stereotypical where incongruent information is more easily segregated from existing category structures, whereas data patterns aiding integration demonstrate greater stereotype re-vision. This also matches with the categorical explanations for subtyping offered by both the RMC and RRMC, as both suggest that category partitions which place incongruent data in a separate cluster diminish the impact of this data on sub-sequent probability estimates, thereby leading to more stereo-typical expectations.
There is, however, an additional aspect to the subtyping ef-fect observed in this task which distinguishes between these models: the interaction between volume and concentration, while not quite reaching a significant effect in the separated regression models, does suggest that the subtyping effect did not remain entirely consistent across the task, but in fact dropped off in later test blocks, with incongruent trait ratings in particular appearing to converge between the two condi-tions. This finding corresponds with the predictions of the RMC made in the introduction to this study: because the sub-typing effect in the RMC is the result of greater uncertainty in the data pattern of the subtype cluster due to its smaller size, increasing the size of this cluster attenuates the subtyp-ing effect by providsubtyp-ing more confidence in this pattern. This is in contrast to the RRMC’s hypothesised cross-over from subtyping to conversion at higher volumes of incongruent ev-idence where the subtype becomes the most likely cluster due to its size, an effect which was not observed in the data.
theoretical account of the observed results, suggesting partic-ipants were most likely using a rational categorisation pro-cess to guide their judgements in this task. This suggestion is further supported by the RMC having the best fit to the behavioural data in the above model comparison, though it is notable that this best fit did not accurately capture the ob-served differences between concentration conditions. Even so, the RMC does still provide a better fit to the experimental results than either the RRMC or SCM, potentially suggest-ing the present findsuggest-ings are more likely to be due to standard rational processes than these more extreme depictions.
Implications
The present study therefore provides evidence from both be-havioural data and model fits that the maintenance of stereo-typical beliefs generated by subtyping does appear to be the result of a rational incorporation of all available data rather than a heuristic strategy of stereotype preservation: isolating incongruent data in a distinct subtype does not completely exclude this information from consideration during category judgements, but instead mediates its impact according to the size of the subtype.
As such, the subtyping effect could be considered to be a normal aspect of standard categorisation processes operating on social groups, occurring where a particular data pattern inadvertently diminishes the impact of counter-stereotypical data. If so, stereotype change could be encouraged by using similarly rational techniques to circumvent subtyping, pri-marily by aiding the integration of incongruent data into pre-existing clusters. More broadly, this finding provides a basis for a rational system underlying stereotyping, allowing for the generation of further predictions regarding stereotype use based on the principles of such rational models to be tested in future studies; such tests would be valuable in further devel-oping the current model to provide a more complete depiction of rational stereotype use.
The current data also demonstrates that stereotype change can be drawn from even slight encounters with incongruent evidence in sufficient volume, with the effects observed in the experiment being based solely on the observation of member summaries rather than any significant interaction with actual counter-stereotypical group members. This is in contrast to past theories such as the Contact Hypothesis which often re-quire intensive, long-term interaction with out-group mem-bers to generate a reduction in stereotypical beliefs (Allport, 1954). This is not to say that prior expectations have been completely overcome: revision still does not reach the level suggested by conversion (or indeed the actual ratio of evi-dence in the experimental data sets); even so, this does still provide limited evidence that stereotype maintenance can be counteracted through increased exposure to incongruent data. The current design may therefore present a more economic path to combating prejudice, requiring less time and effort than some existing methodologies. What is more, the effects observed in this study could in fact be greater at more signif-icant forms of encounter, potentially counteracting subtyping
at even lower volumes of incongruent data. It is not clear how the significance of an encounter should be represented within the current version of the model, but one basic option would be to represent a significant encounter as multiple observa-tions in the partition, essentially viewing that individual as providing more data than a single exemplar. This suggestion should, however, be pilot tested to determine the validity of this representation before being incorporated into the model.
Conclusion
The present study provides the starting point for a rational ap-proach to stereotype use, providing both theoretical and em-pirical evidence that a rational model of stereotype change, while not universally accurate, does provide a reasonable ac-count of behaviour both in this experiment and previous stud-ies into stereotype maintenance. We therefore hope that this study can act as a foundation for continued work in this field, allowing subsequent research to further refine the presented models to provide a more accurate depiction of behaviour. This will serve to provide greater clarity regarding the opera-tions underlying stereotype maintenance, and so aid in finding more potential methods for encouraging stereotype change.
References
Allport, G. W. (1954). The nature of prejudice. Cambridge, Mass: Addison-Wesley.
Anderson, J. R. (1991). The adaptive nature of human cate-gorization. Psychological Review,98, 409–429.
Bott, L., & Murphy, G. L. (2007). Subtyping as a knowl-edge preservation strategy in category learning.Memory & Cognition,35, 432–443.
Heit, E., Briggs, J., & Bott, L. (2004). Modeling the ef-fects of prior knowledge on learning incongruent features of category members. Journal of Experimental
Psychol-ogy: Learning, Memory and Cognition,30, 1065–1081.
Hilton, J. L., & von Hippel, W. (1996). Stereotypes. Annual Review of Psychology,47, 237–271.
Johnston, L., & Hewstone, M. (1992). Cognitive models of stereotype change: 3. subtpying and the perceived typical-ity of disconfirming group members. Journal of Experi-mental Social Psychology,28, 360–386.
Murphy, G. L., & Ross, B. H. (1994). Predictions from uncer-tain categorizations. Cognitive Psychology,27, 148–193. Weber, R., & Crocker, J. (1983). Cognitive processes in the