702
©IJRASET: All Rights are Reserved
Cognitive Radio Performance Analysis and
Threshold Optimization of Energy Detection over
Inverse Gaussian Channel with Selection
Combining Reception
Nidhi Chauhan1, Dr. Om Prakash2
1
Research Scholar, Department of Electronics and Communication Engineering, JJTU, Jhunjhunu, Rajasthan, India
2
Professor, Department of Electronics and Communication Engineering, MRIET, Secunderabad, India
Abstract: The performance of spectrum sensing based on energy detection method in cognitive radio networks over inverse Gaussian channel for selection combining diversity technique is investigated. More precisely, exact and accurate analytical expressions for the average detection probability under different detection situation such as single channel i.e. single input single output and diversity reception are derived. The detection threshold parameter is optimized by minimizing the probability of error over several diversity branches. The outcomes shown in this paper, obviously shows the significant improvement in the detection of probability when optimized threshold parameter is applied. The impact of fading/shadowing parameters on the performance of energy detector is studied in terms of complimentary receiver operating characteristic curve. To verify the correctness of our analysis, the derived analytical expressions are verified via exact result and simulation.
Keywords:PDF; probability of detection; diversity; CROC; threshold; probability of false alarm I. INTRODUCTION
Cognitive Radio has arisen as a very viable technique for well-organized use of the available spectrum by the secondary users. Basically it relies on the use of white space and it adapts its communication features as per the available spectrum. But this approach requires very stringent condition not to add any interference to primary communication services and free the spectrum whenever needed by licensed user. Therefore, the success of this technology depends upon how efficient and practical our sensing methods are. Among several sensing techniques such as waveform sensing, cyclo-stationary sensing and energy-based sensing, the energy detection approach is known to be simplest in term of its complexity and does not need any apriori information related to primary user communication. The performance of energy detection based approach depends on the selection of threshold criterion that, in turn, depends on the given geography. Thus, in order to extract the best performance, the threshold criterion needs to be optimized for a given fading channel.
703
©IJRASET: All Rights are Reserved
performance of ED over fading channel. From above literature survey it is clear that multipath fading can be modeled as a Rayleigh, Rice or Nakagami distribution and shadowing is modeled as lognormal distribution [11], so we can say that most of the practical channel can be modeled as combination of multipath fading and lognormal shadowing i.e. composite channel.
To minimizing the probability of error is another important parameter to get optimized threshold for better spectrum efficiency. In [12], adaptive threshold algorithm has been analyzed and it gave better results in comparison to the conventional one and also provides trade-off between probability of detection and probability of false alarm. The problem of threshold parameter by minimizing the probability of error for cooperative spectrum sensing has been considered for Rayleigh channel in [13]. For minimizing the probability of miss detection and probability of false alarm, optimal threshold algorithm has been discussed in [14-15]. Zhang et. al in [14] considered weighted factor principle to trade off the probability of detection and probability of false alarm and Kozal et. al. in [15] considered spectrum utilization factor for calculation of adaptive threshold. In [16], the optimum value of probability of false alarm or probability of detection is attained by cooperating the group of users that have higher primary user’s signal to noise ratio. Optimal threshold algorithm has been analyzed for OFDM signal using Neyman- Pearson and Welch’s periodogram in [17-18] respectively.
The involvement of the present work is two-fold. Firstly, we present a closed-form expression of probability of detection over inverse Gaussian distribution with well-known diversity scheme such as Selection Combining (SC) nothing that, though maximum ratio combing (MRC) provides the best improvement in the system performance, however, SC enjoys the lowest implementation complexity. Further, an approximate from PDF of SC technique has been derived and using this, the approximate closed-form of probability of detection is derived with SC technique. Secondly, we have optimized the threshold parameter for detecting the unknown signal for both with and without diversity scheme by minimizing the overall probability of error. A significant improvement in probability of detection is clearly shown with the use of optimized threshold parameter for all diversity branches.
II. SYSTEMMODEL
An In energy detection technique, secondary users (SUs) detects whether the primary user (PU) is present or not. The received signal, is passed through the band pass filter (BPF), followed by a squaring device for quantifying the received energy and then passed through the integrator that controls the observation interval, T as shown in fig. 1. Now, in order to decide whether signal is present or not, the output of the integrator will be compared with a predetermined threshold i. e. conventional threshold or adaptive threshold, λ.
Fig. 1. Block diagram of energy detector
So, the received signal can be formulated by binary hypothesis with H0 (signal is not present)and H1 (signal is present)as
0 1
:
:
H
y t
n t
H
y t
h t x t
n t
(1)
Where,
h t
represents the channel gain between the transmitter and the receiver,x t
represents the band limited signal comingfrom the transmitter of unknown modulation format and
n t
is additive white Gaussian noise (AWGN)
2
0,
N
where
2 0
N W
,
N
0is one sided power spectral density (PSD)W
is bandwidth of the system.The output of energy detector can be expressed as
2 0 0
2
TY
y
t dt
N
. So, the corresponding to hypothesisH
0, the decisionstatistic can be expressed as [5, equation (2)]
Band
Pass
Squaring
Device
Integrator
Threshol
d Device
0 1
H or H
704
©IJRASET: All Rights are Reserved
2 2 2 0 10 0 0
2
:
T m k kn
Y
n
t dt
H
N
N W
(2)2 2 2 2
1 2 3
...
2mY
X
X
X
X
(3)
Hence,
Y
under null hypothesisH
0, is square sum of2
m
Gaussian random variableX i
i,
1, 2,3...2
m
with mean andvariance as 0 and 1 respectively. Thus
Y
is chi-square distribution with the distribution
1 0exp
2
:
2
n Y ny
f
y
y
H
n
(4)Here,
n
TW
(time-bandwidth product).Similarly, under alternate hypothesis
H
1, the decision statistic, output of the detector is expressed as
2 2 2 1 10 0 0
2
:
T m k k khx
n
Y
hx t
n t
dt
H
N
N W
(5)2 2 2 2
1 2 3
...
2mY
X
X
X
X
(6)
Note that mean of
X
i, under alternate hypothesisH
1, is
0
k
hx
N W
. Thus, the chi-square distribution (non-central) with
2
1
is given as
1 2 2 1 21
exp
,
:
2
2
n
Y
y
x
y
f
y
I y x
H
x
(7)Where,
2 2
2 2 2
2 2
2 2
,
1 0 0 0 0
2
2
2 ,
,
k
n n
k
k x k rms
k k
x
hx
h
h S
h S
x
x
S
x
T
N W
N W
N
W
N W
Thus, knowing the probability density function (PDF) of decision statistic
Y
, one can easily estimate the probability ofY
being lessthan certain threshold
th
which is nothing but the outage probability ofY
so, probability of false alarm,P
f is given as
0 0 , 0,
2
1
th thf r th H
n
P
P Y
H
f
y dy
n
(8)Probability of detection,
P
dis given as
1
, 1
0
1
2 ,
th
d r th H n th
P
P Y
H
f
y dy
Q
(9)
Where,
P
mis the probability of miss detection andQ
n
.
is the generalized (
th
705
©IJRASET: All Rights are Reserved
Marcum
Q
-function is defined as
2 2 1 1
1
,
exp
,
2
nn n n
a
t
Q a
t
I
a t dt
a
(11)
Another form of generalized Marcum
Q
-function is given as [19]
1
0 0
2
2 , e x p ex p
! 2 !
l m m n
th th
n th
m l
Q
m l
(12) Equation (12) can be re-written as [20]
0 0
, 2 , 2
2 , exp exp
! !
m m
th th
n th
m m
m n m n
Q
m m n m m n
(13) So, equation (4), can be written with the help of equation (13) as
0
, 2
2 , e x p
!
l
th d n th
l
s n l
P Q s
l n l
(14)
It is very much clear from equation (8) that the probability of false alarm
P
f , is same over any fading channel as it does not dependupon the fading parameter. It only depends on the number of samples and threshold parameter. The expression in equation (8) and (9) are achieved by considering the channel as non-fading and thus channel parameter or gain
h
in equation (7) is assumed to be constant.If the channel is characterized by multipath fading as an inverse Gaussian distribution (IG) with the diversity technique selection combining (SC). We consider independent and identically distributed (i.i.d.) channel scenario, for selection combing, probability distribution function (PDF) is defined as
N 1
SC Y Y
f
y
N F
y
f
y
(15)
where,
F y
Y( )
andf
Y( )
y
are the Cumulative distribution function (CDF) and probability distribution function (PDF) of RVY
,N
is the number of diversity branches. The CDF and PDF for inverse Gaussian distribution are given as [21]
1 ex p 2 1Y
y y
F y Q Q
y y
(16)
3 / 22
1
ex p ex p
2 2 2
Y
y
f y y
y
(17)
Equation (16) is further re-expressed using property of Q-function
Q
x
1
Q x
given by
SCf
706
©IJRASET: All Rights are Reserved
The Q-function renders analytical difficulty while solving the integral using the above equation along with other function. The difficulty is overcome by using second order exponential approximation. Putting CDF and PDF in equation (15) and restoring to the second order exponential approximation of Q-function, the PDF of IG distribution for selection combining can be written as
SCf
= (19)
where,
M
N
K
1
1
1
1
2
b N
r
j
;
2 2
1
1
2
b N
r
j
3
1
1
2
b N
K
r
i
j
;
4 2
1
1
2
b N
K
r
i
j
1
1 1 2
1
2
2
2
N r j r j
N K M
k r j
a
a
A N
C
C
C
1
1 1 2
2
2
2
2
N r j r j
N K I M
k i r j
a
a
A
N
C
C
C
C
1
2
1
x
b M
j
k
r
M
;
x
2
b M
j i
r
2
M
1
22
exp
2
&2 2
exp
1
and
10 ln 10
Now, equation (18) becomes
SCf
(20)
707
©IJRASET: All Rights are Reserved
III. AVERAGEPROBABILITYOFDETECTION
When the channel gain varies, the average probability of detection can be calculated by averaging
P
din equation (9) over the SNRdistribution as [2]
0 0
,
2 ,
d d th n th SC
P
P
f
d
Q
f
d
(21)
In this section, we discuss the performance of energy detector with diversity combing method i.e. for selection combining. The combiner selects that branch which is having the strongest signal to noise ratio (SNR) among all diversity branches. The
instantaneous SNR at the output of the selection combiner is
SC
max
1,
2...,
N
, where
N is the SNR in theN
thbranch.
Probability of false alarm will remain same as given in equation (8).
P
d with selection combining diversity is derived bysubstituting equation (14) and (20) into (21) as
3/ 2 1
1 1 2
0 0
3/ 2 3
2 2 4
0
,
2
exp
exp
exp
!
,
2
exp
exp
exp
!
l th l d l th ls
n l
A
x
s
d
l
n l
P
s
n l
A
x
s
d
l
n l
(22)Using the relation
2 1 / 02
exp
2
p v p v p px
x
dx
K
x
p
;
0, Re
0
and
1 /, ,
x t b tx
t x b
t
e
dt
;
x
0, Re
b
0
with notations has their usual meaning and applied in equation (22), we get the expression for the average probability of detection as
1/ 2 11/2 1 1
2
1 1
0
0 1 2
1/ 2 2
2 2 1
0 4
2
2
,
/ 2
exp
!
1
1/ 2,
,
,
/ 2
1
exp
!
l l l th d l l l th l lK
s
s
n l
s
P
A
x
l
n l
l
T
s
s
n l
s
A
x
l
n l
s
/2
l
1 / 2,
y
0,
3
s
4
(23)Where,
K
l1/ 2
denotes the modified Bessel Function of the second kind with orderl
1 / 2
.IV. THRESHOLDOPTIMIZATION
708
©IJRASET: All Rights are Reserved
0
1
e f m
P
P H
P
P H
P
(24)
Substituting the value of
P
f andP
mfor single input single output (SISO) and for selection combining diversity. The optimumthreshold can be obtained by differentiating error probability and equating it to zero, i.e.
P
e/
th
0
. We can observe thatthe total error probability given by equation (23) has a global minimum with respect to
thby minimizingP
e, given by equation (23)
arg min
th
opt
P
e
. It can be solved by
P
e/
th
0
. Thus considering apriori probability of both the hypothesis to be same, we have0
f m th thP
P
(25)The first term
P
f/
th is obtained by differentiating equation (8) w.r.t
th . It is obtained by restoring the identity
1,
/
thexp
aa z
z z
[15]. So using this relation, we can find
P
f/
th as
1
exp
/ 2
2
n
f th th
n th
P
n
(26)
1
d
m d
th th th
P
P
P
(27)
Substituting equation (22) into equation (26) and after some mathematical calculation equation (24) becomes as
1 1 11 1 1
0 0
1 1
1/ 2 1
1/2 1 1 1/ 2 0 1 2
2 2
2 2
2
exp
/ 2
,
/ 2
1
exp
2
2
/
1 / 2
1
2
2
1 / 2,
,
exp
n l n
th th th
n l
n n l
l l
l
l l
n l
n l
x
A
n
x
n l
x
K
s
l
T
s
s
s
x
A
x
1 1 10 0 2
0 3 4
1/ 2 4
,
/ 2
1
2
/
1 / 2
1
1 / 2,
,
0
n l th n l n l l l l
n l
n l
n l
x
l
y
s
s
(28)Solving equation (28) numerically, we get the optimum value of
thand by using optimum value of threshold (
th), we can get theoptimum value of probability of miss, probability of detection as well as optimum probability of error using equation (28).
V. DISCUSSION
The exact numerical results are obtianed by replacing the PDF of the single intgral equation (21) by equation (15) and then solving integral using MATLAB. Complementry reciever operating charachertisic under different branches for selection combing technique over IG distribution is plotted at
4
dB
and
5
dB
without use of adaptive threshold as shown in fig. 2. The plot also includes exact result and Monte Carlo simulation for validation purpose.709
©IJRASET: All Rights are Reserved
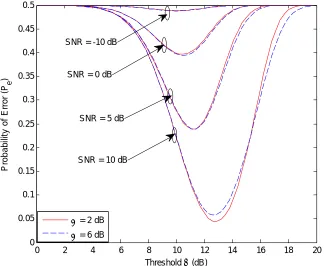
from the fig. 4 that the probability of error given by
P
e
P H
0
P
f
P H
1
P
mhas the global minimum with respect tothreshold (
th).The probability of detection verses received average SNR (dB) is plotted as shown in fig. 5 for fixed and optimized (or adaptive) detection threshold. It is evident from the fig. 5 that optimized detection threshold significantly improves the detection probability from the fixed threshold. As well as the number of branches increases i.e. form N=1 to 3, probability of detection improves in a better way for optimized threshold in comparison with fixed threshold.
10-4 10-3 10-2 10-1 100 10-4
10-3 10-2 10-1 100
Probability of False Alarm (Pf)
P
ro
b
a
b
ili
ty
o
f
M
is
s
D
e
te
c
ti
o
n
(
P m
)
Exact Closed Form Exact Adaptive Closed Form Adaptive Simulation
[image:8.612.143.466.188.393.2]N=1 N=3
Fig. 2. Probability of miss detection verses probability of false alarm for SC
0 2 4 6 8 10 12 14 16 18 20 0
0.05 0.1 0.15 0.2 0.25 0.3 0.35 0.4 0.45 0.5
Threshold (dB)
P
ro
b
a
b
il
it
y
o
f
E
rr
o
r
(P e
)
= 2 dB
= 6 dB SNR = 10 dB SNR = 0 dB
SNR = 5 dB SNR = -10 dB
[image:8.612.141.465.441.707.2]710
©IJRASET: All Rights are Reserved
0 5 10 15
0.1 0.2 0.3 0.4 0.5 0.6 0.7 0.8 0.9 1
Received SNR (dB)
P
ro
b
a
b
il
it
y
o
f
D
e
te
c
ti
o
n
(
P d
)
Exact
Fixed (Closed Form) Adaptive (Closed Form) Simulation
N=1 N=3
[image:9.612.158.451.90.320.2]N=2
Fig. 4. Probability of detection verses received SNR (dB)
0 0.1 0.2 0.3 0.4 0.5 0.6 0.7 0.8 0.9 1 0
0.1 0.2 0.3 0.4 0.5 0.6 0.7 0.8 0.9 1
Probability of False Alarm (Pf)
P
ro
b
a
b
ili
ty
o
f
D
e
te
c
ti
o
n
(
Pd
)
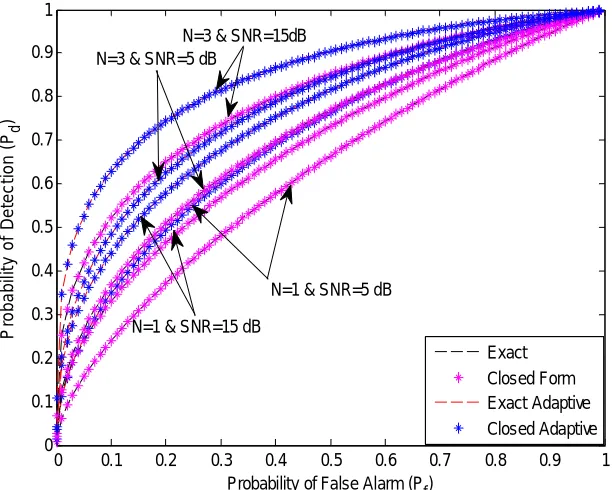
Exact Closed Form Exact Adaptive Closed Adaptive N=3 & SNR=15dB
N=1 & SNR=15 dB N=3 & SNR=5 dB
N=1 & SNR=5 dB
Fig. 5. ROC under different selection combining branches
VI. CONCLUSIONS
[image:9.612.152.458.366.611.2]711
©IJRASET: All Rights are Reserved
REFERENCES
[1] Bhargava, V. K. and Hossain, E. (2007). Cognitive Wireless Communication Networks. New York: Springer-Verlag.
[2] Sun, H., Laurenson, D. I. & Wang C. X. (2010). Computationally Tractable Model of Energy Detection Performance over Slow Fading Channels. IEEE
Communication Letter, 10, 924-926. doi: 10.1109/LCOMM.2010.090710.100934
[3] Atapattu, S., Tellambura, C. & Jiang, H. (2011). Spectrum Sensing via Energy Detector in Low SNR. IEEE ICC proceedings, 11, 682-684. doi:
10.1109/icc.2011.5963316
[4] Sofotasios. P. C., Lina Mohjazi, S. M., Qutayri, M. A., & Karagiannidis, G. K. (20012). Energy Detection of Unknown Signals over Cascaded Fading Channels. IEEE Antennas and Wireless Propagation Letters, 11, 507-510. doi: 10.1109/LAWP.2015.2433212
[5] Urkowitz, H. (1967). Energy detection of Unknown deterministic Signals. Proc. IEEE, 55, 523-531. doi: 10.1109/PROC.1967.5573
[6] Kostylev, V. I. (2002). Energy detection of a signal with random amplitude. Proc. IEEE Int. Conf. Commun. (ICC), 1606-1610. doi:
10.1109/ICC.2002.997120
[7] Digham, F. F., Alouini, M. S. & Simon, M. K. (2003). On the Energy Detection of Unknown Signals Over Fading Channels. Proc. IEEE international Conference Communication (ICC), 3575-3579. doi: 10.1109/ICC.2003.1204119
[8] Digham, F. F., Alouini, M. S. & Simon, M. K. (2007). On the Energy Detection of Unknown Signals Over Fading Channels. IEEE Transaction on
communication, 55, 21-24. doi: 10.1109/TCOMM.2006.887483
[9] Herath, S. P. & Rajatheva, N. (2008). Analysis of equal gain combining in energy detection for cognitive radio over Nakagami channels. Proc.IEEE Global
Telecommun. Conf. (GLOBECOM), 1-5. doi: 10.1109/GLOCOM.2008.ECP.570
[10] Atapattu, S., Tellambura, C. & Jiang, H. (2009). Energy detection of primary signals over − fading channels. Proc. Int. Conf. Industrial & Information Systems (ICIIS), 118-122. doi: 10.1109/ICIINFS.2009.5429879
[11] St¨uber, G. L. (2nd edition) (2001). Principles of Mobile Communication,. Norwell, MA: Kluwer Academic Publishers
[12] Wang, N., Gao, Y. & Zhang, X. (2013). Adaptive Spectrum Sensing Algorithm Under Different Primary User Utilizations. IEEE Communications Letters, 17
(9), 1838-1841. doi: 10.1109/LCOMM.2013.081313.131468
[13] Zhang, W., Mallik, R. K. & Letaief, K. B. (2009). Optimization of Cooperative Spectrum Sensing with Energy Detection in Cognitive Radio Networks. IEEE
Transac On Wireless Commun., 8 (12), 5761-5766. doi: 10.1109/TWC.2009.12.081710
[14] Zhang, S. & Bao, Z. (2011). An adaptive spectrum sensing algorithm under noise uncertainty. Proc. IEEE Int. Conf. Commun., 1-5. doi:
10.1109/icc.2011.5962493
[15] Kozal, A., Merabti, M. & Bouhafs, F. (2012). An improved energy detection scheme for cognitive radio networks in low SNR region. Proc. IEEE Int. Symp.
Comput. and Commun., 684-689. doi: 10.1109/ISCC.2012.6249377
[16] Peh, E. & Liang, Y.-C. (2007). Optimization for cooperative sensing in cognitive radio networks. Proc. 2007 IEEE Wireless Commun. Netw. Conf., 27-32.
doi: 10.1109/WCNC.2007.11
[17] Axell, E. & Larsson, E. (2011). Optimal and sub-optimal spectrum sensing of ofdm signals in known and unknown noise variance. IEEE J. Sel. Areas Commun., 29 (2), 290-304. doi: 10.1109/JSAC.2011.110203
[18] Wang, N. & Gao, Y. (2013). Optimal threshold of Welch’s periodogram for sensing OFDM signals at low SNR levels. Proc. 2013 Eur. Wireless Conf., 1-5.
doi: http://ieeexplore.ieee.org/document/6582816/
[19] Simon, M. K. & Alouini, M. S. (2nd edt.) (2004). Digital communication over fading channels, New York; Wiley-IEEE Press.
[20] Gradshteyn, I. S. & Ryzhik, I. M. (6th edition) (2000). Table of Integrals, Series, and Products, Academic Press.