Emotion Detection and Performance Prediction of
Student using CNN
Awanit Kumar1, Dr. Geetanjali Amarawat2
1
Ph..D Scholar, 2Associate Professor, Computer Science & Engineer, Madhav University, Abu Road, India
Abstract: Artificial intelligence is making a new world with the most advanced technology like machine learning, deep learning, computer vision and Robotics process automation.
The techniques are making human to reduce their physical efforts, save times and accuracy more than human where human can’t perform those task.
With human effortless, as lots of research are done in this filed, its uses of application are also developed like self-driving card, face recognition, emotion recognition, speech recognition and many more.
In this research, we are implemented a smart classroom technique using computer vision and emotion recognition for multiple faces of student and detect different types of emotion during lecture and plot a final result to predict their performance in the upcoming exam.
Keywords: Face recognition, Emotion Recognition, Computer Vision.
I. INTRODUCTION
Machine learning (ML) is nothing but a subset of Artificial intelligence (AI) which deals with massive data, and these data are used to find some pattern in that and find prediction to give a market hike. Similarly, we can say using machine learning we train our model and find some output result from it, for example, if we saw an apple to baby and ask him to pick an apple from fruits basket it's quite easy for him to find apple from along those fruits.
This is because that baby already learned from its feature like colour and shape of an apple, that’s why he didn’t pick any other fruit from basket.
We are going to use Open cv for webcam-based emotion detection of students those who are present inside the classrooms and find the emotion which will help the organization to predict there attention level at the school for each and individuals lecture and this will also help to get the feedback of teaching staffs by recognizing the students emotion during class time and how they control the class.
In this project, we used the library is of python mainly like OpenCV, Opencv contrib, FisherFace, numpy etc.
OpenCV: We have used this for capturing photos from the webcam as well as processing on it. Implement fisherface methodology of opencv.
FisherFace: use for train the model, create it and store it in a .xml model file. We have to make core categories of emotions likes.
II. EXTRACTING FACES
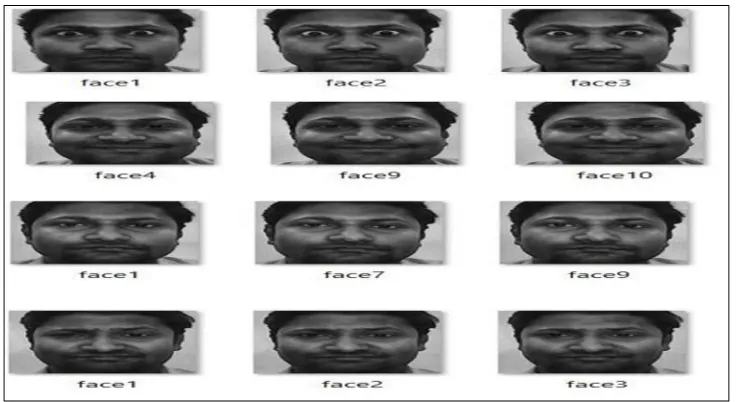
We must find the face on each image from the data set and convert it into grayscale, crop it with proper size and save the image to the dataset. We need to use HAAR filter from OpenCV to find faces. OpenCV (computer vision) provides four pre-trained classifiers to detect multiple faces as possible.
[image:2.612.123.491.142.343.2]We have also used the haar cascade trained model provided by OpenCV for face detection in the captured image.
Figure 2: Different types of human Facial Expressions
III. HOW EMOTION DETECTION WORKS
There are two main approaches to emotion detection:
A. Facial recognition.
B. Semantic analysis.
Facial detection examines facial expressions in video and photos, which define universal emotions such as anger, disgust, fear, happy, neutral, sadness and surprise [1]. These algorithms can detect expressions by plotting multiple dot points on a face as shown in the figure below
Figure 3: Plotting point on faces to read expressions.
From the figure, these dots points read the relationships to one another, with the help of facial databases of different images of different emotions [2].
[image:2.612.151.461.484.642.2]Figure 4: Emotion detection from an image.
IV. CONVOLUTIONAL LAYERS
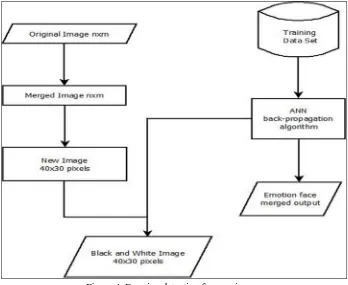
[image:3.612.118.497.466.515.2]Convolution layers generate feature maps that represent how pixel values are enhanced, for example, edge and pattern detection. A feature map is formed by applying filter one transversely the entire image [4]. Pooling is a dimension reduction technique, which is usually applied after one or several convolutional layers when building CNN's as adding more convolutional layers can significantly affect computational time. MaxPooling 2D used in this research that uses (2, 2) windows across the feature map only keeping the maximum pixel value.
Figure 5: Steps for recognising emotions.
V. DENSE LAYERS
The dense layer is inspired by the way biological neurons, which transmit signals through the brain. It takes a large number of input features and transforms features through layers connected with trainable weights.
[image:3.612.111.500.587.715.2]Weights are trained by forwarding propagation of training data then backward propagation of its errors. Backpropagation starts from evaluating the difference between prediction and actual value and back calculate the weight adjustment needed to every layer before [5]. We can control the training speed and the complexity of the architecture by tuning the hyper-parameters, such as learning rate and network density.
As more layers are added to the network, the model also becomes increasingly prone to overfitting the training data. One method to prevent overfitting and generalise on unseen data is to apply dropout. Dropout randomly selects a portion (usually less than 50%) of nodes to set their weights to zero during training. This method can effectively control the model's compassion for noise during training.
VI. OUTPUT LAYER
We have used the softmax activation function instead of sigmoid at the output layer because the output represents a probability for each emotion class [6,7]. So that the model can show the detail probability composition of the emotions in the face to classify human facial expression as only a single emotion. There is no specific formula to build a neural network that would work well. Different types of problems require different network architecture and a lot of trial and errors to produce desirable validation accuracy. Time is not unexploited when experimenting to find the best model, and you will gain valuable experience.
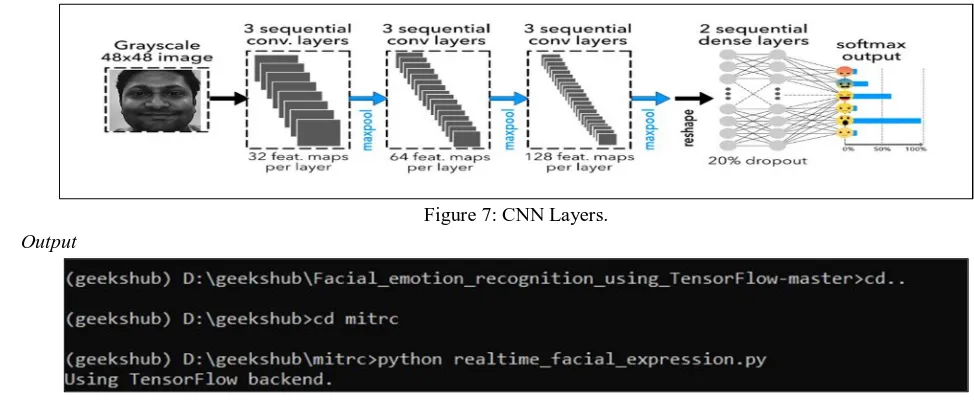
Using Deep Learning, we built a simple CNN with an input, three convolution layers, one dense layer, and an output layer. It was merely random predicting the six emotions.
Figure 7: CNN Layers.
[image:4.612.48.535.300.500.2]A. Output
Figure 8: Directory folder and Execution of the python file.
B. Train
[image:4.612.66.543.546.723.2]Python emotion_recognition.py train
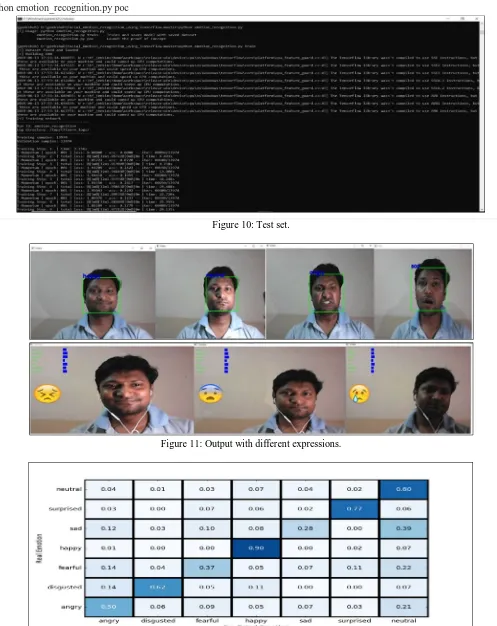
C. Test
[image:5.612.55.552.89.715.2]Python emotion_recognition.py poc
Figure 10: Test set.
Figure 11: Output with different expressions.
REFERENCES
[1] Shepard, L.A., 2019. Classroom assessment to support teaching and learning. The ANNALS of the American Academy of Political and Social Science, 683(1), pp.183-200.
[2] Sahla, K.S. and Kumar, T.S., 2016, September. Classroom teaching assessment based on student emotions. The International Symposium on Intelligent Systems Technologies and Applications (pp. 475-486). Springer, Cham.
[3] Mitchell, B.S., Kern, L. and Conroy, M.A., 2019. Supporting students with emotional or behavioural disorders: State of the field. Behavioural Disorders, 44(2), pp.70-84.
[4] Sebastian, A.G., Singh, S., Manikanta, P.B.T., Ashwin, T.S. and Reddy, G.R.M., 2019. Multimodal Group Activity State Detection for Classroom Response System Using Convolutional Neural Networks. Recent Findings in Intelligent Computing Techniques (pp. 245-251). Springer, Singapore.
[5] Li, X., La, R., Wang, Y., Niu, J., Zeng, S., Sun, S. and Zhu, J., 2019. EEG-based mild depression recognition using a convolutional neural network. Medical & biological engineering & computing, pp.1-12.
[6] Wang, J., Chen, Y., Hao, S., Peng, X. and Hu, L., 2019. Deep learning for sensor-based activity recognition: A survey. Pattern Recognition Letters, 119, pp.3-11.