In the last 25 years the availability of molecular marker maps has provided an unprecedented insight into structural features of the barley ge-nome. Several generations of selectable markers have been included in these maps and a large number of qualitative and quantitative traits were located in the genome some of which are routinely selected in marker assisted breeding programs. The first generation of molecular marker maps mainly comprised genomic DNA fragments since the cloning of low molecular weight genomic DNA for marker development is a straightforward process. In this regard, genomic DNA fragments revealed higher DNA polymorphism than
gene-derived fragments, although it could be shown that many genomic RFLP-probes were derived from genes (M������� et al. 1999). With the estab-lishment of large scale EST-programs in several laboratories around the world, a comprehensive resource has been created that provides direct access to genes. In the following, the application of this EST-resource will be described for the construction of a genome-wide barley transcript map, the marker saturation of sub-chromosomal target regions by exploiting synteny between the genomes of rice-barley and the identification of candidate genes by an EST-based functional as-sociation approach.
Molecular Mapping in Barley: Shifting from the Structural
to the Functional Level
A������ GRANER, T����� THIEL, H������� ZHANG, E���� POTOKINA, M���� PRASAD, D����� PEROVIC, R��� KOTA, R����� K���� VARSHNEY, U�� SCHOLZ, I�� GROSSE
and N��� STEIN
Institute of Plant Genetics and Crop Plant Research (IPK), Gatersleben, Germany
Abstract: As a resource for structural and functional barley genome analysis, more than 140 000 ESTs (expressed sequence tags) were generated from 22 cDNA libraries that yielded 25 224 tentative unigenes. About 50% of them belong to gene families. The size of the complete transcriptome is estimated to comprise between 35 000 and 75 000 genes. The barley EST collection is a rich source for the development of novel markers including SSRs (simple sequence repeats) and SNPs (single nucleotide polymorphisms). Several bioinformatic tools have been developed facilitating the computer-assisted analysis of EST databases for the presence of either SNPs or SSRs and the development of SNP-derived CAPS (cleaved amplified polymorphic sequences) markers. In an attempt to systematically map barley genes a high-density transcript map is under construction and presently comprises more than 1000 markers. This map is a gateway to comparative genomics with particular emphasis on the rice genome. 65% of the mapped ESTs showing a significant homology to rice ESTs were found to display a syntenic relationship between barley and rice. Thus, the barley EST resource facilitates the rapid and systematic transfer of genetic information from rice to barley and other Triticeae, which can readily be exploited for marker saturation of defined chromosome regions and their detailed comparison to rice.In the context of a functional genomics study, the complex trait “malting quality” is investigated using a barley cDNA array. By correlating the phenotypic malting trait data of selected barley lines with the corresponding expression profiles, a set of candidate genes was identified and further verified by genetic analysis.
Facets of the barley transcriptome
The salient challenge of applied genetics and genomics is the correlation between genetic and phenotypic information and the subsequent identi-fication of the genes underlying a trait of interest. Since most traits are only defined by a phenotype rather than by proteins or metabolites, map-based cloning has been the strategy of choice to isolate genes of interest. However, positional cloning is a time and resource intense approach that has to be restarted from scratch for any novel trait/gene. Consequently, there is a quest for more systematic approaches to gene identification. In the best case, this results in deciphering the complete sequence of a genome as it was done for Arabidopsis and rice (TAGI 2000; Y� et al. 2001; G��� et al. 2002). Along with the progress in the field of bioinformatics, the availability of the whole genome sequence will greatly accelerate the identification of trait-related genes. Until now, the relative size of the barley genome has hindered any serious effort of systematic sequencing. The available sequence data on selected subgenomic regions show that, despite of very variable gene densities, any genome-wide sequencing effort in barley will likely result in sequencing endless stretches of repetitive DNA. Therefore, the pre-selection of expressed sequences will avoid the issue of genome complexity in barley. As a result of a barley EST project that was initi-ated at the IPK in 1998 about 200 000 sequences originating from 37 libraries have been released into the public domain. Together with the ESTs released by other groups more than 419 000 ESTs have been deposited until now in the public EST database of the NCBI (http://www.ncbi.nlm.nih. gov/dbEST/). These are derived from more than 80 cDNA libraries covering virtually any tissue and growth stage as well as a series of physiological conditions. Since ESTs reflect the transcriptional status of the tissue they were derived from, the sequences are inherently redundant. EST clustering is applied to remove the redundancy and to sort the sequences into singletons and sequence clusters. The sum of the numbers of singletons and clusters yields the number of tentative unigenes (Tentative Unigene Consensi, TUCs). In this regard, cluster analysis of 330 000 ESTs that were available in 2003 resulted in the definition of ca. 33 000 tenta-tive unigenes. Evidently the outcome of this kind of analysis depends on a number of parameters including the average sequence length of an EST,
the quality of the sequences and the contamination of EST data with sequences from other organisms, such as microbes or fungi. Moreover, the result of the analysis is influenced by the stringency of the cluster algorithm. The higher the stringency, the more singletons (which may be due to sequencing errors only) and thus the more unigenes will be defined. Using appropriate software and proper settings meaningful results can be obtained as was shown for the differentiation of the individual mem-bers of the transcription elongation factor 1-alpha (eEF1A) gene-family (M������� et al. 2002).
A comparison of the available sequence data to 254 well characterised barley genes from the SWISSPROT database and to 1.2 Mb of annotated BAC-sequence originating from several regions of the barley genome revealed an EST coverage of 87% for the SWISSPROT dataset and 45% for the genomic sequences. Thus, a preliminary estimate of the gene repertoire of barley will lie between 38 000 and 72 000 genes. However, the complexity of the genome is defined not only by the number of its genes but also by the number of its pro-teins. The latter may be influenced by alternative splicing, which is a common feature of the human transcriptome. In higher plants alternative splic-ing may be much less frequent since only a few cases have been described so far. Our EST data revealed that about 4% of the barley genes showed alternatively spliced isoforms, a similar figure as was recently reported for Arabidopsis (B���� et al. 2002; Z���� et al. 2004).
From ESTs to markers
SSRs. Data from several plant species showed that, compared to non-coding regions, genes are enriched with microsatellites (SSRs) (M������� et al. 2002). Analysis of the barley EST resource revealed similarities to other grass genomes: the barley transcriptome contains on average 1 SSR every 7.5 kb. This frequency of EST-SSRs is similar to that found in maize, wheat and sorghum, while the frequency in rice is 1/3.9 kb (V������� et al. 2002). Trimeric SSRs represent the largest class of repeat motifs found in barley ESTs accounting for 56%. This may be explained by the suppression of non-trimeric SSRs in coding regions due to the ensuing frameshift mutations. Monomeric and dimeric repeats were observed at frequencies of 19% and 18%, respectively (T���� et al. 2003). For SSR identification and primer development a soft-ware tool has been developed (MISA, http://pgrc. ipk-gatersleben.de/misa/) which allows a widely automated search of EST databases for SSR-con-taining sequences.
SNPs. Similar tools have been developed for the computer-assisted identification of single nu-cleotide polymorphisms (SNPs). SNPs represent the most common class of genetic variations and have rapidly become the markers of choice be-cause of their high frequency in the genome and low mutation rates. A survey for barley based on the comparison of EST-derived sequence tags in 7 divergent barley cultivars and one H. spontaneum accession revealed a mean nucleotide diversity of 3.2 × 10⁻³ with values ranging from 0 (no SNP)
to 3 × 10⁻². A marked increase in SNP frequency
could be obtained by the computer-assisted
pre-selection of polymorphic EST-sequences from public databases. This approach is based on the fact that the ESTs deposited in dbEST originated from different genotypes. Thus, sequence align-ments can be searched for the presence of SNPs. By this approach it is possible to identify genes or regions within genes that show a higher frequency of polymorphisms. Using a software tool that has been designed to automatically perform this task, 4329 high scoring and putatively cultivar-specific SNPs were identified. Further experimental verifi-cation of the results obtained from the data mining approach resulted in the confirmation of 86% of the SNPs detected. The average nucleotide diver-sity of the SNPs identified in this way amounted to 9 × 10⁻³. This increase was mainly due to the
reduced frequency of monomorphic EST-alleles since their frequency dropped from 34% in ran-dom samples to only 9% after employing the data mining approach (K��� et al. 2003).
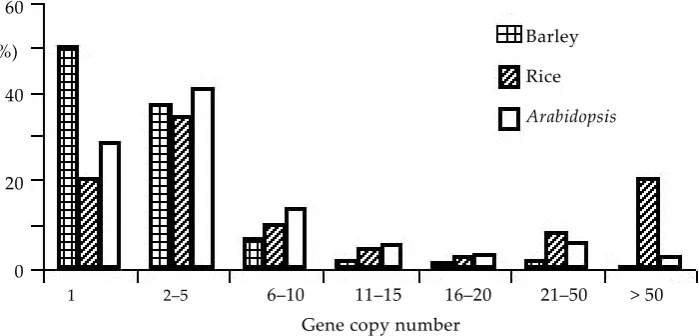
[image:3.595.108.458.85.253.2]With the influx of a plethora of SNP genotyping assays in recent years, there has been an imminent need for an assay that is robust, yet cost effective, and could be performed using standard gel-based procedures. In this context, CAPS (cleaved ampli-fied polymorphic sequences) markers have been shown to meet these criteria. However, converting SNPs to CAPS markers can be a laborious proc-ess if done manually. Therefore, a computer pro-gramme (SNP2CAPS, http://pgrc.ipk-gatersleben. de/snp2caps/) was developed that facilitates the computational conversion of SNPs into CAPS mark-ers (T���� et al. 2004). To investigate the number of potential CAPS markers present in our EST-allele Figure 1. Distribution of the size of gene families. The copy number of each barley unigene was estimated by counting the number of BLASTN matches against the unigene data set itself with an E-value threshold of less than 10–20
Barley
Rice
Arabidopsis
60
(%)
40
20
0
1 2–5 6–10 11–15 16–20 21–50 > 50
database, 413 multiple aligned sequences derived from barley ESTs were analysed for the presence of polymorphisms in 235 distinct restriction sites. 282 (90%) out of 314 alignments that contain se-quence variation due to SNPs and InDels revealed at least one polymorphic restriction site. After reducing the number of restriction enzymes from 235 to a set of 10 common restriction enzymes, still 31% of the polymorphic sites could be detected. Thus, a significant portion of the available barley SNPs can be assayed as CAPS markers, which might be an option for laboratories that cannot
afford or do not need the establishment of high throughput SNP-detection platforms.
The barley transcript map
[image:4.595.85.500.246.638.2]The major challenge of genomics is the identifi-cation of candidate genes for a given trait. On the structural level it requires the identification of all possible genes residing on a chromosomal segment to which a trait has been assigned. In the best of all cases, each point on a genetic trait map can be connected to a defined region in a fully sequenced
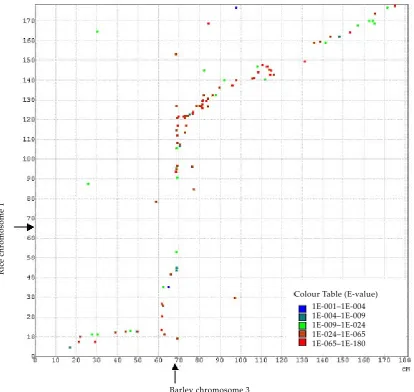
Figure 2. Comparison of the genetic maps of barley chromosome 3 (x-axis) and rice chromosome 1 (y-axis) (H�-������� et al. 1998). The data for barley chromosome 3 are based on a consensus map of three populations. ESTs in common to both chromosomes are represented as dots with a colour code indicating the BLASTN similarity between homologous ESTs of the two species. The positions of the centromeres are indicated by arrows. Given similar map distances in both species, colinear markers would be ordered along the bisecting line. However, due to the reduced recombination observed in the proximal regions of the 7 barley chromosomes, colinear markers form a sigmoid curve. Moreover, because of the inaccuracies still present in the barley consensus map underlying this sca�er plot, many dots deviate from an intended line that connects the colinear markers
R
ic
e
ch
ro
m
os
om
e
1
Barley chromosome 3
genome – so far a privilege of Arabidopsis and rice only. Although the barley genome is far from be-ing fully sequenced, strategies are emergbe-ing for sequencing the gene rich regions of the genome. To relate these partial physical maps to the ge-netic map(s) of barley a high density transcript map is being developed that presently comprises 1023 ESTs and extends over 1131 cM. The corre-sponding loci represent potential anchor points for sub-genomic physical maps of barley and the mapped markers, in particular the 255 SNPs and 185 SSRs further complete existing resources for trait mapping and marker assisted selection. Most importantly, the EST-loci are the connecting points to relate the genomes of barley and rice. The pres-ence of extensive marker colinearity between these two genomes, which diverged about 60 million years ago, provides the opportunity to tap into the wealth of information and resources available for rice. To explore the sequence similarity between barley and rice, the barley ESTs were compared with both rice ESTs and rice genomic sequences. Out of the 1023 barley ESTs, 769 share a significant match with rice sequences (< 1E-5, > 80% sequence identity) and out of these 505 displayed a syntenic relationship at the chromosomal level as is shown in Figure 2 for rice chromosome 1 and a consen-sus map of barley chromosome 3. The apparent discrepancy between the numbers of syntenic and colinear markers is mainly attributable to inaccu-racies of a few cM in the present consensus map, which disturb the linear marker order. An increase in the number of anchor markers is expected to alleviate this problem.
Application of marker colinearity between rice and barley
Evidently, it is most tempting to use information from the rice genome for the immediate identifica-tion of orthologous genes in barley. But colinearity observed at the level of genetic resolution may provide too optimistic a picture. In several cases, the orthologue from barley is no longer present in rice, due to small-scale genomic rearrangements or due to the rapid or divergent evolution of genes that may prevent the detection of their orthologues (K����� etal. 1995; L������ et al. 1998). But even in the absence of the orthologous candidate gene, the information from rice can be applied to increase the marker saturation of a defined chromosome region in barley, as it may be required for the
identifica-tion of a gene by posiidentifica-tional cloning. A systematic approach to the EST based marker saturation of a target region around the Rph16 rust resistance locus based on sequence information from rice was described recently (P������ et al. 2004). In this study, 309 non-redundant candidate ESTs were identified for this region out of a collection of over 320 000 public barley ESTs in a two-step in silico selection procedure. For mapping, fifty-four barley cDNA-clones were selected due to the even distribution of their homologues on a putatively colinear 3 Mb rice BAC-contig. Out of them, 97% (30) of the polymorphic markers could be genetically assigned in colinearity to the target region in barley and a set of eleven markers was integrated into a rph16 high-resolution map. Although the colinear target region of rice does not contain an obvious candidate gene for rph16, the results demonstrated the potential of the procedure to efficiently utilise EST resources for synteny-based marker saturation. A similar approach was successfully employed to saturate the chromosomal regions harbouring the GA-insensitive dwarfing gene sdw3, which is located on the same chromosome (G������� et al. 2004). The systematic genome-wide exploitation of the increasing sequence data resources will strongly improve our current view of genome conservation and likely facilitate a synteny-based isolation of genes conserved across cereal species.
Candidate gene identification by functional association
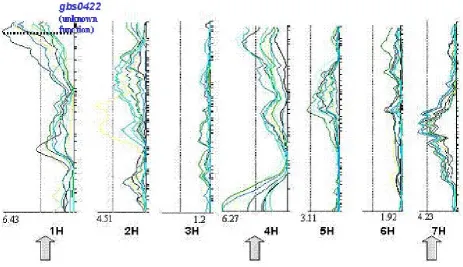
was based on a cDNA array comprising 1400 genes whose expression levels in a set of 10 European barley cultivars significantly correlated with the expression of the 7 malt parameters measured. This set of candidate genes contained genes that were already previously supposed to be related to malting quality (e.g. cysteine proteinase 1), genes hitherto unknown to be related to this trait (e.g. 70 kd heat shock protein) and genes of unknown function. In several cases genetic mapping of these candidate genes in the Steptoe/Morex cross re-vealed a congruency between the map location of the candidate gene and the presence of a QTL for malting quality (Figure 3).
Although these findings lend further strength to the validity of our functional association approach, it suffers from the limited resolution of QTL (quan-titative trait locus) mapping. Hence, additional data from a larger set of genotypes are required for further verification. In addition to the genetic mapping of candidate genes and subsequent QTL analysis in a bi-parental population, which inher-ently is confined to the segregation of two alleles
only, the genetic association of candidate genes may be analysed in a larger panel of genotypes using a case-control design.
CONCLUSIONS
While the development of molecular markers has shifted from anonymous DNA fragments to genes, the development of a comprehensive tran-script map of the barley genome is still at its be-ginning. ESTs are presently used on a large scale for the systematic development of SSR and SNP markers and it will be important to integrate the maps generated in different laboratories into a robust consensus map which needs to be curated in a coordinated and sustainable way. The same applies to the integration of trait data.
[image:6.595.65.529.85.352.2]in the rice genome and to exploit the rice sequence for an EST-based marker saturation in barley.
In addition to gene isolation by positional clon-ing, the availability of comprehensive cDNA and oligonucleotide arrays now provides an option for the systematic investigation of quantitatively inherited traits, using a functional association strat-egy. Undoubtedly the verification of the candidate genes obtained by this approach presents further challenges for the future. Complementary to the genetic mapping of the candidate genes, genom-ics studies are required to investigate whether candidate genes identified from the array analy-ses are regulated in cis or in trans, since only the cis-regulated genes will be amenable to marker assisted selection in plant breeding.
Despite the many issues that still await a solu-tion, the availability of a large collection of barley ESTs has set the stage for a systematic dissection of the genetic basis of agronomic traits in barley. The identification of the corresponding genes is expected to lead to the development of improved strategies to identify novel and useful alleles from the vast number of genetic resources that rest on the shelves of the gene banks or that are thriving in situ. In this way genome research can deliver a significant contribution to the use of biodiversity for the adaptation of barley to the future needs of mankind.
Acknowledgements.The authors are indebted to Prof. P������ H����, Oregon State University, and to innume-rable collaborators of the North American Barley Genome Mapping Program for providing mapping information and phenotypic data of the Steptoe/Morex population.
References
B���� D., P������� H., V�������� J., R���� J., B��� P. (2002): Alternative splicing and genome complexity. Nature Genetics, 30: 29–30.
G��� S.A., R���� D., L�� T.H., P������� G., W��� R.L. et al. (2002): A dra� sequence of the rice genome (Oryza sativa L. ssp. japonica). Science, 296: 92–100.
G������� S., B����� A., S���� N., S����� T., G����� A. (2004): The gibberellic-acid insensitive dwarfing gene sdw3 of barley is located on chromosome 2HS in a region that shows high colinearity with rice chromosome 7L. Molecular Genetics and Genomics,
271: 426–436.
H�������� Y., Y��� M., S������ A., S��� M., S������ T. et al. (1998): A high-density rice genetic linkage
map with 2275 markers using a single F2 population. Genetics, 148: 479–494.
K����� A., K����� D.A., K�������� A., Y��� M., K�-���� N., SK�-����K�-����� B., SK�-����� T. (1995): Rice-barley synteny and its application to saturation mapping of the barley Rpg1 region. Nucleic Acids Research,
23: 2729–2733.
K��� R., R��� S., F����� A., K������ G., T���� T., Z���� H., S���� N., M���� K., G����� A. (2003): Snipping polymorphisms from large EST collections in barley (Hordeum vulgare L.). Molecular Genetics and Genomics, 270: 224–233.
L������ D., K���� J., L����� D.A., Y��� M., S����� T. et al. (1998): Rapid reorganization of resistance gene homologues in cereal genomes. Proceedings of the National Academy of Sciences of the United States of America, 95: 370–375.
M������� W., K����� G., G����� A. (1999): Sequence analysis and gene identification in a set of mapped RFLP markers in barley (Hordeum vulgare). Genome,
42: 849–853.
M������� W., W������ W., P�������� K.P., G����� A. (2002): EST analysis in barley defines a unigene set comprising 4,000 genes. Theoretical and Applied Genetics, 104: 97–103.
M������� M., H������ M., P����� W. (2002): Mic-rosatellites are preferentially associated with non-repetitive DNA in plant genomes. Nature Genetics,
30: 194–200.
P������ D., S���� N., Z���� H., D������� A., P����� M., K��� R.,K������� D., G����� A. (2004): An integrated approach for comparative mapping in rice and barley with special reference to the Rph16 resistance locus. Functional & Integrative Genomics, 4: 74–83. P������� E., S����������� N., A��������� L., M�������
W., G����� A. (2002): Differential gene expression during seed germination in barley (Hordeum vulgare L.). Functional & Integrative Genomics, 2: 28–39. P������� E., C������ M., P����� M., K��� R., Z����
H., S����������� N., W��� M., G����� A.(2004): Functional association between malting quality trait components and cDNA array based expression pat-terns in barley (Hordeum vulgare L.). Molecular Breed-ing, 14: 153–170.
TAGI, The Arabidopsis Genome Initiative (2000): Analy-sis of the genome sequence of the flowering plant Arabidopsis thaliana. Nature, 408: 796–815.
T���� T., K��� R., G����� I., S���� N., G����� A. (2004): SNP2CAPS: a SNP and InDel analysis tool for CAPS marker development. Nucleic Acids Research, 32: No. 1 e5.
V������� R.K., T���� T., S���� N., L�������� P., G����� A. (2002): In silico analyses on frequency and distri-bution of microsatellites and ESTs of some cereal species. Cellular & Molecular Biology Le�ers, 7: 537–546.
Abstrakt
G����� A., T���� T., Z���� H., P������� E., P����� M., P������ D., K��� R., V������� R.K., S����� U., G����� I., S���� N. (2005): Molekulární mapování ječmene: přechod od strukturální úrovně k funkční.Czech J. Genet. Plant Breed., 41: 81–88.
Jako zdroje pro strukturální a funkční analýzu genomu ječmene bylo získáno více než 140 000 ESTs (expressed sequence tags – exprimovaných sekvencí) z celkem 22 cDNA knihoven, což reprezentuje 25 224 potenciálních genů. Asi 50 % z nich patří genovým rodinám. Velikost úplného transkriptomu je odhadována na 35 000 až 75 000 genů. ESTs kolekce ječmene představuje bohatý zdroj pro tvorbu nových markerů, zahrnující SSRs (simple sequence repeats – jednoduché sekvenční repetice) a SNPs (single nucleotide polymorphisms – jednotlivý nukleo- tidový polymorfismus). Bylo vytvořeno několik bioinformačních nástrojů umožňujících počítačové zpracování ESTs databází s cílem vyhledávání SNPs nebo SSRs a tvorby SNPs odvozených z CAPS (rozštěpené množené polymorfické sekvence) markerů. Ve snaze o systematické mapování genů ječmene je konstruována transkripč-ní mapa s vysokou hustotou, která v současné době obsahuje více než 1000 markerů. Tato mapa je vstupem do komparativní genomiky se zvláštním důrazem na genom rýže. Bylo zjištěno, že 65 % mapovaných ESTs vykazuje průkaznou homologii k rýžovým ESTs, což znamená syntenický vztah mezi ječmenem a rýží. Proto ESTs ječ-mene umožňují rychlý a systematický přenos genetických (genomických) poznatků z rýže do ječječ-mene a jiných druhů čeledi Triticeae. Toho může být pohotově využito pro nasycení definovaných chromozomálních oblastí markery a jejich detailní srovnávání s rýží. Funkční genomika v tomto kontextu může být využita pro studium komplexního znaku jako “sladovnická kvalita” pomocí sady cDNA. Korelací fenotypických údajů sladovnické kvality u vybraných linií ječmene s odpovídajícími profily byl identifikován soubor genů – kandidátů a ten byl dále verifikován genetickou analýzou.
Klíčová slova: ESTs; funkční genomika; sladovnická kvalita; DNA-markery; rýže; synteny
Corresponding author:
Prof. A������ G�����, Institute of Plant Genetics and Crop Plant Research (IPK), Genebank, Corrensstrasse 3, D-06466, Gatersleben, Germany
tel.: + 49 394 825 527, fax: + 49 394 825 155, e-mail: [email protected]
Y� J., H� S.N., W��� J., L� S.G., W��� K.S.G. et al. (2001): A dra� sequence of the rice (Oryza sativa ssp. indica) genome. Chinese Science Bulletin, 46: 1937–1942. Z���� H., S����������� N., W������,W., S���� N., R���
S., R������ V., P������� E., S����� U., S�������� P., Z������ U., L�������� P., V������� R.K., W���� U., G����� A. (2004): Large scale analysis of the barley transcriptome based on expressed sequence tags. Plant Journal, 40: 276–290.