Evaluation of High Frequency Vibrations Using Electronic Speckle Pattern Interferometry
Vincent Toal, Henry Rice*, Craig Meskell*, Carol Armstrong, Brian Bowe
Centre for Industrial and Engineering Optics, Dublin Institute of Technology
*Department of Mechanical and Manufacturing Engineering, Trinity College Dublin
Abstract
The available techniques for the study of high frequency vibration using electronic speckle pattern interferometry (ESPI) are briefly surveyed. We concentrate on two methods in particular. The first is a straightforward approach in which a CCD camera is used having a frame rate of at least twice the highest vibration frequency so that the sampling criterion is satisfied. The images are processed and analysed off-line. Digital phase shifting can be also implemented for detailed fringe analysis. The second approach is time-averaged ESPI in which the Bessel fringe function can be analysed in real time by modulating the optical path difference in the interferometer. This can be done either by using a vibrating component or, as in the present work, by direct modulation of the laser wavelength at the frequency of the vibrating mode.
1. Introduction
Optical inspection techniques have three advantages over conventional methods: they are full-field
and non-contact in FKDUDFWHUDQGPD\GHWHFWDJUHDWQXPEHURIGHIHFWV?lectronic speckle pattern
interferometry, along with other coherent optical techniques, has already been proven to be an
effective technique in non-destrructive testing of materials and components. In ESPIa speckle
pattern is formed by illuminating the surface of the object to be tested with laser light. This speckle pattern is imaged onto a CCD array and allowed to interfere with a reference wave, which may or may not be speckled. The resultant speckle interference pattern is transferred to a frame grabber on board a computer, saved in memory, and displayed on a monitor. When the object has been deformed or displaced, the resultant speckle pattern changes owing to the change in path difference between the wave front from the surface and the reference wave. The second resultant speckle pattern is transferred to the computer and subtracted from the stored pattern and the result rectified. The resulting interferogram is displayed on the monitor as a pattern of dark and bright fringes, called correlation fringes. In real time it is possible to capture frames continuously while a deformation is occurring and then subtract them in succession from the first speckle pattern. This process makes it possible to observe the real-time formation and the progressive changes of the fringe pattern related to the deformation of the surface. ESPI detects the deformations in the sub-micrometer range, of the surface of a stressed object. Depending on the design of the interferometer, in-plane sensitivity or out-of–plane sensitivity can be obtained.
2. Theory and experiment (high frame rate)
The intensity I of the interference pattern that results when two mutually coherent light beams are
superimposed in space is 1
1 cos
2 I I φ
I I
where I1 (x,y) and I2 (x,y) are the intensities of the object and reference beams and φ(x,y) is the
phase difference between them.
When the object is displaced by an amount that is small enough so that I1 (x,y) + I2(x,y) is
unchanged and only φ(x,y) changes by δ, we have
Subtraction from eq. 1 gives
When this signal is rectified and displayed on a monitor we obtain a fringe pattern with maximum
intensity where δ = nπ with n an integer. This is the technique that is used for static testing. It can
also be used when the object is in rapid motion providing that the incoming video frames are captured at sufficiently rapid rates. Alternatively the laser illumination can be pulsed once for each of I and I’ in which case the fringe pattern is indicative of the object displacement that occurred in the time between the pulses. The displacement of the object between the two frames that are to be
subtracted from one another must not be so large as to cause speckle decorrelation1. At our
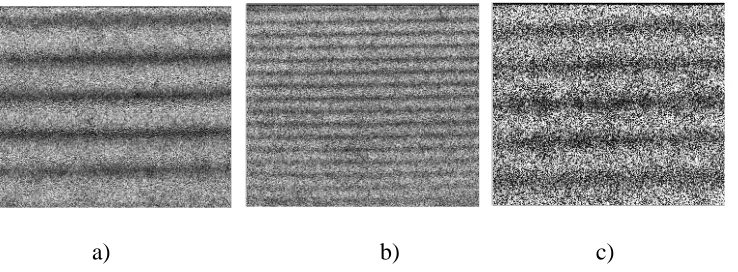
laboratory we have implemented this technique using a CCD camera that can operate at up to 10,000 frames per second with reduced format at the higher frame rates. The images are stored in memory and subtracted from one another off-line. In fig. 1 fringes due to rotation of a disc in its plane are shown. An in-plane sensitive ESPI system reference was used with a 50 mWatt laser diode operating at 780 nm.
[image:2.612.91.460.465.601.2]a) b) c)
Fig 1 Results of frame subtraction for a rotating disc a) 125 frames s-1 b) 250 frames s-1, c) 1000
frames s-1
Digital phase shifting can also be implemented to provide fringe analysis. To do this we record a 2 ) cos(
2 1 2
2 1
' = + + φ +δ
I I I
I I
) 2 / sin( ) 2 / sin(
4 1 2
' = φ +δ δ
calculation that the initial phase is φ + δ with φ the random speckle phase and -δ the subsequent
phase change at x,y due to the object displacement2.
We then record I’ with the object in motion at a time when the phase changed by -δ.
φ
cos 2
' I1 I2 I1I2
I = + +
Subtracting each of the four phase shifted frames in turn from I’ gives
[
]
[
]
[
]
[
cos cos( 3 /2)]
2 ) cos( cos 2 ) 2 / cos( cos 2 ) cos( cos 2 2 1 4 2 1 3 2 1 2 2 1 1 π δ φ φ π δ φ φ π δ φ φ δ φ φ + + − = + + − = + + − = + − = I I I I I I I I I I I I ) tan( ) cos( 2 ) sin( 2 ) cos( ) cos( ) 2 / 3 cos( ) 2 / cos( 3 1 2 4 δ φ δ φ δ φ δ φ π δ φ π δ φ π δ φ + = + − + − = + − + + + + − + + = − − I I I I
Averaging over several pixels, this last expression is simply tanδ. We can assign δ to its proper
quadrant by considering simultaneously the signs of the numerator and denominator in the expression
The result of this operation is a wrapped phase map, modulo 2π, which must then be unwrapped.
3. Time averaged ESPI
Fast frame rate CCD cameras can provide useful information in a mechanically or thermally disturbed environment. The technique can cope with non-cyclic displacement. However, as explained above, processing has to be done off-line so care is needed to ensure that all the relevant data has been gathered. The laser must also provide adequate exposure at high frame rates.
) cos(
2 1 2
2 1
0 =I +I + I I φ +δ
I
) 2 / cos(
2 1 2
2 1 2
/
φ
δ
π
π = I +I + I I + +
I
) cos(
2 1 2
2
1
φ
δ
π
π = I +I + I I + +
I ) 2 / 3 cos(
2 1 2
2 1 2 /
3π =I +I + I I φ+δ + π
If object motion is vibratory, then the above technique can still be used but the framing rate of the camera must be at least twice the frequency of the vibration. An alternative approach is to use a camera, which has a modest frame rate and use the integrating time T of the camera to obtain fringe patterns. Assuming that the object is vibrating out-of-plane in an out-of-plane sensitive ESPI system
with displacement amplitude d0 so that the phase difference between object and reference beams in
the interferometer at the CCD array is3
4π(d0/λ)sin(ω0t+φ0)=a0 sin(ω0t+φ0)
{
a t}
dt T I I I I I T ) + ( + +=
∫
0 0 00 2 1 2
1 cos sin
1 2
becomes 1
eq. ω φ
where ω0 is the angular frequency of vibration, λ is the laser wavelength and φ0is the relative phase. It is assumed that the illumination and observation directions are both normal to the surface of the object.
Applying a high pass filter and rectifying the result leaves the expression
{
0 0 0}
20 2
1 cos sin
1 4 ) + (
∫
a t dtT I I T φ ω
Rewriting the integrand as
when T >> 2π/ω0.
However the object may vibrate at a number of frequencies4, which superimpose to produce a
displacement d(t), whose Fourier expansion is given by
∑
+= k
k
k k t
a t
d( )/ sin( )
4π λ ω0 φ
{
sin}
( )
exp( )exp 0 (ω0 +φ0) =
∑
0 ω0 +φ0∞ −∞ = t in a J t ia n n
{
sin}
( )
3 cos 1 0 2 0 2 0 0 0 0 a J dt t a T T = ) + ({
}
{
}
(
)
{
k}
k k n n k k k k k k n t nk i a J t k ia t k a i t d φ ω φ ω φ ω λ π + = + = + =
∏∑
∏
∑
0 0 0 exp ) ( ) sin( exp ) sin( exp / ) ( 4 cos{ }
{
(
)
}
20 0 2 0 exp ) ( 1 ) ( ( cos 1 + =
∫∏∑
∫
T k kk k n T dt n t nk i a J T dt t a
T ω φ
For T>>2π/ω0 this last expression will only be significant for nk = 0 and we leave out the dc term (k=0) giving
{ }
( )
kk T a J dt t a
T
∫
=∏
2 0 2 0 ) ( cos 1
In either the single or multi-mode case, fringes will only be visible at low amplitudes of vibration as
J02(ak) first reaches zero for displacements of typically less than 100nm.
In the multi-mode case, provided that the displacement amplitude is sufficiently small, it is possible
by heterodyning, to extract the fringe pattern corresponding to each individual mode3.
In the single mode case it is possible to modulate the path difference in the interferometer in amplitude and/or phase in order to shift the envelope of the zero order Bessel function along the
amplitude axis3
.
Modulation of the path difference is usually done by vibrating a mirror in the reference beam path by means of a piezoelectric crystal or by wrapping an optical fibre which guides the reference beam around a piezoelectric cylinder. Here the laser source is a 50 mW diode of wavelength 780 nm which can be directly modulated so as to alter its wavelength.
Assume that the object is vibrating in a single mode and that the laser is wavelength modulated so
that ar and φr are the amplitude and phase of the modulation of the optical path difference in the
{
0 0 0}
20 2
1 cos sin
1 4 ) + (
∫
a t dtT I I
T
φ
ω (eq. 3) is modified to become
{
}
[
]
{
1/2}
0 0 2 2 0 2 0 2 0 0 0 0 0 2 1 ) cos( 2 ) sin( sin cos 1 4 r r r r r T a a a a J dt t a t a T I I φ φ φ ω φ ω − − + = + − ) + (
∫
The value of this expression is maximum when its argument is minimum so that when φr=φ0 then
the brightest fringe is the contour of points on the object with a0 =ar. When ar=a0 the brightest
fringe is the contour of points on the object with φ0=φr 3.
Experimental
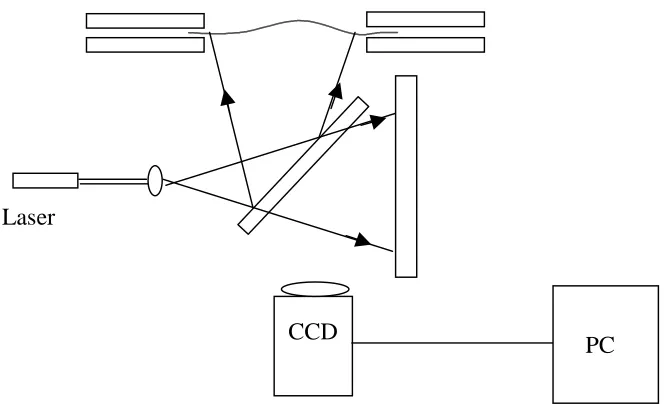
The optical arrangement is shown in Fig. 2. The beam from the diode is expanded by a 40X microscope objective and divided into object and reference beams by a 50:50 beamsplitter. The reflected light is scattered from the object, a rectangular plate painted matt white. Transmitted light is scattered from a fixed vertical surface and the beams are recombined at the beamsplitter. Thus an image of the object is combined with reference light at the CCD array, averaged over the frame time and converted to a bitmap for storage in computer memory. Subsequent images can be subtracted from the stored one pixel by pixel. Alternatively the filtered and rectified image can be displayed directly on a monitor.
The object plate clamped at the ends by bolts and driven into oscillation by a piezoceramic wafer
∗(PSI-5A-S4, Piezo Systems Inc.) attached to its surface. The wafer dimensions are 63 mm x 12.5
mm x 0.2 mm. It is poled through its thickness and has nickel electrodes attached. It is fixed to the plate using conducting cyano-acrylate adhesive. A Dantec laser Doppler vibrometer was used to obtain the mode spectrum of the plate when the wafer was driven by a chirped random signal of typically 1V in the range 0-2kHz.
Fig. 2 Out-of-plane sensitive ESPI system
Laser modulation
We require modulation of the optical path difference (opd) in the interferometer of sufficient magnitude so that the whole of a typical vibration fringe pattern can be mapped out. In other words we need to ensure that the brightest fringe can be made to contour the maximum amplitude of object vibration. For example if the order of a fringe produced by out of plane vibration is 5, the
corresponding amplitude of vibration is about 1.25λ, the value that the opd must reach for this
fringe to be the brightest in the pattern. In order to calibrate the path difference against modulation voltage, an image was stored with no modulation of the laser and the object at rest. Image subtraction was initiated and a low frequency (0.005Hz) modulation voltage was applied to the laser while observing the resuilting fringe pattern on the monitor. With a path difference of about 90 cm
in the interferometer it was found that a modulation of 14 mV produced an change in opd of 0.5 λ.
As the modulation voltage can be set at up to 400mV without significant change in the laser output intensity, this enables us to evaluate fringe patterns with large numbers of fringes assuming that the fringes are resolved on the monitor.
Results
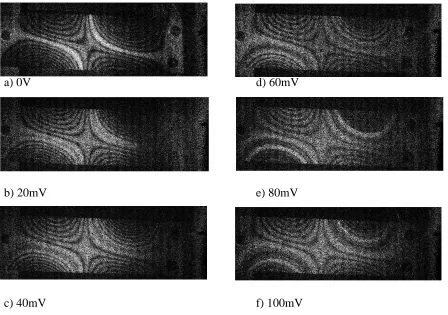
The images presented in Fig. 3 show the effect of changing the modulating voltage applied to the laser diode. It can be seen, despite the poor quality of the fringes, that as the modulating voltage increases, the brightest fringe moves away from the nominal node (i.e. the brightest fringe in Fig. 3 a) connected to the plate clamping bolts.
CCD
a) 0V d) 60mV
b) 20mV e) 80mV
[image:8.612.61.509.62.377.2]c) 40mV f) 100mV
Fig. 3 Effect of laser diode modulation, plate vibrating at 537.5Hz
In Fig. 4 the effect of changing the phase of the modulation is seen. Comparing b) and c) it is seen that the two halves of the plate are in antiphase around the s-shaped node in a).
a) 0V b) 70mV 1100
c) 70 mV 2900
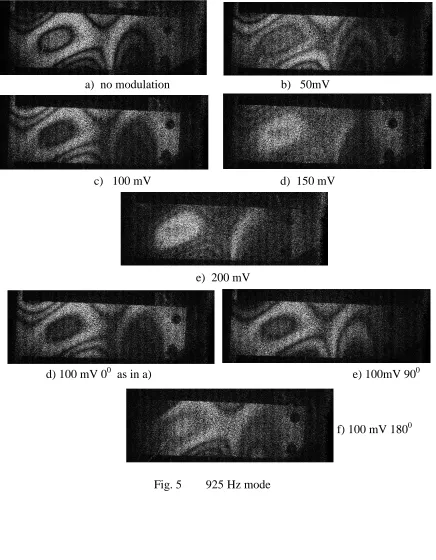
Fig 5 shows the 925 Hz mode.
a) no modulation b) 50mV
c) 100 mV d) 150 mV
e) 200 mV
d) 100 mV 00 as in a) e) 100mV 900
[image:9.612.55.491.115.675.2]f) 100 mV 1800
Conclusion
The results obtained from this work are preliminary but they demonstrate:
1) the use of high frame rate CCDs in conventional subtraction ESPI allowing for the study of
rapid motion with interferometric sensitivity in thermally and mechanically noisy environments
2) diode laser modulation in order to extract the phase and amplitude of modal vibrations in time
averaged electronic speckle pattern interferometry. This is of added significance in the context of our recent work on holographic optical elements recorded in the visible light with image
reconstruction at laser diode wavelengths5.
References
1. C. Wykes and R. Jones, “Holographic and Speckle Interferometry”, Cambridge University
Press, Cambridge 1983
2. D. Albrecht “Electronic Speckle Pattern Interferometry, Instruments Development,
Optimisation and Applications”, pub. No. I.99.40, European Commission Joint Research Centre, Doctoral Thesis, U. of Loughborough,1998
3. O. J. Lokberg and K. Hogmoen, J. Phys. E. Scientific Instruments, 9, 847-51,1976
4. H. M. Pedersen, O. J. Lokberg, H. Valo and G. Wang, Optics Communications, 104,271-6,
1994
5. S. R. Guntaka, V. Toal and S. Martin, Proc. SPIE 4876, OptoIreland 07, paper 173, Galway,