O R I G I N A L I N V E S T I G A T I O N
Genetic variation in the immunosuppression pathway genes
and breast cancer susceptibility: a pooled analysis of 42,510 cases
and 40,577 controls from the Breast Cancer Association
Consortium
Jieping Lei
1•Anja Rudolph
1•Kirsten B. Moysich
2•Sabine Behrens
1•Ellen L. Goode
3•Manjeet K. Bolla
4•Joe Dennis
4•Alison M. Dunning
5•Douglas F. Easton
4,5•Qin Wang
4•Javier Benitez
6,7•John L. Hopper
8•Melissa C. Southey
9•Marjanka K. Schmidt
10•Annegien Broeks
10•Peter A. Fasching
11,12•Lothar Haeberle
11•Julian Peto
13•Isabel dos-Santos-Silva
13•Elinor J. Sawyer
14•Ian Tomlinson
15•Barbara Burwinkel
16,17•Frederik Marme´
16,18•Pascal Gue´nel
19,20•The´re`se Truong
19,20 •Stig E. Bojesen
21,22,23 •Henrik Flyger
24•Sune F. Nielsen
22•Børge G. Nordestgaard
22,23•Anna Gonza´lez-Neira
6•Primitiva Mene´ndez
25•Hoda Anton-Culver
26 •Susan L. Neuhausen
27•Hermann Brenner
28,29,30 •Volker Arndt
28•Alfons Meindl
31•Rita K. Schmutzler
32,33,34•Hiltrud Brauch
30,35,36•Ute Hamann
37 •Heli Nevanlinna
38•Rainer Fagerholm
38 •Thilo Do¨rk
39•Natalia V. Bogdanova
40•Arto Mannermaa
41,42,43 •Jaana M. Hartikainen
41,42,43•Australian Ovarian Study Group
44•kConFab Investigators
45•Laurien Van Dijck
46 •Ann Smeets
47•Dieter Flesch-Janys
48,49•Ursula Eilber
1•Paolo Radice
50 •Paolo Peterlongo
51•Fergus J. Couch
52•Emily Hallberg
3•Graham G. Giles
8,53•Roger L. Milne
8,53•Christopher A. Haiman
54•Fredrick Schumacher
54•Jacques Simard
55•Mark S. Goldberg
56,57 •Vessela Kristensen
58,59,60 •Anne-Lise Borresen-Dale
58,59•Wei Zheng
61•Alicia Beeghly-Fadiel
61•Robert Winqvist
62,63 •Mervi Grip
64•Irene L. Andrulis
65,66•Gord Glendon
65•Montserrat Garcı´a-Closas
67,68•Jonine Figueroa
68 •Kamila Czene
69•Judith S. Brand
69•Hatef Darabi
69•Mikael Eriksson
69•Per Hall
69•Jingmei Li
69•Angela Cox
70 •Simon S. Cross
71•Paul D. P. Pharoah
4,5•Mitul Shah
5•Maria Kabisch
37•Diana Torres
37,72•Anna Jakubowska
73 •Jan Lubinski
73•Foluso Ademuyiwa
74•Christine B. Ambrosone
74•Anthony Swerdlow
75,76•Michael Jones
75•Jenny Chang-Claude
1,77Received: 30 July 2015 / Accepted: 13 November 2015 / Published online: 30 November 2015 ÓThe Author(s) 2015. This article is published with open access at Springerlink.com
Abstract
Immunosuppression plays a pivotal role in
assisting tumors to evade immune destruction and
pro-moting tumor development. We hypothesized that genetic
variation in the immunosuppression pathway genes may be
implicated in breast cancer tumorigenesis. We included
42,510 female breast cancer cases and 40,577 controls of
European ancestry from 37 studies in the Breast Cancer
Association Consortium (
2015
) with available genotype
data for 3595 single nucleotide polymorphisms (SNPs) in
133 candidate genes. Associations between genotyped
SNPs and overall breast cancer risk, and secondarily
according to estrogen receptor (ER) status, were assessed
using multiple logistic regression models. Gene-level
associations were assessed based on principal component
Jieping Lei and Anja Rudolph share the first authorship.
Electronic supplementary material The online version of this article (doi:10.1007/s00439-015-1616-8) contains supplementary material, which is available to authorized users.
& Jenny Chang-Claude
1 Division of Cancer Epidemiology, German Cancer Research
Center (DKFZ), Im Neuenheimer Feld 581, 69120 Heidelberg, Germany
2 Department of Cancer Prevention and Control, Roswell Park
Cancer Institute, Buffalo, NY, USA
3 Department of Health Sciences Research, Mayo Clinic,
analysis. Gene expression analyses were conducted using
RNA sequencing level 3 data from The Cancer Genome
Atlas for 989 breast tumor samples and 113 matched
nor-mal tissue samples. SNP rs1905339 (A
[
G) in the
STAT3
region was associated with an increased breast cancer risk
(per allele odds ratio 1.05, 95 % confidence interval
1.03–1.08;
p
value
=
1.4
9
10
-6). The association did not
differ significantly by ER status. On the gene level, in
addition to
TGFBR2
and
CCND1
,
IL5
and
GM
-
CSF
showed the strongest associations with overall breast
can-cer risk (
p
value
=
1.0
9
10
-3and 7.0
9
10
-3,
respec-tively). Furthermore,
STAT3
and
IL5
but not
GM
-
CSF
were
differentially expressed between breast tumor tissue and
normal tissue (
p
value
=
2.5
9
10
-3, 4.5
9
10
-4and
0.63, respectively). Our data provide evidence that the
immunosuppression pathway genes
STAT3, IL5,
and
GM
-CSF
may be novel susceptibility loci for breast cancer in
women of European ancestry.
Abbreviations
BCAC
Breast Cancer Association Consortium
CCND1
Cyclin D1
CI
Confidence interval
COGS
Collaborative Oncological Gene-Environment
Study
DNA
Deoxyribonucleic acid
GM-CSF
Granulocyte-macrophage colony stimulating
factor
EM
Estimation maximization
ENCODE
Encyclopedia of DNA elements
eQTL
Expression quantitative trait loci
ER
Estrogen receptor
GWAS
Genome-wide association study
HWE
Hardy–Weinberg equilibrium
IL5
Interleukin 5
LD
Linkage disequilibrium
MAF
Minor allele frequency
MDSCs
Myeloid-derived suppressor cells
OR
Odds ratio
PCs
Principal components
PTRF
Polymerase I and transcript release factor
Quantile–quantile
RSEM
RNA-Seq by expectation-maximization
SD
Standard deviation
SNPs
Single nucleotide polymorphisms
STAT3
Signal transducer and activator of
transcription 3
TCGA
The Cancer Genome Atlas
TGFBR2
Transforming growth factor beta receptor II
Treg cells
Regulatory T cells
TUBG2
Tubulin, gamma 2
4 Centre for Cancer Genetic Epidemiology, Department of
Public Health and Primary Care, University of Cambridge, Cambridge, UK
5 Centre for Cancer Genetic Epidemiology, Department of
Oncology, University of Cambridge, Cambridge, UK
6 Human Cancer Genetics Program, Spanish National Cancer
Research Centre, Madrid, Spain
7 Centro de Investigacio´n en Red de Enfermedades Raras,
Valencia, Spain
8 Centre for Epidemiology and Biostatistics, Melbourne School
of Population and Global Health, The University of Melbourne, Melbourne, Australia
9 Department of Pathology, The University of Melbourne,
Melbourne, Australia
10 Netherlands Cancer Institute, Antoni van Leeuwenhoek
Hospital, Amsterdam, The Netherlands
11 Department of Gynaecology and Obstetrics, University
Hospital Erlangen, Friedrich-Alexander University Erlangen-Nuremberg, Comprehensive Cancer Center Erlangen-EMN, Erlangen, Germany
12 David Geffen School of Medicine, Department of Medicine
Division of Hematology and Oncology, University of California at Los Angeles, Los Angeles, CA, USA
13 Department of Non-Communicable Disease Epidemiology,
London School of Hygiene and Tropical Medicine, London, UK
14 Research Oncology, Guy’s Hospital, King’s College London,
London, UK
15 Wellcome Trust Centre for Human Genetics and Oxford
NIHR Biomedical Research Centre, University of Oxford, Oxford, UK
16 Department of Obstetrics and Gynecology, University of
Heidelberg, Heidelberg, Germany
17 Molecular Epidemiology Group, German Cancer Research
Center (DKFZ), Heidelberg, Germany
18 National Center for Tumor Diseases, University of
Heidelberg, Heidelberg, Germany
19 Environmental Epidemiology of Cancer, Center for Research
in Epidemiology and Population Health, INSERM, Villejuif, France
20 University Paris-Sud, Villejuif, France
21 Copenhagen General Population Study, Herlev Hospital,
Copenhagen University Hospital, Herlev, Denmark
22 Department of Clinical Biochemistry, Herlev Hospital,
Copenhagen University Hospital, Herlev, Denmark
23 Faculty of Health and Medical Sciences, University of
Copenhagen, Copenhagen, Denmark
24 Department of Breast Surgery, Herlev Hospital, Copenhagen
Introduction
Breast cancer is the most frequent cancer among women
and the second leading cause of cancer-related death after
lung cancer in Europe. In addition to genetic variants with
high and moderate penetrance, more than 90 common
germline genetic variants contributing to breast cancer risk
have been identified, comprising about 37 % of the familial
relative risk of the disease (Michailidou et al.
2013
,
2015
).
This suggests that a substantial portion of inherited
varia-tion has not yet been identified. In addivaria-tion, most of the
known common susceptibility variants reside in non-coding
regions and result in subtle regulation of gene expression.
The biological mechanisms through which genetic variants
exert their functions are still not entirely understood.
The ability to evade immune destruction has been
increasingly recognized as a key hallmark of tumors
(Hanahan and Weinberg
2011
). Tumor cells may secrete
immunosuppressive factors like TGF-
b
which hampers
infiltrating cytotoxic T lymphocytes and natural killer cells
(Yang et al.
2010
). Inflammatory cells like regulatory T
cells (Treg cells), a subset of CD4
?
T lymphocytes, as well
as myeloid-derived suppressor cells (MDSCs) may be
recruited into the tumor environment, which are actively
immunosuppressive (Lindau et al.
2013
; Reisfeld
2013
).
Higher prevalence of Treg cells has been found in various
cancers (Chang et al.
2010
; Michel et al.
2008
; Watanabe
et al.
2002
), including breast cancer (Bates et al.
2006
).
There is evidence that tumor infiltrating Treg cells endowed
with immunosuppressive potential are associated with
tumor progression and unfavorable prognosis, especially in
estrogen receptor (ER)-negative breast cancer (Bates et al.
2006
; Kim et al.
2013
; Liu et al.
2012a
). In addition,
infil-trating MDSCs were also found in murine mammary tumor
models (Aliper et al.
2014
; Gad et al.
2014
), but their
rel-evance for breast cancer patients also in terms of prognosis
is not well-understood. Furthermore, previous association
studies have identified susceptibility alleles for breast
can-cer in two genes,
TGFBR2
(transforming growth factor beta
receptor II) (Michailidou et al.
2013
) and
CCND1
(cyclin
D1) (French et al.
2013
), which may be involved in immune
regulation in cancer patients (Gabrilovich and Nagaraj
2009
; Krieg and Boyman
2009
), including those with breast
cancer. We hypothesized that immunosuppression pathway
genes, particularly those relevant to Treg cell and MDSC
functions, may harbor further susceptibility variants
asso-ciated with breast cancer tumorigenesis, with a possible
differential association by ER status.
In this analysis, we investigated associations between
breast cancer risk and single nucleotide polymorphisms
(SNPs) in 133 candidate genes in the immunosuppression
pathway in individual level data from the Breast Cancer
Association Consortium (BCAC). We also assessed
asso-ciations with breast cancer risk at the gene and pathway
25 Servicio de Anatomı´a Patolo´gica, Hospital Monte Naranco,
Oviedo, Spain
26 Department of Epidemiology, University of California Irvine,
Irvine, CA, USA
27 Beckman Research Institute of City of Hope, Duarte, CA,
USA
28 Division of Clinical Epidemiology and Aging Research,
German Cancer Research Center (DKFZ), Heidelberg, Germany
29 Division of Preventive Oncology, National Center for Tumor
Diseases (NCT) and German Cancer Research Center (DKFZ), Heidelberg, Germany
30 German Cancer Consortium (DKTK), German Cancer
Research Center (DKFZ), Heidelberg, Germany
31 Division of Gynaecology and Obstetrics, Technische
Universita¨t Mu¨nchen, Munich, Germany
32 Center for Hereditary Breast and Ovarian Cancer, University
Hospital of Cologne, Cologne, Germany
33 Center for Integrated Oncology (CIO), University Hospital of
Cologne, Cologne, Germany
34 Center for Molecular Medicine Cologne (CMMC),
University of Cologne, Cologne, Germany
35 Dr. Margarete Fischer-Bosch-Institute of Clinical
Pharmacology Stuttgart, Stuttgart, Germany
36 University of Tu¨bingen, Tu¨bingen, Germany
37 Molecular Genetics of Breast Cancer, German Cancer
Research Center (DKFZ), Heidelberg, Germany
38 Department of Obstetrics and Gynecology, Helsinki
University Hospital, University of Helsinki, Helsinki, Finland
39 Gynaecology Research Unit, Hannover Medical School,
Hannover, Germany
40 Department of Radiation Oncology, Hannover Medical
School, Hannover, Germany
41 Cancer Center, Kuopio University Hospital, Kuopio, Finland 42 Institute of Clinical Medicine, Pathology and Forensic
Medicine, University of Eastern Finland, Kuopio, Finland
43 Imaging Center, Department of Clinical Pathology, Kuopio
University Hospital, Kuopio, Finland
44 Department of Genetics, QIMR Berghofer Medical Research
Institute, Brisbane, QLD, Australia
45 The Peter MacCallum Cancer Centre, Melbourne, VIC,
Australia
46 VIB Vesalius Research Center, Department of Oncology,
University of Leuven, Leuven, Belgium
47 Multidisciplinary Breast Center, University Hospitals
Leuven, University of Leuven, Leuven, Belgium
48 Institute for Medical Biometrics and Epidemiology,
levels. Furthermore, we used publicly available datasets
through the UCSC Genome Browser (
2015
) to examine the
putative genetic susceptibility loci for potential regulatory
function.
Materials and methods
Study participants
In this analysis, participants were restricted to 83,087
women of European ancestry from 37 case–control studies
participating in BCAC, including 42,510 invasive breast
cancer cases with stage I–III disease and 40,577
cancer-free controls. Of all breast cancer patients, 26,094 were
known to have positive disease and 6870 to have
ER-negative disease. Details of included studies are
summa-rized in Online Resource 1. All studies were approved by
the relevant ethics committees and all participants gave
informed consent (Michailidou et al.
2013
).
Candidate gene selection
Candidate genes relevant to the Treg cell and MDSC
pathways were identified through a comprehensive
litera-ture review in PubMed (DeNardo et al.
2010
; DeNardo and
Coussens
2007
; Driessens et al.
2009
; Gabrilovich and
Nagaraj
2009
; Krieg and Boyman
2009
; Mills
2004
;
Ostrand-Rosenberg
2008
; Poschke et al.
2011
; Sakaguchi
et al.
2013
; Sica et al.
2008
; Wilczynski and Duechler
2010
; Zitvogel et al.
2006
; Zou
2005
), using the search
terms
‘‘immunosuppression’’/‘‘immunosuppressive’’,
‘‘regulatory T cells’’/‘‘Treg cells’’/‘‘FOXP3
?
T cells’’,
‘‘myeloid derived suppressor cells’’/‘‘MDSCs’’,
‘‘im-munosurveillance’’, and ‘‘tumor escape’’. The final
candi-date gene list included 133 immunosuppression-related
genes (Online Resource 2). SNPs within 50 kb upstream
and downstream of each gene were identified using
Hap-Map CEU genotype data (
2015
) and dbSNP 126.
SNP association analyses
For the BCAC studies, genotyping was carried out using a
custom Illumina iSelect array (iCOGS) designed for the
Collaborative
Oncological
Gene-Environment
Study
(COGS) project (Michailidou et al.
2013
). Of the 211,155
SNPs on the array, 4246 were located within 50 kb of the
selected candidate genes. Centralized quality control of
genotype data led to the exclusion of 651 SNPs. The
exclusion criteria included a call rate less than 95 % in all
samples genotyped with iCOGS, minor allele frequency
(MAF) less than 0.05 in all samples, evidence of deviation
from Hardy–Weinberg equilibrium (HWE) at
p
value
\
10
-7, and concordance in duplicate samples less than
98 % (Michailidou et al.
2013
). A total of 3595 SNPs
passed all quality controls and was analyzed.
49 Department of Cancer Epidemiology, Clinical Cancer
Registry, University Medical Center Hamburg-Eppendorf, Hamburg, Germany
50 Unit of Molecular Bases of Genetic Risk and Genetic
Testing, Department of Preventive and Predictive Medicine, Fondazione IRCCS (Istituto Di Ricovero e Cura a Carattere Scientifico) Istituto Nazionale dei Tumori (INT), Milan, Italy
51 IFOM, Fondazione Istituto FIRC (Italian Foundation of
Cancer Research) di Oncologia Molecolare, Milan, Italy
52 Department of Laboratory Medicine and Pathology, Mayo
Clinic, Rochester, MN, USA
53 Cancer Epidemiology Centre, Cancer Council Victoria,
Melbourne, Australia
54 Department of Preventive Medicine, Keck School of
Medicine, University of Southern California, Los Angeles, CA, USA
55 Genomics Center, Centre Hospitalier Universitaire de
Que´bec Research Center, Laval University, Que´bec City, Canada
56 Department of Medicine, McGill University, Montreal,
Canada
57 Division of Clinical Epidemiology, Royal Victoria Hospital,
McGill University, Montreal, Canada
58 Department of Genetics, Institute for Cancer Research, Oslo
University Hospital Radiumhospitalet, Oslo, Norway
59 K.G. Jebsen Center for Breast Cancer Research, Institute of
Clinical Medicine, Faculty of Medicine, University of Oslo, Oslo, Norway
60 Department of Clinical Molecular Biology, Oslo University
Hospital, University of Oslo, Oslo, Norway
61 Division of Epidemiology, Department of Medicine,
Vanderbilt-Ingram Cancer Center, Vanderbilt University School of Medicine, Nashville, TN, USA
62 Laboratory of Cancer Genetics and Tumor Biology,
Department of Clinical Chemistry and Biocenter Oulu, University of Oulu, Oulu, Finland
63 Central Finland Hospital District, Jyva¨skyla¨ Central Hospital,
Jyva¨skyla¨, Finland
64 Department of Surgery, Oulu University Hospital, University
of Oulu, Oulu, Finland
65 Lunenfeld-Tanenbaum Research Institute of Mount Sinai
Hospital, Toronto, Canada
66 Department of Molecular Genetics, University of Toronto,
Toronto, Canada
67 Division of Genetics and Epidemiology, The Institute of
Cancer Research, London, UK
68 Division of Cancer Epidemiology and Genetics, National
Per-allele associations with the number of minor alleles
were assessed using multiple logistic regression models,
adjusted for study, age (at diagnosis for cases or at
recruitment for controls) and nine principal components
(PCs) derived based on genotyped variants to account for
European population substructure. We assessed the
asso-ciations of SNPs with overall breast cancer risk as primary
analyses, and then restricted to ER-positive (26,094 cases
and 40,577 controls) and ER-negative subtypes (6870 cases
and 40,577 controls) as secondary analyses. Differences in
the associations between ER-positive and ER-negative
diseases were assessed by case-only analyses, using ER
status as the dependent variable. To determine the number
of ‘‘independent’’ SNPs for adjustment of multiple testing,
we applied the option ‘‘–indep-pairwise’’ in PLINK
(Pur-cell et al.
2007
). SNPs were pruned by linkage
disequi-librium (LD) of
r
2\
0.2 for a window size of 50 SNPs and
step size of 10 SNPs, yielding 689 ‘‘independent’’ SNPs.
The significance threshold using Bonferroni correction
corresponding to an alpha of 5 % was 7.3
9
10
-5.
In order to identify more strongly associated variants,
genotypes were imputed for SNPs at the locus for which
strongest evidence of association was observed, via a
two-stage procedure involving SHAPEIT (Howie et al.
2012
)
and IMPUTEv2 (Howie et al.
2009
), using the 1000
Gen-omes Project data as the reference panel (Abecasis et al.
2012
). Details of the imputation procedure are described
elsewhere (Michailidou et al.
2015
). Models assessing
associations with imputed SNPs were adjusted for 16 PCs
based on 1000 Genome imputed data to further improve
adjustment for population stratification. To determine
independent signals within imputed SNPs at
STAT3
, we ran
a stepwise forward multiple logistic regression model
including the most significant genotyped SNP rs1905339
and all imputed SNPs, adjusted for study, age and 16 PCs.
SNP association analyses and case-only analyses were
all conducted using SAS 9.3 (Cary, NC, USA). All tests
were two-sided.
For multiple associated SNPs located at the same gene, a
Microsoft Excel SNP tool created by Chen et al. (
2009
) and
the software HaploView 4.2 (Barrett et al.
2005
) were used to
examine LD structure between these SNPs. To be able to
inspect LD structures and also for gene-level analyses, allele
dosages of imputed SNPs had to be converted into the most
probable genotypes. Therefore, we categorized the imputed
allele dosage between [0, 0.5] as homozygote of the
refer-ence allele, the value between [0.5, 1.5] as heterozygote, and
the value between [1.5, 2.0] as homozygote of the counted
allele. The regional association plot was generated using the
online tool LocusZoom (Pruim et al.
2010
).
Gene-level and pathway association analyses
Gene-level associations were determined by a subset of
PCs, which were derived from a linear combination of
SNPs in each gene explaining 80 % of the variation in the
joint distribution of all relevant SNPs. Associations with
derived PCs were assessed within a logistic regression
framework (Biernacka et al.
2012
), for overall breast
can-cer, ER-positive and ER-negative diseases, respectively.
Pathway association of the immunosuppression pathway
was assessed based on a global test of association by
combining the gene-level
p
values via the Gamma method
(Biernacka et al.
2012
). For gene-level associations,
asso-ciations with
p
value
\
3.8
9
10
-4(Bonferroni correction)
were considered statistically significant. To gain empirical
p
values for gene-level associations of
TGFBR2
and
CCND1
as well as for the pathway association, a Monte
Carlo procedure was used with up to 1,000,000
random-izations (Biernacka et al.
2012
). An exact binomial test
based on the results of the single SNPs association analyses
was carried out to estimate enrichment of association in the
immunosuppression pathway. Gene-level and pathway
association analyses were carried out in R (version 3.1.1)
using the package ‘GSAgm’ version 1.0.
Haplotype analyses
To follow up the interesting gene associations observed,
haplotype analyses were performed to identify potential
susceptibility variants. Haplotype frequencies were
deter-mined with the use of the estimation maximization (EM)
algorithm (Long et al.
1995
) implemented in PROC
HAPLOTYPE in SAS 9.3 (Cary, NC, USA). Haplotypes
with frequency more or equal than 1 % were examined and
the most common haplotype was used as the reference.
Rare haplotypes with frequency less than 1 % were
grouped into one category. Haplotype-specific odds ratios
69 Department of Medical Epidemiology and Biostatistics,
Karolinska Institutet, Stockholm, Sweden
70 Sheffield Cancer Research Centre, Department of Oncology,
University of Sheffield, Sheffield, UK
71 Academic Unit of Pathology, Department of Neuroscience,
University of Sheffield, Sheffield, UK
72 Institute of Human Genetics, Pontificia Universidad
Javeriana, Bogota, Colombia
73 Department of Genetics and Pathology, Pomeranian Medical
University, Szczecin, Poland
74 Roswell Park Cancer Institute, Buffalo, NY, USA
75 Division of Genetics and Epidemiology, Institute of Cancer
Research, London, UK
76 Division of Breast Cancer Research, Institute of Cancer
Research, London, UK
77 University Cancer Center Hamburg (UCCH), University
(ORs) and 95 % confidence intervals (CIs) were estimated
within a multiple logistic regression framework, adjusted
for the same covariates as in the single SNP association
analyses. Global
p
values for association of haplotypes
with breast cancer risk were computed using a likelihood
ratio test comparing models with and without haplotypes of
the gene of interest.
Gene expression analyses
In order to examine whether potential causative genes
influence RNA expression in breast tumor tissue, we
downloaded RNA sequence level 3 data from The Cancer
Genome
Atlas
(TCGA)
(
2015
).
We
retrieved
the
RNA expression level as the form of RNA-Seq by
expec-tation–maximization
(RSEM)
based
on
the
Illumi-naHiSeq_RNASeqV2 array. Gene expression differences in
RNA levels between 989 invasive breast cancer tissues and
113 matched normal tissues for four genes of interest
(
STAT3
,
PTRF
,
IL5
, and
GM
-
CSF
) were analyzed using a
two-sided Wilcoxon–Mann–Whiney test. In addition, data
from 183 breast tissues in the GTEx (V6) (
2015
) publically
available online databases were evaluated to obtain
infor-mation on whether the most interesting variants (rs1905339,
rs8074296, rs146170568, chr17:40607850:I and rs77942990)
were expression quantitative trait loci (eQTL) for any gene.
Also, GTEx was queried to obtain information on whether
the five variants were eQTL for
STAT3
or
PTRF
.
Functional annotation
To investigate potential regulatory functions of interesting
polymorphisms, we used the Encyclopedia of DNA
Ele-ments (ENCODE) database through the UCSC Genome
Browser as well as Haploreg v4 (Ward and Kellis
2012
).
Results
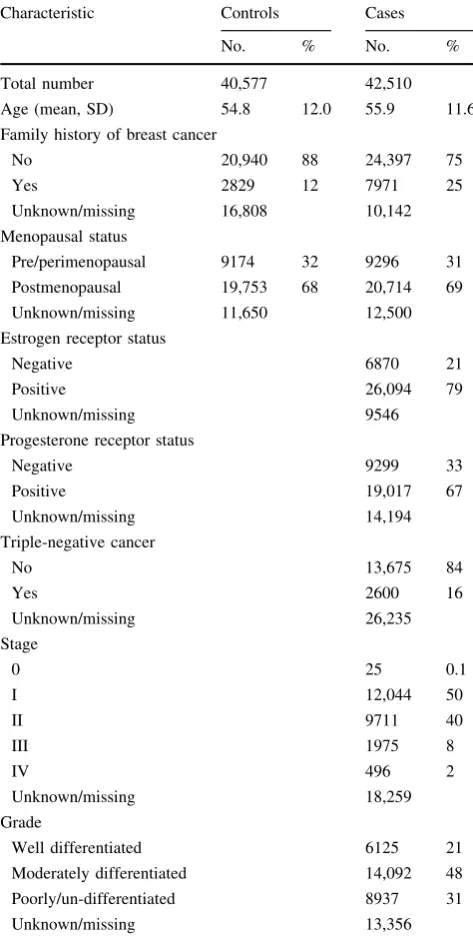
Selected characteristics of the study population are
described in Table
1
. The controls and breast cancer
patients included in this study had comparable mean
ref-erence ages of 54.8 and 55.9 years and also the proportion
of postmenopausal women was similar (68 % in controls
and 69 % in breast cancer patients). The proportion of
women indicating a family history of breast cancer in first
degree relatives was as expected greater in breast cancer
patients (25 %) than in controls (12 %).
Single SNP associations
Excluding the known
TGFBR2
and
CCND1
breast cancer
susceptibility loci, the quantile–quantile (QQ) plot for
associations with overall breast cancer risk for the
geno-typed SNPs of the other candidate genes indicated deviation
from expected
p
values and thus evidence of further SNPs
associated with breast cancer risk (Online Resource 3).
Genetic associations with overall breast cancer risk for all
assessed 3595 SNPs are summarized in Online Resource 4.
Four independent genotyped SNPs (LD
r
2\
0.3) were
significantly associated with breast cancer risk at
p
value
[image:6.595.306.543.74.545.2]\
7.3
9
10
-5, accounting for the multiple comparisons
(Table
2
). The four significant SNPs were located in or
near
TGFBR2
,
STAT3
and
CCND1
. Since
TGFBR2
and
Table 1 Characteristics of breast cancer cases and controls
Characteristic Controls Cases
No. % No. %
Total number 40,577 42,510
Age (mean, SD) 54.8 12.0 55.9 11.6
Family history of breast cancer
No 20,940 88 24,397 75
Yes 2829 12 7971 25
Unknown/missing 16,808 10,142
Menopausal status
Pre/perimenopausal 9174 32 9296 31
Postmenopausal 19,753 68 20,714 69
Unknown/missing 11,650 12,500
Estrogen receptor status
Negative 6870 21
Positive 26,094 79
Unknown/missing 9546
Progesterone receptor status
Negative 9299 33
Positive 19,017 67
Unknown/missing 14,194
Triple-negative cancer
No 13,675 84
Yes 2600 16
Unknown/missing 26,235
Stage
0 25 0.1
I 12,044 50
II 9711 40
III 1975 8
IV 496 2
Unknown/missing 18,259
Grade
Well differentiated 6125 21
Moderately differentiated 14,092 48
Poorly/un-differentiated 8937 31
Unknown/missing 13,356
CCND1
have been identified as breast cancer susceptibility
loci in previous studies (French et al.
2013
; Michailidou
et al.
2013
; Rhie et al.
2013
), we focused on the association
of the SNP at
STAT3
. The variant rs1905339 (A
[
G) at
STAT3
was positively associated with overall breast cancer
risk (per allele odds ratio (OR) 1.05, 95 % confidence
interval (CI) 1.03–1.08,
p
value
=
1.4
9
10
-6). It showed
similar associations with ER-positive and ER-negative
cancers (Online Resource 5). We did not observe further
SNPs that were significantly associated with ER-positive or
ER-negative disease (data not shown).
To identify additional susceptibility variants at
STAT3
,
we further investigated 707 SNPs that were well-imputed
(imputation accuracy
r
2[
0.3) and with MAF
[
0.01
spanning a
±
50 kb window around
STAT3
. Seven
inde-pendent signals at
STAT3
were found through the stepwise
forward
selection
procedure.
The
genotyped
SNP
rs1905339 was not selected. The imputed SNP rs8074296
(A
[
G), which was in high LD with rs1905339 (
r
2=
0.99),
showed a comparable OR for the association with overall
[image:7.595.54.544.83.156.2]breast cancer risk with a more extreme
p
value (per allele
OR 1.05, 95 % CI 1.03–1.08,
p
value
=
8.6
9
10
-7,
Table
3
). A second imputed SNP rs146170568 (C
[
T),
associated with a per allele OR of 1.32 (95 % CI
1.16–1.50,
p
value
=
2.1
9
10
-5), was still strongly
associated at a
p
value of 3.2
9
10
-4after accounting for
rs8074296 (Table
3
). None of the independently associated
imputed SNPs besides rs8074296 were correlated with
rs1905339 or with each other (
r
2B
0.01, Fig.
1
). As
rs8074296 and rs1905339 are located closer to
PTRF
than
to
STAT3
, we additionally analyzed data of 178 imputed
variants located within
±
50 kb of
PTRF
. Associations of
most additional variants in the
PTRF
region with breast
cancer risk were attenuated in analyses conditioning on
rs8074296 (Table
4
). The variants chr17:40607850:I and
rs77942990 still showed a strong association with breast
cancer risk (per allele OR 1.09, 95 % CI 1.04–1.15,
p
value
=
0.0005; and per allele OR 1.09, 95 % CI
1.04–1.15,
p
value
=
0.0007, respectively). These two
variants were also not in LD with rs8074296 (
r
2=
0.09
Table 2 TGFBR2, CCND1and STAT3 SNPs associated with overall breast cancer risk in women of European ancestry after Bonferroni correction (pvalue\7.3910-5)
SNP Chr. Positiona Gene Minor allele MAF cases MAF controls Cases Controls OR (95 %CI)b pvalue rs1431131 3 30,675,880 TGFBR2 A 0.37 0.36 42,508 40,574 1.06 (1.04–1.08) 2.6910-8 rs11924422 3 30,677,484 TGFBR2 C 0.40 0.41 42,491 40,572 0.95 (0.94–0.97) 6.9910-6 rs7177 11 69,466,115 CCND1 C 0.46 0.47 42,411 40,496 0.96 (0.94–0.98) 2.7910-5
rs1905339 17 40,582,296 STAT3 G 0.34 0.33 42,504 40,576 1.05 (1.03–1.08) 1.4910-6
SNPsingle nucleotide polymorphism,Chr. chromosome,MAFminor allele frequency,ORodds ratio,CIconfidence interval,TGFBR2 trans-forming growth factor beta receptor II,CCND1cyclin D1,STAT3signal transducer and activator of transcription 3
a Build 37
[image:7.595.50.544.240.369.2]b OR per minor allele, adjusted for age, study and nine European principal components
Table 3 Associations with overall breast cancer risk for seven independent imputed SNPs atSTAT3in women of European ancestry
SNP Chr. Positiona Counted allele
AFb Cases Controls Single SNP analysis Conditional analysisd OR (95 % CI)c pvalue OR (95 %CI)c pvalue rs8074296 17 40,583,421 G 0.336 42,510 40,577 1.05 (1.03–1.08) 8.6910-7 1.05 (1.03–1.07) 2.3910-5 rs146170568 17 40,517,716 T 0.005 42,510 40,577 1.32 (1.16–1.50) 2.1910-5 1.27 (1.11–1.44) 3.2910-4 rs141732716 17 40,469,832 A 0.005 42,510 40,577 1.38 (1.14–1.68) 0.001 1.33 (1.09–1.62) 0.004
rs138391971 17 40,505,106 G 0.003 42,510 40,577 0.60 (0.43–0.83) 0.002 0.61 (0.44–0.85) 0.003
rs12952342 17 40,553,640 G 0.119 42,510 40,577 1.07 (1.03–1.12) 0.002 1.07 (1.02–1.11) 0.005
rs190765034 17 40,428,622 G 0.026 42,510 40,577 1.14 (1.03–1.25) 0.010 1.17 (1.06–1.29) 0.002
rs190137766 17 40,422,371 T 0.002 42,510 40,577 0.68 (0.50–0.94) 0.018 0.66 (0.48–0.90) 0.009
SNPsingle nucleotide polymorphism, Chr. chromosome, ORodds ratio, CIconfidence interval, STAT3signal transducer and activator of transcription 3
a Build 37
b Allele frequency (AF) of counted allele
c OR per counted allele, adjusted for age, study and 16 European principal components
d Each SNP was tested adjusting for rs8074296, age, study and 16 European principal components. Estimate for rs8074296 is based on model
and 0.07, respectively) while all other variants in Table
4
were at least in moderate LD with rs8074296 (
r
2C
0.46,
Online Resource 6). The LD plot (Online Resource 6) also
shows that chr17:40607850:I and rs77942990 are in high
LD (
r
2=
0.83). A regional association plot for the
geno-typed SNP rs1905339 and all 885 imputed SNPs
with-in
±
50 kb of
STAT3
and
PTRF
included in this analysis is
shown in Fig.
2
. Associations of SNPs shown in Table
3
as
well as associations of chr17:40607850:I and rs77942990
with breast cancer risk were not significantly
heteroge-neous between studies (all
p
values for heterogeneity
[
0.1); forest plots can be found in Online Resource 7 to
16.
Gene-level and pathway associations
Gene-level associations with risks of overall breast cancer,
ER-positive and ER-negative diseases, respectively, for the
133 candidate genes in the immunosuppression pathway
are summarized in Online Resource 17.
TGFBR2
and
CCND1
showed significant associations with overall breast
cancer risk (
p
value
\
10
-6and 3.0
9
10
-4, respectively).
In addition,
IL5
and
GM
-
CSF
may be further potential
susceptibility loci of breast cancer (
p
value
=
1.0
9
10
-3and 7.0
9
10
-3, respectively).
STAT3
showed a less
sig-nificant association with overall breast cancer risk
(
p
value
=
0.033). The immunosuppression pathway as a
whole yielded a significant association with overall breast
cancer risk (
p
value
\
10
-6). Similar gene-level and
path-way associations were found for ER-positive but not for
ER-negative breast cancer (Online Resource 17). We found
significant enrichment of association in the
immunosup-pression pathway based on the results of the single SNPs
association analyses (313 of 3595 tests significant at
a
=
0.05, exact binomial test
p
value
=
2.2
9
10
-16).
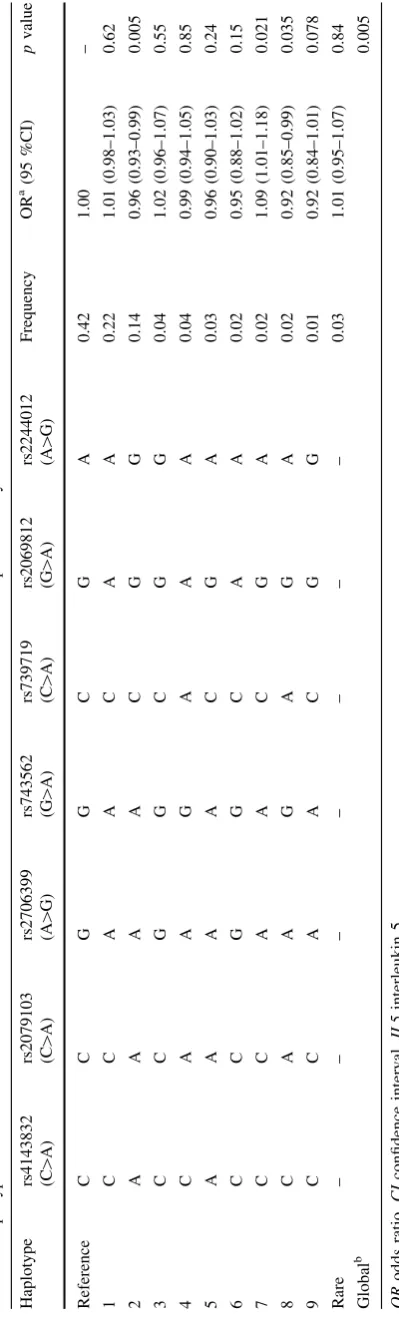
Haplotype analyses
Despite the evidence for a possible role of
IL5
and
GM
-CSF
in breast cancer susceptibility from the gene-level
analysis, no individual SNPs at
IL5
or
GM
-
CSF
yielded
significant genetic associations. To identify potential
sus-ceptibility haplotypes, haplotype-specific associations were
assessed based on seven SNPs in or near
IL5
(rs4143832,
rs2079103, rs2706399, rs743562, rs739719, rs2069812 and
rs2244012)
and
nine
SNPs
in
or
near
GM
-
CSF
(rs11575022,
rs2069616,
rs25881,
rs25882,
rs25883,
rs27349, rs27438, rs40401 and rs743564). The LD
struc-tures for these SNPs at
IL5
and
GM
-
CSF
are shown in
Online Resource 18 and 19, respectively. In our study
sample of women of European ancestry, 11 and 7 common
haplotypes with frequency
[
1 % were observed at
IL5
and
GM
-
CSF
, respectively. The haplotype AAAACGG in
IL5
was associated with a decreased overall breast cancer risk
(OR 0.96, 95 % CI 0.93–0.99,
p
value
=
5.0
9
10
-3,
Table
5
). In
GM
-
CSF
, the haplotype AAGAGCGAA was
Fig. 1 Linkage disequilibrium plot showingr2values and color schemes for the genotyped SNP rs1905339 and seven
independent imputed SNPs as well as imputed SNP
rs181888151 within±50 kb of
STAT3.The linkage
disequilibrium (LD) plot shows that SNP rs1905339 is in strong LD with the imputed SNP rs8074296 (r2=0.99), and
independent of the other six imputed SNPs (r2B0.01) at
[image:8.595.233.545.56.341.2]Table 4 Associations with overall breast cancer risk for 19 imputed variants nearPTRFin women of European ancestry
SNP Chr Positiona Counted allele
AFb Cases Controls Single SNP analysis Conditional analysisd ORc (95 % CI) pvalue ORc (95 % CI) pvalue rs8074296 17 40,583,421 G 0.336 42,510 40,577 1.05 (1.03–1.08) 8.6910-7 1.04 (1.02–1.06) 0.0006 rs1032070 17 40,618,251 T 0.269 42,510 40,577 1.06 (1.04–1.09) 1.5910-7 1.04 (1.00–1.09) 0.0359 rs34460267 17 40,615,865 C 0.269 42,510 40,577 1.06 (1.04.1.09) 1.9910-7 1.04 (1.00–1.09) 0.0424 rs34807589 17 40,624,656 T 0.264 42,510 40,577 1.06 (1.04–1.09) 2.0910-7 1.04 (1.00–1.09) 0.0423
rs36005199 17 40,597,555 G 0.268 42,510 40,577 1.06 (1.04–1.09) 2.1910-7 1.04 (1.00–1.09) 0.0490 rs12603201 17 40,595,927 T 0.581 42,510 40,577 0.95 (0.93–0.97) 3.1910-7 0.97 (0.93–1.00) 0.0662 chr17:40607850:I 17 40,607,850 CT 0.055 42,510 40,577 1.13 (1.07–1.18) 7.0910-7 1.09 (1.04–1.15) 0.0005 rs4796662 17 40,594,882 C 0.576 42,510 40,577 0.95 (0.93–0.97) 1.8910-6 0.98 (0.94–1.01) 0.2217 rs34349578 17 40,598,129 A 0.195 42,510 40,577 1.07 (1.04–1.10) 2.1910-6 1.04 (1.00–1.08) 0.0809 rs62075801 17 40,593,921 T 0.576 42,510 40,577 0.95 (0.93–0.97) 2.1910-6 0.98 (0.94–1.01) 0.2385 rs12951640 17 40,594,298 A 0.253 42,510 40,577 1.06 (1.03–1.08) 2.1910-6 1.03 (0.98–1.07) 0.2269
rs77942990 17 40,622,538 A 0.046 42,510 40,577 1.13 (1.07–1.19) 2.2910-6 1.09 (1.04–1.15) 0.0007
rs35111218 17 40,595,572 T 0.252 42,510 40,577 1.06 (1.03–1.08) 2.3910-6 1.03 (0.98–1.07) 0.2311
rs6503704 17 40,592,253 A 0.253 42,510 40,577 1.06 (1.03–1.08) 2.3910-6 1.03 (0.98–1.07) 0.2413 rs12943498 17 40,593,901 C 0.253 42,510 40,577 1.06 (1.03–1.08) 2.5910-6 1.02 (0.98–1.07) 0.2529 rs12951549 17 40,593,502 T 0.253 42,510 40,577 1.06 (1.03–1.08) 2.6910-6 1.02 (0.98–1.07) 0.2537 chr17:40593802:I 17 40,593,802 GTTTC 0.251 42,510 40,577 1.06 (1.03–1.08) 3.5910-6 1.02 (0.98–1.07) 0.2943 rs6503703 17 40,592,207 T 0.261 42,510 40,577 1.06 (1.03–1.08) 6.5910-6 1.02 (0.98–1.06) 0.3775 chr17:40595896:D 17 40,595,896 C 0.211 42,510 40,577 1.06 (1.03–1.09) 9.0910-6 1.02 (0.98–1.07) 0.2373
SNPsingle nucleotide polymorphism, Chr. chromosome, ORodds ratio, CIconfidence interval, STAT3signal transducer and activator of transcription 3
a Build 37
b Allele frequency (AF) of counted allele
c OR per counted allele, adjusted for age, study and 16 European principal components
d Each SNP was tested adjusting for rs8074296, age, study and 16 European principal components. Estimate for rs8074296 was based on model
including chr17:40607850:I
Fig. 2 Regional association plot for the genotyped SNP rs1905339 and 885 imputed SNPs within±50 kb ofSTAT3
andPTRF.Eachdotrepresents an SNP. Thecolor of each dot
reflects the extent of linkage disequilibrium (r2) with SNP rs1032070 (inpurple diamond). Genomic positions of SNPs were plotted based on hg19/ 1000 Genomes Mar 2012 European. Association is represented at the-log10 scale.
[image:9.595.192.544.463.712.2]also associated with a decreased overall breast cancer risk
(
OR 0.92, 95 % CI 0.87–0.96,
p
value
=
2.7
9
10
-4,
Table
6
). The global
p
value for haplotype association was
significant for both
IL5
(
p
value
=
0.005) and
GM
-
CSF
(
p
value
=
0.007).
Gene expression analyses
Using TCGA RNA sequencing level 3 data, we found that
RNA expression levels of
STAT3
and
IL5
were
signifi-cantly higher in 113 normal tissue samples compared to
989 breast tumor samples (
p
value
=
1.3
9
10
-3and
7.0
9
10
-4, respectively, Online Resources 20 and 21),
while overall expression of
IL5
was low in both tissues.
Also expression levels of
PTRF
were significantly higher
in normal tissue compared to tumor tissue samples
(
p
value
B
0.0001, Online Resource 22).
GM
-
CSF
expres-sion was very low and did not differ between breast tumor
samples and normal tissue samples (
p
value
=
0.49,
Online Resource 23). Among 183 mammary tissues in the
GTEx
database,
SNPs
rs1905339,
rs8074296
and
rs77942990 were not significantly correlated with
STAT3
(
p
values
=
0.36, 0.36, and 0.2, respectively; Online
Resource 24 to 26) or
PTRF
expression (
p
values
=
0.4,
0.4, and 0.39 Online Resource 27 to 29). The SNPs
rs1905339 and rs8074296 were significant eQTL for
TUBG2
(both
p
values
=
9.9
9
10
-7, Online Resource 30
and 31). The
STAT3/PTRF
variants rs146170568 and
chr17:40607850:I were not available in the GTEx
database.
Discussion
Our comprehensive examination of associations between
polymorphisms in the immunosuppression pathway genes
and breast cancer risk revealed that
STAT3
,
IL5,
and
GM
-CSF
may play a role in overall breast cancer susceptibility
among women of European ancestry.
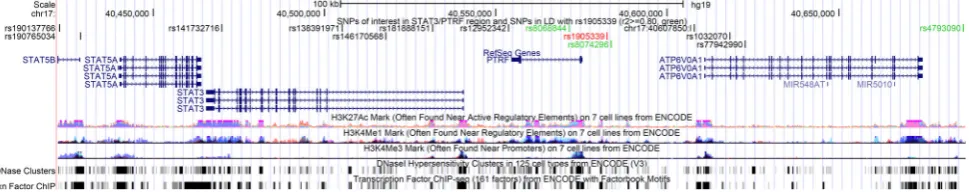
The in silico functional analysis revealed that within a
±
50 kb window of
STAT3
, several polymorphisms are
located in regulatory regions that could actively affect
DNA transcription (Fig.
3
). The SNP rs181888151, which
is in complete LD with rs146170568 (
r
2=
1) but
inde-pendent of rs1905339 (
r
2=
0.01, Fig.
1
) was significantly
associated with increased risk for overall breast cancer
(per allele OR 1.31, 95 % CI 1.16–1.49,
p
value
=
2.8
9
10
-5). Together with a further independently
asso-ciated imputed SNP rs141732716, these polymorphisms
reside in strong DNase I hypersensitivity and transcription
regulatory sites (Fig.
3
). This suggests that they may be
functional polymorphisms, but further experimental work
is required for confirmation.
Table 5 Haplotype associations with overall breast cancer risk for seven SNPs at IL5 in women of European ancestry Haplotype
rs4143832 (C[
A)
rs2079103 (C[
A)
rs2706399 (A[
G)
rs743562 (G[
A)
rs739719 (C[
A)
rs2069812 (G[
A)
rs2244012 (A[
[image:10.595.59.259.58.719.2]STAT3
encodes the signal transducer and activator of
transcription 3, which is a member of the STAT protein
family. Activated by corresponding cytokines or growth
factors, STAT3 can be phosphorylated and translocate into
the cell nucleus, acting as a transcription activator. In
addition, STAT3 plays a key role in regulating immune
response in the tumor microenvironment (Yu et al.
2009
).
STAT3 signaling is required for immunosuppressive and
tumor-promoting functions of MDSCs (Cheng et al.
2003
,
2008
; Kortylewski et al.
2005
,
2009
; Kujawski et al.
2008
;
Ostrand-Rosenberg and Sinha
2009
; Yu et al.
2009
), as
well as for Treg cell expansion (Kortylewski et al.
2005
,
2009
; Matsumura et al.
2007
).
STAT3
has been reported in
several previous genome-wide association studies (GWAS)
to be associated with immune relevant diseases such as
Crohn’s disease (Barrett et al.
2008
; Franke et al.
2008
;
Yamazaki et al.
2013
), inflammatory bowel disease
(Jos-tins et al.
2012
), and multiple sclerosis (Jakkula et al.
2010
;
Patsopoulos et al.
2011
; Sawcer et al.
2011
). Additionally,
expression of
STAT3
was suggested to be enriched in
tri-ple-negative breast cancer, and negatively associated with
lymph node involvement and breast tumor stage in a study
based on an in silico network approach (Liu et al.
2012b
).
However, the association of rs1905339 with triple-negative
breast cancer risk in our study (N triple-negative breast
cancer
=
2600) was similar and not stronger compared to
the association observed for overall breast cancer risk (per
allele OR 1.06, 95 % CI 0.99–1.14,
p
value
=
0.11).
The genotyped SNP rs1905339 is also located at 7 kb 5
0of
PTRF,
which encodes the polymerase I and transcript
release factor, and is not known to be directly involved in
immunosuppression. In addition, two independently
associ-ated imputed SNPs rs8074296 and rs12952342 (
r
2=
0.99
and 0 with rs1905339, respectively, Fig.
1
) are located at
8 kb 5
0and 0.8 kb 3
0of
PTRF
, respectively (Fig.
3
). PTRF is
known to contribute to the formation of caveolae, small
membrane caves involved in cell signaling, lipid regulation,
and endocytosis (Chadda and Mayor
2008
). Recently,
down-regulation of
PTRF
was observed in breast cancer cell lines
and breast tumor tissue, suggesting that PTRF expression
might be an indicator for breast cancer progression (Bai et al.
2012
). The SNPs rs1905339 and rs8074296 were also found
to be eQTL for
TUBG2
(tubulin, gamma 2) in the GTEx
database, the expression of
TUBG2
decreased with each
variant allele (Online Resources 30 and 31, respectively).
TUBG2
encodes
c
-tubulin, a protein required for the
for-mation and polar orientation of microtubules in cells. It is
currently unknown, whether
TUBG2
plays a role in breast
cancer development or progression.
The other two potential susceptibility loci,
IL5
and
GM
-CSF,
are both located in a known cytokine gene cluster at
5q31.
IL5
encodes interleukin 5, a cytokine secreted by
CD4
?
T helper 2 cells (Mills
2004
; Parker
1993
). IL5 is a
Table 6 Haplotype associations with overall breast cancer risk for nine SNPs at GM -CSF in women of European ancestry Haplotype
rs11575022 (A[
C)
rs2069616 (A[
G)
rs25881 (G[
A)
rs25882 (A[
G)
rs25883 (G[
A)
rs27349 (C[
A)
rs27438 (G[
A)
rs40401 (G[
A)
rs743564 (A[
growth and differentiation factor for both B cells and
eosinophils, triggering eosinophil- and B cell-dependent
immune response (Mills
2004
; Parker
1993
).
GM
-
CSF
encodes granulocyte–macrophage colony stimulating
fac-tor, a cytokine that controls differentiation and function of
granulocytes and macrophages. GM-CSF is also a
MDSC-inducing and activating factor in the bone marrow
(Os-trand-Rosenberg and Sinha
2009
; Serafini et al.
2004
). In
the tumor microenvironment, GM-CSF is the cytokine for
dendritic cell differentiation and function, and it is often
found to be underexpressed (Zou
2005
). Additionally, 5q31
has been found to be a susceptibility locus for rheumatoid
arthritis (Okada et al.
2012
,
2014
) and inflammatory bowel
disease (Jostins et al.
2012
).
Immunosuppression is a complex network with plenty
of contributors, including transcription factors (e.g.,
STAT3), as well as immune mediating cytokines (e.g., IL5
and GM-CSF). Results of this analysis indicate that genetic
variation in different components of the
immunosuppres-sion pathway may be susceptibility loci of breast cancer
among women of European ancestry.
The main strengths of the present analysis were its large
sample size, the uniform genotyping procedures and
cen-tralized quality controls used. The imputation of genotypes
in the most interesting susceptibility loci provided an
opportunity to identify more strongly associated variants.
Assessments of gene-level associations also provided
evi-dence for additional putative susceptibility loci. A
limita-tion was the lack of an independent sample to replicate the
observed associations; this will be feasible in the future
using new studies participating in the BCAC. Further
functional studies are still needed to identify causal variants
and to investigate the underlying biological mechanisms.
Conclusions
Overall, our data provide strong evidence that common
variation in the immunosuppression pathway is associated
with breast cancer susceptibility. The strongest candidates
for mediating this association were
STAT3
,
IL5,
and
GM
-CSF
, but we cannot exclude the possibility of multiple
alleles each with effects too small to confirm.
Acknowledgments We thank all the individuals who took part in these studies and all the researchers, clinicians, technicians, and administrative staff who have enabled this work to be carried out. This analysis would not have been possible without the contributions of the following: Per Hall(COGS); Douglas F. Easton, Paul Pharoah, Kyriaki Michailidou, Manjeet K. Bolla, Qin Wang(BCAC), Andrew Berchuck(OCAC), Rosalind A. Eeles, Douglas F. Easton, Ali Amin Al Olama, Zsofia Kote-Jarai, Sara Benlloch(PRACTICAL), Georgia Chenevix-Trench, Antonis Antoniou, Lesley McGuffog, Fergus Couch and Ken Offit (CIMBA), Joe Dennis, Alison M. Dunning, Andrew Lee, and Ed Dicks, Craig Luccarini and the staff of the Centre for Genetic Epidemiology Laboratory, Javier Benitez, Anna Gonzalez-Neira and the staff of the CNIO genotyping unit, Jacques Simard and Daniel C. Tessier, Francois Bacot, Daniel Vincent, Sylvie LaBoissie`re and Frederic Robidoux and the staff of the McGill University and Ge´nome Que´bec Innovation Centre, Stig E. Bojesen, Sune F. Nielsen, Borge G. Nordestgaard, and the staff of the Copenhagen DNA laboratory, and Julie M. Cunningham, Sharon A. Windebank, Christopher A. Hilker, Jeffrey Meyer and the staff of Mayo Clinic Genotyping Core Facility.ABCFSwould like to thank Maggie Angelakos, Judi Maskiell, and Gillian Dite.ABCSwould like to thank Sanquin Amsterdam, the Netherlands.BBCSthanks Eileen Williams, Elaine Ryder-Mills, and Kara Sargus.BIGGSthanks Niall McInerney, Gabrielle Colleran, Andrew Rowan, and Angela Jones.
BSUCH would like to thank Peter Bugert and Medical Faculty Mannheim.CGPSthanks Staff and participants of the Copenhagen General Population Study, as well as excellent technical assistance from Dorthe Uldall Andersen, Maria Birna Arnadottir, Anne Bank, and Dorthe Kjeldga˚rd Hansen. CNIO-BCS would like to thank Guillermo Pita, Charo Alonso, Daniel Herrero, Nuria A´ lvarez, Pilar Zamora, Primitiva Menendez, and the Human Genotyping-CEGEN Unit.CTSwould like to thank the CTS Steering Committee including Leslie Bernstein, Susan Neuhausen, James Lacey, Sophia Wang, Huiyan Ma, Yani Lu, and Jessica Clague DeHart at the Beckman Research Institute of City of Hope, Dennis Deapen, Rich Pinder, Eunjung Lee, and Fred Schumacher at the University of Southern California, Pam Horn-Ross, Peggy Reynolds, Christina Clarke Dur and David Nelson at the Cancer Prevention Institute of California, and Hoda Anton-Culver, Argyrios Ziogas, and Hannah Park at the University of California Irvine. ESTHER thanks Hartwig Ziegler, Christa Stegmaier, Sonja Wolf, and Volker Hermann. GC-HBOC
thanks Stefanie Engert, Heide Hellebrand, and Sandra Kro¨ber.
GENICAwould like to thank the GENICA Network, including Dr. Margarete Fischer-Bosch-Institute of Clinical Pharmacology, Stutt-gart, and University of Tu¨bingen, Germany (HB, Wing-Yee Lo,
Fig. 3 UCSC genome browser graphic for SNPs at theSTAT3/PTRF
region. The UCSC genome browser graphic shows functional annotations for the SNPs rs1905339 (red), correlated SNPs
(r2[0.80, green), as well as the other independent imputed SNPs
[image:12.595.58.543.60.156.2]Christina Justenhoven), German Cancer Consortium (DKTK) and Deutsches Krebsforschungszentrum (DKFZ) (HB), Department of Internal Medicine, Evangelische Kliniken Bonn gGmbH, Johanniter Krankenhaus, Bonn, Germany (Yon-Dschun Ko, Christian Baisch), Institute of Pathology, University of Bonn, Germany (Hans-Peter Fischer), Molecular Genetics of Breast Cancer, DKFZ, Heidelberg, Germany (UH), Institute for Prevention and Occupational Medicine of the German Social Accident Insurance, Institute of the Ruhr University Bochum (IPA), Bochum, Germany (Thomas Bru¨ning, Beate Pesch, Sylvia Rabstein, Anne Lotz), and Institute of Occupa-tional Medicine and Maritime Medicine, University Medical Center Hamburg-Eppendorf, Germany (Volker Harth).HEBCSwould like to thank Kirsimari Aaltonen, Karl von Smitten, Sofia Khan, Tuomas Heikkinen, and Irja Erkkila¨. HMBCS would like to thank Peter Hillemanns, Hans Christiansen, and Johann H. Karstens. KBCP
thanks Eija Myo¨ha¨nen and Helena Kemila¨inen.LMBCthanks Gilian Peuteman, Dominiek Smeets, Thomas Van Brussel, and Kathleen Corthouts.MARIEwould like to thank Petra Seibold, Judith Heinz, Nadia Obi, Alina Vrieling, Muhabbet Celik, Til Olchers, and Stefan Nickels.MBCSGthanks Siranoush Manoukian, Bernard Peissel and Daniela Zaffaroni at the Fondazione IRCCS Istituto Nazionale dei Tumori (INT), Monica Barile and Irene Feroce at the Istituto Europeo di Oncologia (IEO), and the personnel of the Cogentech Cancer Genetic Test Laboratory.MTLGEBCSwould like to thank Martine Tranchant at the CHU de Que´bec Research Center, Marie-France Valois, Annie Turgeon and Lea Heguy at the McGill University Health Center, Royal Victoria Hospital, McGill University for DNA extraction, sample management and skillful technical assistance, and J.S. who is the Chairholder of the Canada Research Chair in Onco-genetics.NBCSwould like to thank Dr. Kristine Kleivi, PhD (K.G. Jebsen Centre for Breast Cancer Research, Institute of Clinical Medicine, University of Oslo, Oslo, Norway and Department of Research, Vestre Viken, Drammen, Norway), Dr. Lars Ottestad, MD (Department of Genetics, Institute for Cancer Research, Oslo University Hospital Radiumhospitalet, Oslo, Norway), Prof. Em. Rolf Ka˚resen, MD (Department of Oncology, Oslo University Hospital and Faculty of Medicine, University of Oslo, Oslo, Norway), Dr. Anita Langerød, PhD (Department of Genetics, Institute for Cancer Research, Oslo University Hospital Radiumhospitalet, Oslo, Norway), Dr. Ellen Schlichting, MD (Department for Breast and Endocrine Surgery, Oslo University Hospital Ullevaal, Oslo, Norway), Dr. Marit Muri Holmen, MD (Department of Radiology and Nuclear Medicine, Oslo University Hospital, Oslo, Norway), Prof. Toril Sauer, MD (Department of Pathology at Akershus University hospital, Løren-skog, Norway), Dr. Vilde Haakensen, MD (Department of Genetics, Institute for Cancer Research, Oslo University Hospital Radiumhos-pitalet, Oslo, Norway), Dr. Olav Engebra˚ten, MD (Institute for Clinical Medicine, Faculty of Medicine, University of Oslo and Department of Oncology, Oslo University Hospital, Oslo, Norway), Prof. Bjørn Naume, MD (Division of Cancer Medicine and Radio-therapy, Department of Oncology, Oslo University Hospital Radi-umhospitalet, Oslo, Norway), Dr. Cecile E. Kiserud, MD (National Advisory Unit on Late Effects after Cancer Treatment, Department of Oncology, Oslo University Hospital, Oslo, Norway and Department of Oncology, Oslo University Hospital, Oslo, Norway), Dr. Kristin V. Reinertsen, MD (National Advisory Unit on Late Effects after Cancer Treatment, Department of Oncology, Oslo University Hospital, Oslo, Norway and Department of Oncology, Oslo University Hospital, Oslo, Norway), Assoc. Prof. A˚ slaug Helland, MD (Department of Genetics, Institute for Cancer Research and Department of Oncology, Oslo University Hospital Radiumhospitalet, Oslo, Norway), Dr. Margit Riis, MD (Dept of Breast- and Endocrine Surgery, Oslo University Hospital, Ulleva˚l, Oslo, Norway), Dr. Ida Bukholm, MD (Department of Breast-Endocrine Surgery, Akershus University Hospital, Oslo, Norway and Department of Oncology, Division of Cancer Medicine, Surgery and Transplantation, Oslo University
Hospital, Oslo, Norway), Prof. Per Eystein Lønning, MD (Section of Oncology, Institute of Medicine, University of Bergen and Depart-ment of Oncology, Haukeland University Hospital, Bergen, Norway), Dr Silje Nord, PhD (Department of Genetics, Institute for Cancer Research, Oslo University Hospital Radiumhospitalet, Oslo, Norway) and Grethe I. Grenaker Alnæs, M.Sc. (Department of Genetics, Institute for Cancer Research, Oslo University Hospital Radiumhos-pitalet, Oslo, Norway).NBHSwould like to thank study participants and research staff for their contributions and commitment to this study. OBCS thanks Meeri Otsukka and Kari Mononen. OFBCR
thanks Teresa Selander and Nayana Weerasooriya. PBCS thanks Louise Brinton, Mark Sherman, Neonila Szeszenia-Dabrowska, Beata Peplonska, Witold Zatonski, Pei Chao, and Michael Stagner.
SASBACwould like to thank the Swedish Medical Research Coun-sel.SBCSwould like to thank Sue Higham, Helen Cramp, Ian Brock, Sabapathy Balasubramanian, and Dan Connley.SEARCHthanks the SEARCH and EPIC teams. SKKDKFZS thanks all study partici-pants, clinicians, family doctors, researchers and technicians for their contributions and commitment to this study.TNBCCthanks Robert Pilarski and Charles Shapiro who were instrumental in the formation of the OSU Breast Cancer Tissue Bank, and also thanks the Human Genetics Sample Bank for processing of samples and providing OSU Columbus area control samples.UKBGSwould like to thank Breast Cancer Now and the Institute of Cancer Research for support and funding of the Breakthrough Generations Study, and the study par-ticipants, study staff, and the doctors, nurses and other health care providers and health information sources who have contributed to the study, and acknowledge the NHS funding to the Royal Marsden/ICR NIHR Biomedical Research Centre.kConFab/AOCSwish to thank Heather Thorne, Eveline Niedermayr, all the kConFab research nurses and staff, the heads and staff of the Family Cancer Clinics, and the Clinical Follow Up Study (which has received funding from the NHMRC, the National Breast Cancer Foundation, Cancer Australia, and the National Institute of Health (USA)) for their contributions to this resource, and many families who contribute to kConFab.
pKARMA would like to thank the Swedish Medical Research Counsel.
Compliance with ethical standards
Conflict of interest The authors declare that they have no com-peting interests.
BioMolecular resources Research Infrastructure—Netherlands (BBMRI-NL), which is a Research Infrastructure financed by the Dutch government (NWO 184.021.007). The work of the BBCC was partly funded by ELAN-Fond of the University Hospital of Erlangen. The BBCS study was funded by Cancer Research UK and Break-through Breast Cancer and acknowledges National Health Service (NHS) funding to the National Institute for Health Research (NIHR) Biomedical Research Centre, and the National Cancer Research Network (NCRN). The BIGGS study was supported by NIHR Comprehensive Biomedical Research Centre, Guy’s & St. Thomas’ NHS Foundation Trust in partnership with King’s College London, United Kingdom. IT was supported by the Oxford Biomedical Research Centre. The BSUCH study was supported by the Dietmar-Hopp Foundation, the Helmholtz Society and the Deutsches Krebs-forschungszentrum (DKFZ). The CECILE study was funded by Fondation de France, Institut National du Cancer (INCa), Ligue Nationale contre le Cancer, Ligue contre le Cancer Grand Ouest, Agence Nationale de Se´curite´ Sanitaire (ANSES), Agence Nationale de la Recherche (ANR). The CGPS study was supported by the Chief Physician Johan Boserup and Lise Boserup Fund, the Danish Medical Research Council and Herlev Hospital. The CNIO-BCS study was supported by the Instituto de Salud Carlos III, the Red Tema´tica de Investigacio´n Cooperativa en Ca´ncer and grants from the Asociacio´n Espan˜ola Contra el Ca´ncer and the Fondo de Investigacio´n Sanitario (PI11/00923 and PI12/00070). The CTS study was initially supported by the California Breast Cancer Act of 1993 and the California Breast Cancer Research Fund (contract 97-10500) and is currently funded through the NIH (R01 CA77398). Collection of cancer incidence data (GLOBOCAN2012) was supported by the California Department of Public Health as part of the statewide cancer reporting program mandated by California Health and Safety Code Sect. 103885. HAC received support from the Lon V Smith Foundation (LVS39420). The ESTHER study was supported by a grant from the Baden Wu¨rttem-berg Ministry of Science, Research and Arts. Additional cases were recruited in the context of the VERDI study, which was supported by a grant from the German Cancer Aid (Deutsche Krebshilfe). The GC-HBOC study was supported by the German Cancer Aid (grant no 110837, coordinator: Rita K. Schmutzler). The GENICA study was funded by the Federal Ministry of Education and Research (BMBF) Germany grants 01KW9975/5, 01KW9976/8, 01KW9977/0 and 01KW0114, the Robert Bosch Foundation, Stuttgart, DKFZ, Heidel-berg, the Institute for Prevention and Occupational Medicine of the German Social Accident Insurance, Institute of the Ruhr University Bochum (IPA), Bochum, as well as the Department of Internal Medicine, Evangelische Kliniken Bonn gGmbH, Johanniter Krankenhaus, Bonn, Germany. The HEBCS study was financially supported by the Helsinki University Central Hospital Research Fund, Academy of Finland (266528), the Finnish Cancer Society, the Nordic Cancer Union and the Sigrid Juselius Foundation. The HMBCS study was supported by a grant from the Friends of Hannover Medical School and by the Rudolf Bartling Foundation. The KBCP study was financially supported by the special Government Funding (EVO) of Kuopio University Hospital grants, Cancer Fund of North Savo, the Finnish Cancer Organizations, and by the strategic funding of the University of Eastern Finland. The LMBC study was supported by the ‘Stichting tegen Kanker’ (232-2008 and 196-2010). The MARIE study was supported by the Deutsche Krebshilfe e.V. (70-2892-BR I, 106332, 108253, 108419), the Hamburg Cancer Society, DKFZ and the Federal Ministry of Education and Research (BMBF) Germany (01KH0402). The MBCSG study was supported by grants from the Italian Association for Cancer Research (AIRC) and by funds from the Italian citizens who allocated the 5/1000 share of their tax pay-ment in support of the Fondazione IRCCS Istituto Nazionale Tumori, according to Italian laws (INT-Institutional strategic projects ‘‘59100000). The MCBCS study was supported by the NIH grants
CA128978, CA116167, CA176785 and NIH Specialized Program of