Auditory Representations of Speech
Sounds in a Neural Model: the Role
of Peripheral Processing
R.I. Damper,
Image, Speech and Intelligent Systems (ISIS) Research Group,
Department of Electronics and Computer Science,
University of Southampton,
Southampton SO17 1BJ, UK.
(email:
[email protected])
Abstract—
The categorization of speech sounds by the auditory system has been a subject of intense attention over several decades, reflecting its importance to the scientific study of speech perception and the technological develop-ment of more human-like capabilities in automatic speech recognition. In previous work, we have firmly established that a two-stage computational model can mimic important aspects of the speech categorization behav-ior of human and animal listeners. The first stage employs a biologically-motivated ‘front-end’, modeling the peripheral auditory system, and the second stage is a trainable artificial neural network ‘back-end’, modeling more central processes. When suitably trained on synthetic stimuli, the two-stage system is able to reproduce the important effects of category for-mation for the class of initial plosive-stop speech sounds, and movement of the category boundary with place of articulation. Appropriate behavior is maintained across a variety of ‘back-end’ architectures and associated learning algorithms. The behavior is emergent in that it was not explicitly programmed into the model. These facts imply that there is something very basic about categorization behavior.
Unlike real (human and animal) listeners, a software model can be in-terrogated to find out the contribution of its component parts to the overall behavior. Replacing the auditory front-end by a more prosaic fast Fourier transform analyzer allows us to focus on the contribution of the acoustic-to-auditory transformation to categorization. We find that the front-end processor is not essential to category formation but plays an important part in the boundary-movement phenomenon, by emphasizing important time-frequency regions of the speech signal.
I. INTRODUCTION
Speech sound pressure waves impinging on the ear are sub-jected to a series of mechanical and then neural transforma-tions resulting in the ultimate percept of a linguistic message. Hence, understanding speech perception is virtually synony-mous with understanding the staged transformations which re-late the physically-continuous acoustic stimulation the discrete code of phonetic percepts. In particular, in some as yet un-known way, the continuous-to-discrete transformation effects a variance reduction such that a variety of physical realizations map to the same speech-sound category, with obvious impor-tance for effective communication between individuals with dif-ferent speech production apparatus. Understanding how this is achieved is the celebrated ‘speech invariance problem’. It is clear that the way speech sounds are categorized by a listener’s auditory system is a matter of considerable scientific interest. In the words of Summerfield [1], however:
“. . . the relationship between acoustical structure and perceived phonetic structure is complex and not obviously explained by known properties of the mammalian auditory system.”
while Kuhl and Miller [2] write:
“Ideally, [one would like] experimental methods that somehow allow one to intervene at various stages of the processing of sound to observe the restructuring of information that has oc-curred at each stage.”
While this intervention is difficult or impossible to achieve in experiments using human or animal listeners, it is immeasur-ably easier “to observe the restructuring of information” in a software model of auditory processing. For this reason, we have worked for several years on such models, with a view to understanding the possible acoustic and auditory bases of the categorical perception (CP) of voicing in syllable initial stop consonants [3], [4], [5], [6].
In previous work, we have focused on simulated represen-tations of synthetic speech sounds at the level of the auditory nerve. Thus, the restructuring of information implicit in the acoustic input by the peripheral auditory system has been an in-tegral part of the model. This work has revealed very clearly that any reasonably general learning system is able to cate-gorize the patterns of simulated auditory nerve activation in a way which mimics the psychophysical behavior of real listen-ers. The question which then arises, and which we address here, is: how important is the restructuring of information by the pe-ripheral auditory system to the obtained categorization?
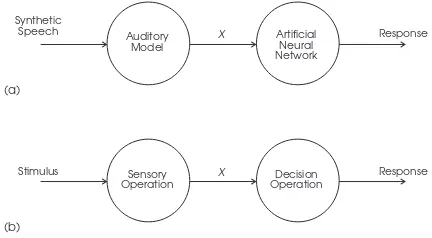
Fig. 1. (a) Two-stage model of the auditory system consisting of a biologically-faithful simulation of the peripheral auditory system and an artificial neural network trained on the auditory nerve firing patterns denoted X. This pro-cessing scheme can be usefully related to the framework of signal detection theory (b) which clearly separates sensory and decision operations.
conclusions.
II. APPROACH TONEURALMODELING
Artificial neural network (ANN) modeling in the ‘parallel distributed processing’ style [7] and the biologically-faithful modeling of real neural systems [8], [9] are typically seen as orthogonal approaches to the simulation of intelligent behavior. The former abstracts away putatively irrelevant complexities of cell electrophysiology and interconnection, allowing systems of practically large size to be studied, but at the expense of aban-doning biological fidelity. The latter retains fidelity but com-putational complexity dictates that only relatively small neu-ral systems (of known structure and function) can be consid-ered [10].
We employ both modeling approaches, treating them as com-plementary. Exploiting detailed anatomical and physiological knowledge of the peripheral auditory system, the first stage of the simulation is a biologically-faithful model of the trans-duction of sound from the pinna to the mammalian auditory nerve [11]. The second stage is a trainable ANN which mod-els essentially unknown details of central auditory system func-tion at a high level of abstracfunc-tion. (See Shamma [12] for ear-lier, similarly-motivated work in this area.) Figure 1(a) shows a schematic representation of this processing scheme and re-lates it to a traditional signal-detection theoretic viewpoint [13] in which a sensory process produces a (unidimensional) vari-ate X which is the basis for subsequent decisions (Figure 1(b)). Signal detection theory is important and relevant here [14], [15], because its clear separation of sensory and decision operations focuses attention on the locus of categorization. That is, does it take place at the sensory stage (so that X is discrete) or at the decision stage (so that X is continuous)?
Here, X is the (continuous) firing pattern of auditory nerve activity computed in response to the synthetic speech stimuli developed by Abramson and Lisker [16] – their so-called voice onset time (VOT) continuum. The ANN is trained on these pat-terns (‘neurograms’) and, hence, acts as a ‘synthetic listener’. The perception of the Abramson and Lisker VOT stimuli by human and animal listeners has been much studied and, as re-viewed immediately below, a good deal is known about this. Accordingly, we are able to verify that the two-stage model acts essentially indistinguishably from a real listener. In this work,
formly, and discrimination is far better between categories than within a category. Hence, labeling functions are non-uniform and discrimination functions are non-monotonic. An intriguing finding is that such categorical behavior is also observed in non-human listeners – a result which has usually been taken to indi-cate that indi-categorization is basic to the operation of animal audi-tory systems rather than relying on the existence of a ‘phonetic’ sub-system specialized for speech perception.
In now-classical work, Kuhl and Miller [2] obtained labeling curves for English speakers and for chinchillas in response to bilabial (/ ba-pa /), alveolar (/ da-ta /) and velar (/ ga-ka /) stim-uli in which VOT was varied. These revealed labeling func-tions in which there was a sharp transition from a high num-ber of ‘voiced’ judgements to a low numnum-ber as VOT increased. The functions were well fitted by a probit (sigmoid). Taking the 50% points as the boundaries between voiced and unvoiced cat-egories, there was a phoneme boundary-shift effect with place of articulation such that the boundary moves from about 25 ms through 35 ms to 42 ms as the place of constriction in the vocal tract moved back from bilabial through alveolar to velar. Also, the chinchillas exhibit boundary values not significantly differ-ent from the humans (although the curves are less steep).
In previous work, we have employed ANNs as synthetic lis-teners. A variety of neural models has been studied: brain-state-in-a-box associative networks [15]; competitive-learning net-works[5]; multilayer perceptrons (MLPs) [3], [15] and single-layer perceptrons (SLPs) [5]. In all cases reported here, the ANNs were perceptrons trained by back-propagation [17]. In this earlier work, networks were trained on a neurogram rep-resentation of the Abramson and Lisker stimuli.
Neurograms were computed as follows. Stimuli were ap-plied to the auditory model at time t=0 at a simulated level of 65 dB SPL. The times of firing (‘spikes’) of each of the simulated auditory-nerve fibers were noted. There are 128 of these and, because of the tonotopic organization of the auditory system, each can be associated with a particular ‘center’ fre-quency (CF). Activity before t=0 is spontaneous, as is that in channels with CF index 1..8 (for reasons to do with the band-width of our auditory filters at low frequency). Fuller details are given in [3], [11]. (Thanks to the detailed modeling of phenom-ena such as middle-ear transmission, basilar membrane dynam-ics, mechanical-to-neural transduction, neural tuning and tono-topic organization, rate saturation, two-tone suppression etc., it is possible to demonstrate that our computed responses agree very well in all details with the physiological recordings (in cat) of auditory nerve responses to synthetic / ba / and / da / syl-lables (0 ms VOT) by Miller and Sachs [18], as redrawn by Shamma [19].) Spikes were then counted in a.12×16/
[image:2.595.61.277.56.175.2]ms
1 128
?25 +95
C
F
in
d
[image:3.595.338.534.96.327.2]ex
Fig. 2. Typical ‘reduced’ neurogram in the.12×16/matrix form presented to the neural networks: / ba / stimulus, 40 ms VOT. There is very signif-icant data-reduction relative to a representation which retains the CF and time identity of each spike.
the time dimension and from 1 to 128 in steps of 8 in the CF di-mension. Figure 2 shows a typical such ‘reduced’ neurogram in response to the / ba / stimulus with 40 ms VOT. We refer to this as ‘reduced’ because there is clearly very considerable data re-duction relative to a representation which retains the individual CF and time identity of each and every spike. Some such re-duction is, of course, necessary if the parameters (connection weights and thresholds) of the ANNs are to be reliably esti-mated from limited training data. The reader should nonethe-less bear in mind that all fine timing information has effectively been eradicated from the inputs to the ANNs.
Separate networks were constructed for each of the three stimulus series (bilabial, alveolar and velar). Each had 192 (12×16) input units, a variable number (h) of hidden units, and a single output unit (with sigmoidal activation function) to act as a voiced/unvoiced detector.
[image:3.595.99.249.112.314.2]As in the Kuhl and Miller study with chinchillas (which had to be trained to respond appropriately to the stimuli), the MLPs were trained on 50 repetitions of the endpoint stimuli (0 and 80 ms VOT) and tested on 50 repetitions of the full range of values (0 ms to 80 ms in 10 ms steps), so that generalization was tested on the intermediate (10 ms to 70 ms) stimuli. Be-cause the auditory model is probabilistic in nature (as a re-sult of its simulation of mechanical-to-neural transduction in the cochlea), stimulus repetition produced non-identical neu-rograms. This is convenient, because it allows us to gener-ate sufficient training data for our purposes. Target outputs were 1 for the voiced (0 ms VOT) stimuli and 0 for the unvoiced (80 ms VOT) stimuli. Training used a learning rate of 0.01, a
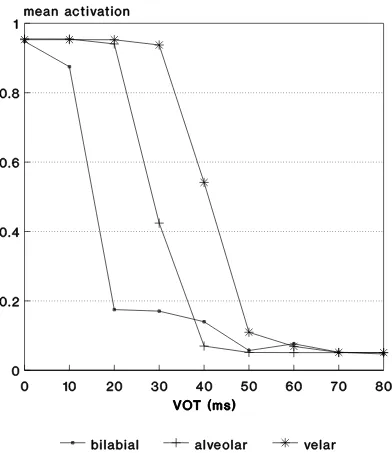
Fig. 3. Mean output activation versus VOT for MLPs with 2 hidden units trained on neurograms from 0 ms and 80 ms endpoints. The boundary place-ment as a function of place of articulation mimics that seen in ‘real’ (human and animal) listeners.
momentum of 0.7, and a range of±0:02 for the initial, random
weights; and was terminated when the average squared error per training pattern was 0.0025.
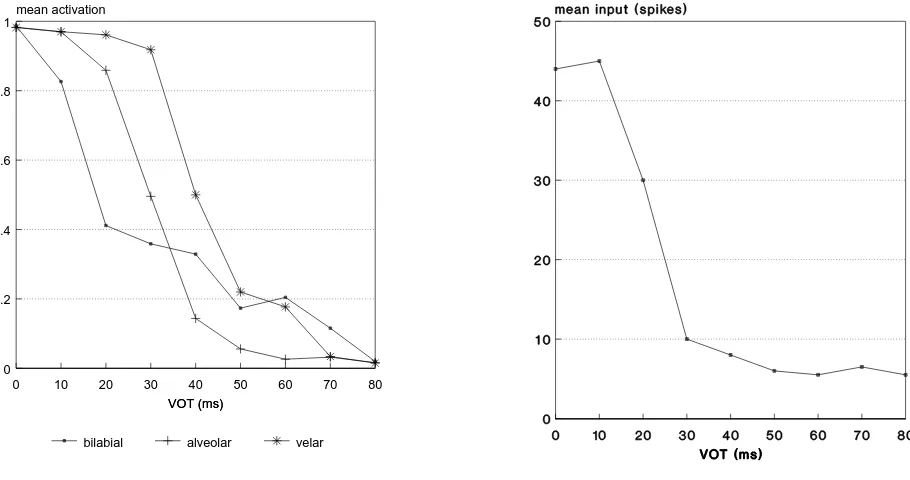
Figure 3 shows typical labeling functions obtained by averag-ing output activations over the 50 stimulus presentations. In this case, there were h=2 hidden units, but results were insensitive to the value of h. This is illustrated by Figure 4 in which essen-tially the same curves are obtained with single-layer perceptrons (SLPs) having no hidden units whatsoever (h=0). The form of these labeling functions was insensitive to the initial random weight settings for the back-propagation training. That is, la-beling functions like these – with the correct order of bound-ary shift – were consistently obtained over several repetitions of the training.
Figures 3 and 4 closely mimic the labeling functions obtained from human and animal listeners, even to the extent of repli-cating the shift of category boundary with place of articulation seen in the original studies. Thus, the neural model is clearly capturing the ‘essence’ of categorical perception. The behavior is emergent – it is not explicitly programmed into the simulation – which strengthens the feeling that the effects are quite basic to the way these stimuli are perceived. It is surely suggestive that very similar results are obtained from obviously very different human, animal and machine listeners.
IV. ANALYZING THEMODEL
deter-0 0.2 0.4 0.6
bilabial alveolar velar
0 10 20 30 40 50 60 70 80
[image:4.595.326.528.92.332.2]VOT (ms) VOT (ms)
Fig. 4. Mean output activation versus VOT for single-layer perceptrons trained on neurograms from 0 ms and 80 ms endpoints.
mine the basis of its behavior. In this regard, the finding that no hidden units are necessary in order to simulate CP is very important. A major attraction of the single-layer perceptron ar-chitecture is that it is straightforward to identify the areas of the neurogram which contribute to the observed categorization be-havior. That is, all connections are direct from the neurogram to the SLP output node, without the complication of intervening hidden units.
A simplified contribution analysis [20] was conducted by identifying the connections associated with the highest absolute product of input and weight, averaged across all 50 presenta-tions of the endpoint patterns and all VOTs. Basing the analysis on this product, rather than just the weight values, was found to produce more meaningful results. The analysis considered positive and negative weight values separately. (Note that the input values are spike counts and are always positive.) High-est products of input and positive weight are located around the low-frequency region (the four frequency channels covering CF indices 8 to 48 in the model, corresponding to 73 to 675 Hz) just after acoustic stimulus onset where voicing activity varies maximally as VOT varies. (This is perhaps not surprising as this the region of the perceptually important first formant ( F1) tran-sition.) The precise location of this region shifts in the three nets (bilabial, alveolar, velar) in the same way as the boundary point. Averaging the inputs to the 5 SLP nodes with the largest positive product across all 50 stimuli at each value of VOT pro-duces the pattern in Figure 5 (depicted for the alveolar series). This curve is noticeably similar in shape to the curve for the un-modified net, with its characteristic steep labeling function. In this case, however, there is no thresholding or compression by
Fig. 5. Mean spike-count input for the 5 SLP nodes with maximal product of input and positive weight versus VOT for the alveolar series.
a sigmoidal activation function as there is in the neural model, so indicating that categorization behavior is not merely a trivial consequence of specific details of the ANN architecture. Simi-lar findings obtain for the bilabial and veSimi-lar series.
A similar plot focusing on the large absolute negative weights does not reproduce this pattern of variation with VOT: it is es-sentially flat. We conjecture that the role of the negative weights is simply to provide an ‘offset’, reducing the labeling function to 0 as necessary in spite of all the inputs (spike counts) being positive. These negatively-weighted lines can connect to any re-gion of the neurogram where there is significant activity which remains more or less constant as VOT changes. Generally, this is the region of high CF and the period some time after stimulus onset.
The implication of these results is that categorization can be explained in terms of a mechanism by which higher levels of the auditory system focus on a particular region of auditory nerve time-frequency activity and, in essence, count spikes in this re-gion. But how important is restructuring of information by the peripheral auditory system to this mechanism?
V. TRAINING ON ANACOUSTICREPRESENTATION
[image:4.595.77.532.97.337.2]stimu-Fig. 6. Output activation versus VOT for single-layer perceptrons trained on FFT-processed 0 ms and 80 ms endpoint stimuli. The boundary shift with place of articulation is abolished.
lus. Thus, we have very little data on which to train the ANNs. We return to this matter below.
Since the waveform representations of the stimuli are, be-cause of their high redundancy, inherently unsuitable for input to the neural network, they were pre-processed by fast-Fourier transform (FFT). That is, the power spectral densities of the stimuli were computed using a 256-point fast Fourier transform over 25.6 ms frames (the sampling rate was 10 kHz) centered on the 10 ms cell widths previously employed. (The overlap be-tween consecutive frames was (25:6−10/=2=7:8 ms.)
Spec-tral energy was again summed in a.12×16/analysis window
stretching from−25 ms to 95 ms in 10 ms steps in the time di-mension but from 0 to 5 kHz in steps of 312.5 Hz in the fre-quency dimension, to form the input to the nets. So, in this case, the frequency dimension is divided up linearly (in Hz) rather than approximately logarithmically according to CF.
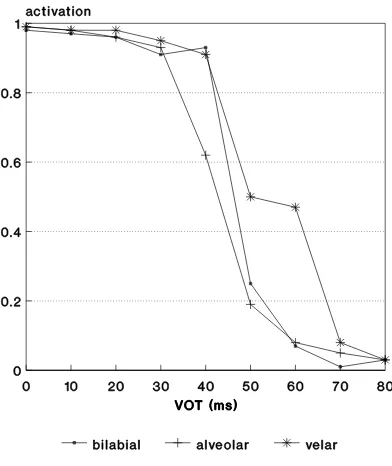
Figure 6 shows a typical result for an SLP trained on the FFT-processed endpoints. As can be seen, the sharp labeling func-tion is retained, but the boundary shift is abolished. It seems, therefore, that the auditory front-end – mimicking sensory pro-cessing – is essential to the proper simulation of CP. There are, however, some important differences between the ways that the labeling functions of Figure 6 were produced relative to those depicted earlier: namely the paucity of training data in the present case, and the different frequency scalings.
[image:5.595.338.534.95.325.2]As there is only one training instance for each endpoint and each place of articulation, it is likely that the networks trained on FFT-processed data are in fact under-trained. Further, it may be important that the network sees some appropriate statistical
Fig. 7. Output activation versus VOT for single-layer perceptrons trained on averaged neurograms for 0 ms and 80 ms endpoint stimuli. In spite of the probable under-training, the boundary shift with place of articulation is re-stored.
distribution of the data during training. To test the importance of such factors to correct boundary shift, new sets of training data were constructed, consisting of single, averaged instances of the endpoint neurograms. Figure 7 shows a typical result: as can be clearly seen, in spite of the probable under-training, the correct boundary shift with place of articulation is restored. The indication is that there is indeed an important role for “restruc-turing of information” by the peripheral auditory system.
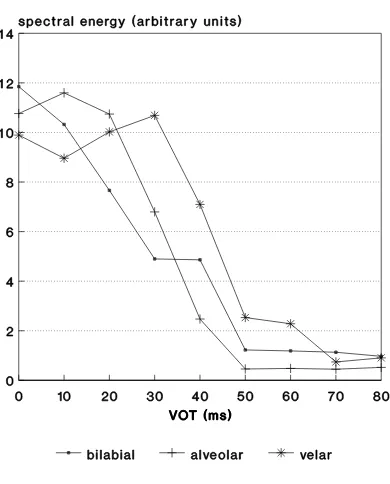
This, however, is contrary to the conclusion of [6]. In this latter work, the spectral energy in the acoustic signal (FFT-processed) was evaluated for the same putatively-important time-frequency region as used in the spike-counting model. Fig-ure 8 shows the result, which is a very fair approximation to the ‘correct’ labeling functions, with appropriate boundary shift, except that the category boundaries are too long by about 10 ms. This is a consequence of using the simulated neural responses to place the analysis region without regard for the propagation delay through the peripheral auditory system. Although this delay is actually a function of frequency, it does not deviate too much from about 10 ms for the frequencies of interest here. Taking proper account of the propagation delay results in ap-proximately correct boundaries.
VI. DISCUSSION ANDCONCLUSIONS
[image:5.595.72.268.96.329.2]time-Fig. 8. Spectral energy in the acoustic stimuli evaluated over a time-frequency range corresponding to that for the spike-counting model (Figure 5).
frequency regions in order to make discriminations between the categories of speech sounds studied here. Processing by the pe-riphery renders these regions more prominent in the auditory nerve representation. Thus, neural networks trained on an au-ditory representation are able to make the necessary discrimi-nations. On the other hand, networks trained on the acoustic data have difficulty because the important information, although present, is insufficiently prominent.
In conclusion, important aspects of the voiced/unvoiced cat-egorization of synthetic syllable-initial stop consonants are re-produced by a two-stage simulation of the auditory system. This behavior is emergent – it is not explicitly programmed into the model – and no fine timing information is necessary. Un-like real (human and animal) listeners, the computational model can be systematically manipulated to determine the basis of its behavior. This reveals information in the region of first formant ( F1) onset is vital to the perception of voicing for these stim-uli. The peripheral auditory system plays an important part in emphasizing this region in the neural representation.
VII. ACKNOWLEDGEMENTS
The VOT stimuli used here were produced at Haskins Labo-ratories, New Haven, Connecticut, with assistance from NICHD Contract NO1-HD-5-2910. Thanks to Doug Whalen for his time and patience.
Thanks also to my student Mat Gore for programming and data-analysis effort.
REFERENCES
[1] A.Q. Summerfield, “Differences between spectral dependencies in
audi-[5] R.I. Damper, S. Harnad and M.O. Gore, “A computational model of the perception of voicing in initial stop consonants,” J. Acoust. Soc. Am., sub-mitted.
[6] R.I. Damper, “A biocybernetic simulation of speech perception by hu-mans and animals,” Proc. IEEE Int. Conf. Systems, Man & Cybernetics
(SMC ’97), Vol. 2, Orlando, FL, 1997, pp. 620–625.
[7] D.E. Rumelhart and J.L. McClelland (editors), Parallel Distributed
Pro-cessing: Explorations in the Microstructure of Cognition (2 Vols.),
Cam-bridge, MA: Bradford Books/MIT Press, 1986.
[8] R.J. MacGregor, Neural and Brain Modeling, London, UK: Academic, 1987.
[9] C. Koch and I. Segev (editors), Methods in Neuronal Modeling: From
Synapses to Networks, Cambridge, MA: MIT Press, 1989.
[10] T.W. Scutt and R.I. Damper, “Computational modelling of learning and behaviour in small neuronal systems,” Proc. Int. Joint Conf. Neural
Net-works, Singapore, 1991, pp. 430–435.
[11] M.J. Pont and R.I. Damper, “A computational model of afferent neural ac-tivity from the cochlea to the dorsal acoustic stria,” J. Acoust. Soc. Am., Vol. 89, 1991, pp. 1213–1228.
[12] S.A. Shamma, “Speech processing in the auditory system. II: Lateral inhi-bition and the central processing of speech invoked activity in the auditory nerve,” J. Acoust. Soc. Am., Vol. 78, 1985, pp. 1622–1632.
[13] D.M. Green and J.A. Swets, Signal Detection Theory and Psychophysics, New York: Wiley, 1966.
[14] N.A. Macmillan, H.L. Kaplan and C.D. Creelman, “The psychophysics of categorical perception,” Psych. Rev., Vol. 84, 1977, pp. 452–471. [15] R.I. Damper and S. Harnad, “The psychophysics of synthetic categorical
perception,” Percept. Psychophys., submitted.
[16] A. Abramson and L. Lisker, “Discrimination along the voicing continuum: Cross-language tests,” Proc. 6th Int. Cong. Phonetic Sciences, Prague,
1967, Academia, Prague: 1970, pp. 569–573.
[17] D.E. Rumelhart, G.E. Hinton and R.J. Williams, “Learning representa-tions by back-propagating errors,” Nature, Vol. 323, 1986, pp. 533–536. [18] M.I. Miller and M.B. Sachs, “Representation of stop consonants in the
discharge pattern of auditory-nerve fibers,” J. Acoust. Soc. Am., Vol. 74, 1983, pp. 502–507.
[19] S.A. Shamma, “Speech processing in the auditory system. I: The rep-resentation of speech sounds in the responses of the auditory nerve,” J.
Acoust. Soc. Am., Vol. 78, 1985, pp. 1612–1621.
[image:6.595.74.269.91.333.2]