Abstract— Several researchers have highlighted the fact that
the leading-edge tubercles on the humpback whale flippers enhances its maneuverability. Encouraging results obtained due to implementation of the leading-edge tubercles on wings as well as wind and tidal turbine blades and the fact that a limited research has been conducted related to the implementation of leading-edge tubercles onto the aeronautic propeller blades was the motivation for the present study. A propeller that spins efficiently through air would directly result in environmental friendly flights. Small sized aeronautic propeller; an 8x3.8 propeller, was considered for the present study. As a part of this study, numerical simulations were carried out to explore the effect of leading-edge tubercle geometry on propeller efficiency. The tubercle geometry was varied systematically by changing the tubercle amplitude and wavelength. The propeller performance was analyzed at a wide range of flight speeds and rotational velocities. The results predict an increase in efficiency of the propellers with leading-edge tubercles in comparison with the baseline propeller i.e. the propeller without leading-edge tubercles, while operating at various rotational velocities and flight speeds. A change in the flow-field was observed around the propellers with tubercles at the leading-edge of the propeller blades. It was noted that the addition of the leading-edge tubercles to the propeller geometry delayed flow separation, reduced span-wise flow and the size and strength of the propeller blade tip vortices, leading to a reduced torque requirement from the power source. This lead to an increase in the efficiency of the propellers with leading-edge tubercles. Amongst the various configurations of the tubercle amplitude and wavelength considered for the present study, it was found that the configurations with relatively larger tubercle amplitude and smaller tubercle wavelength, i.e. large tubercle amplitude-to-wavelength ratio, were more efficient. As the advance ratio increased, the increase in efficiency of the propellers with leading-edge tubercles also improved in comparison with the baseline propeller. An increased thrust-to-torque ratio of the modified propeller will have a positive impact on the aircraft’s maximum rate of climb, time to climb, absolute and service ceilings, range and endurance leading to greener and cost-effective flights.
Manuscript received March 03, 2018; revised March 03, 2018. Fahad Rafi Butt, master’s candidate, is with the College of Electrical and Mechanical Engineering, National University of Sciences and Technology, Islamabad, Punjab 46000 Pakistan (phone: 92-300-2631665; e-mail: [email protected]).
Dr. Tariq Talha, Assistant Professor, is with the College of Electrical and Mechanical Engineering, National University of Sciences and Technology, Islamabad, Punjab 46000 Pakistan (phone: 92-332-6183900; e-mail: [email protected]).
Index Terms—amplitude, counter-rotating chord-wise
vortex, flow separation, span-wise flow, tubercle, wavelength
I. INTRODUCTION
N this study effect of leading-edge tubercle geometry on propeller efficiency over wide range of flight speeds and rotational velocities was analyzed. Tubercles are round bumps that change the aerodynamics of a lift producing body, such as aeronautic wings [1]-[11], wind and tidal turbine blades [12]-[13] and marine propellers [14] by delaying flow separation. The tubercles also act as a wing fence reducing both the span-wise flow and wing tip vortices [1], [4], [7], [12].
These vortices are distinctive from the vortices generated by the conventional vortex generators because they rotate around the axis that is perpendicular to that of the oncoming flow and are observed to be in the plane parallel to the surface of the lifting surface. The strength of these vortices increases with an increase in the angle of attack and the tubercle amplitude and a decrease in the tubercle wavelength [2], [7]-[10], [12]. Few relevant studies conducted on aeronautic wings, marine propellers, wind and tidal turbine blades are discussed in the following paragraphs.
A numerical analysis was performed over a wing section using a panel method code by [1]. It was observed that the
A Parametric Study of the Effect of the
Leading-Edge Tubercles Geometry on the Performance
of Aeronautic Propeller using Computational
Fluid Dynamics (CFD)
Fahad Rafi Butt, and Tariq Talha
[image:1.595.340.546.428.609.2]I
addition of the tubercles to leading edge of the wing geometry not only increased the lift coefficient but also reduced the drag coefficient. At lower angles of attack, the modified wing, the wing with the leading edge tubercles, had no penalty in terms of lift-to-drag ratio. It was also observed that the leading-edge tubercles reduced wing tip vorticity.
Optimization for the tubercle amplitude and wavelength at various angles of attack were conducted by [2], both numerically and experimentally on an aeronautic wing. The optimum configuration in terms of superior aerodynamic performance was found to be the one with the smaller tubercle wavelength and a larger tubercle amplitude. It was also found that the modified wing stalled gradually as compared to the baseline wing as reported by [4], [7]. A greater effect on the lift-to-drag ratio of the modified wing was observed for a change in the tubercle amplitude as compared to the change in the tubercle wavelength.
Low Reynolds number flow over a scalloped flipper with leading-edge tubercles was investigated numerically by [4]. The study confirmed the existence of the chord-wise vortices behind the tubercle troughs as reported by [1]. It was found that the vortices created by the addition of leading-edge tubercles to the flipper reduced the span-wise flow and the presence of counter rotating chord-wise vortices increased the boundary layer momentum leading to delayed stall in the flipper with leading-edge tubercles.
Wind tunnel experiments on humpback whale flipper models by [7] resulted in an increase in the lift-to-drag ratio of the modified flipper in comparison with the baseline flipper for a wide range of angles of attack. Analogous to the vortex generators over a lifting surface, the tubercles were also found increase the stall angle of attack.
Reference [9] performed an experimental investigation on two distinct NACA airfoils with different aerodynamic characteristics. The study concluded that the tubercles act in a manner similar to conventional vortex generators and the influence of tubercles on the efficiency of a lifting surface depends not only on the tubercle geometry, controlled by the tubercle amplitude and wavelength, but also on the airfoil cross section employed. The results demonstrated a similarity in the flow patterns when similar amplitude-to-wavelength ratio of the tubercles was employed. No significant difference of results was found for the laminar and turbulent flow. The performance with larger amplitude tubercles was found to be more favorable in post stall regimes and reducing the tubercle wavelength was reported to improve the maximum lift coefficient, stall angle and post-stall characteristics, up to a certain wavelength.
An aerodynamic model was put forward by [10] to explain the increase in stall angle in the lifting surfaces with the leading-edge tubercles. The aerodynamic model predicted delayed stall which matches with the wind tunnel experiments [7]. The aerodynamic model also predicts that the stall occurs behind the troughs before it occurs behind the tubercle crests and the absolute low pressure exists behind the tubercle troughs which is also confirmed by experiments and numerical simulations [1]-[2],[4]-[8].
Tidal turbine blades were analyzed both numerically and experimentally at various angles of attack by [12]. The tubercle geometry i.e. tubercle height and wavelength, was
optimized numerically. The tubercle with largest amplitude and smaller wavelengths was the most efficient in terms of lift-to-drag ratio. The configuration with the leading-edge tubercles applied to one-quarter of the blade span was the most efficient, as noted by the wind tunnel experiments. A significant increase in the lift-to-drag ratio of the blade having leading-edge tubercles was reported for all configurations studied. Moreover, the strong tip vortex caused by the well-known end effect was also found to be dramatically reduced by the application of the tubercles, as was also reported by [1].
Reference [13] numerically investigated flow over a NREL Phase VI wind turbine with the leading-edge tubercles for various configurations of tubercle amplitudes and wavelengths. An increased shaft torque was found for all the cases at higher wind speeds. It was also concluded that transient effects were minimal.
Reference [14] performed steady-state simulations on a marine propeller with leading-edge tubercles. The tubercle wavelength and amplitude were kept at a 25% and 2.5% of the mean blade chord length for the modified blade. There results indicated a small increase in the thrust co-efficient. The propeller efficiency increased only at higher advance ratios.
II. NUMERICAL METHODOLOGY
A. Geometric Models and Simulation Methodology
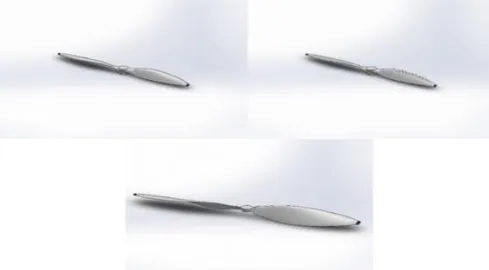
An 8x3.8 propeller was modelled and modified1 using the SolidWorks CAD package and examined as part of the present study, as shown in Fig. 2. The access to the geometrical and experimental data [16] necessary for the verification and validation of the numerical methodology justified the use of a fixed pitch propeller in the present study instead of a variable pitch propeller. The baseline propeller geometries used by [16] were employed. All of the numerical simulations were performed to predict the three-dimensional steady–state flow over aeronautic propellers using commercially available code SolidWorks Flow Simulation Premium© [SFS]. The Local rotating region(s) (Averaging) feature within SFS was employed to simulate the propeller’s rotation in the standard atmospheric conditions. The employment of the commercial code was merited because the commercial code was able to satisfy all the necessary boundary conditions. SolidWorks Flow Simulation Premium© is a [6], [18] CFD tool built-in to the SolidWorks© CAD package. SFS employs κ-ε turbulence model with damping functions as the turbulence model, SIMPLE-R as the numerical algorithm. The spatial discretization scheme for the convective fluxes is the second order upwind and for the diffusive terms is the central approximation, respectively. Time derivatives are approximated using an implicit first-order Euler scheme. The Flow Simulation© solves the Navier-Stokes equations which are formulations of mass momentum and energy conservation laws for fluid flows, mentioned below (1)-(3).
1 Any mention of modified propeller or a wing refers to a modified wing
To predict turbulent flows, the Favre-averaged Navier-Stokes equations are used. Flow Simulation© considers the real model created within SolidWorks© and generates a Cartesian computational mesh in the computational domain distinguishing the fluid and solid domains. The resulting mesh, employs the immersed boundary method, has three types of cells, namely Fluid cells; the cells located entirely in the fluid, Solid cells; the cells located entirely in the solid and Partial cells are the cells which are partly in the solid and partly in the fluid [19].
0 ) ( x u i i t
(1)
S x x x u u u i j R ij ij i j j i i p t ) ( ) ( )
( i1,2,3
(2) Q u S x u x q u x u H i i j i R ij i i R ij ij j i i t p H t
H
) ( ) ( ( ) ) ( 2 2 u h H
(3)
where,
S
i is a mass-distributed external force per unit
mass due to a porous media resistance
S
porousi , a buoyancy
g
S
igravity
i is the gravitational acceleration
component along the i-th coordinate direction) and the coordinate system’s rotation
S
rotationi , i.e.,
S
S
S
S
rotationi gravityi porous i
i . u is the fluid velocity.
The subscripts are used to denote summation over the three coordinate directions [19].
B. Comparison of Steady-State and Transient Flow
An unsteady simulation was carried out to explore any transient effects, using the modified propeller. The use of the modified propeller was justified by the fact that it would also account for any unsteadiness in the flow caused by the counter rotating chord-wise vortices present in the propellers with tubercles. The boundary conditions of 10,000 RPM rotational velocity and 0.7 advance ratio were employed. The results differed by less than 0.75%, as shown in Table I. Therefore, the flow was assumed to be steady-state. The steady-state flow assumption was also employed by various other researchers [12]-[14] in similar scenarios.
C. Mesh and Computational Domain Details
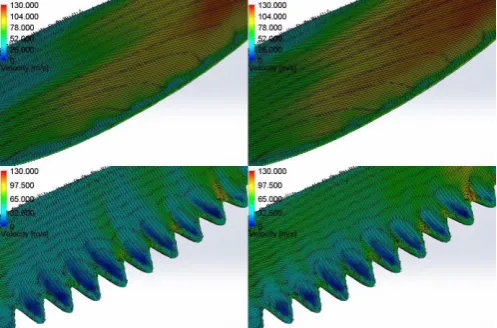
The 10x7 propeller without leading-edge tubercles was selected for the verification and validation of the CFD methodology because of the unavailability of experimental data that can be relied upon, for the propellers implementing the leading-edge tubercles. The boundary conditions employed were rotational velocities of 4,011 RPM, 5,003 RPM and 6,006 RPM at various advance ratios. The numerical simulation results were compared with the experimental results from [16]. An average of 4.8% and 5.0% difference was noted between experimental results and numerical simulations in the thrust and power coefficients with maximum deviation being 10.8% and 9.6%, respectively. It is clear from Fig. 3 that both the thrust and the power coefficients calculated numerically are in a close proximity with the experimental results [16].
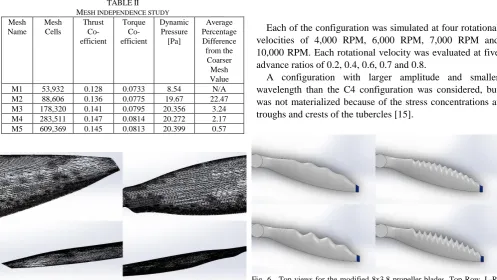
[image:3.595.300.549.378.497.2]Nx, Ny and Nz, represent the number of base cells in the respective coordinate directions, were 40, 47 and 35 respectively. These cells are further split into smaller cells in areas of interest, i.e. a very fine mesh was employed inside and near the rotating domain, to make the simulations converge [20]. The employed computational domain size of 1.75D x 1.75D x 2.25D was of large enough volume to accurately track the fluid flow around the propellers. The solver operated without any errors, reversed flow or unwanted vortex formation. The mesh settings employed for the mesh M4 were selected because the difference in critical parameters between the mesh M4 and M5 were on average 0.57%, as shown in Table II.
Fig. 2. Propeller Geometries. Top Row, L-R: Baseline, Modified, C4
configuration, propeller geometries. Bottom Row: 10x7 propeller geometry.
TABLEI
COMPARISON OF STEADY-STATE AND TRANSIENT SIMULATION Physical Quantity/
Simulation Type Transient
Steady-State
Percentage Difference Dynamic Pressure 340.341 340.133 0.061 Thrust 0.7393 0.7553 2.12 Torque 0.08632 0.08639 0.081
[image:3.595.47.292.403.538.2]D. Layout of Experiments
The studies conducted on aeronautic wings, tidal and wind turbine blades [2], [8]-[9], [12]-[13] concluded that the tubercle amplitude and wavelength have a significant effect on the efficiency of the wings and the tidal and wind turbines. In the present study, the effect of tubercle amplitude and wavelength on the propeller’s efficiency was investigated. Five configurations of the propeller were employed, as shown in Table III.
Each of the configuration was simulated at four rotational velocities of 4,000 RPM, 6,000 RPM, 7,000 RPM and 10,000 RPM. Each rotational velocity was evaluated at five advance ratios of 0.2, 0.4, 0.6, 0.7 and 0.8.
A configuration with larger amplitude and smaller wavelength than the C4 configuration was considered, but was not materialized because of the stress concentrations at troughs and crests of the tubercles [15].
III. RESULTS
The efficiency of a propeller is given by the relation (4). )
(
K
K
P T propJ
(4)K
TandK
P are calculated as following [17].D
n
K
T T2 4(5)
and
D
n
P
K
inQ 3 5
(6) where
K
T and
K
P are thrust and power coefficients. Tis the thrust,
P
in is the power required to turn the propeller,
J is the advance ratio calculated as
Dn
u
0 .u
0 is flightvelocity, D is propeller diameter and n is propeller rotational velocity. is the fluid density.
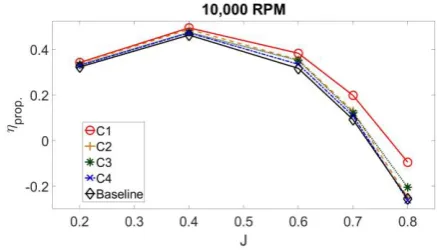
Fig. 7 shows a result from the numerical analysis. It is clear from the Fig. 7 that all the modified propeller configurations were more efficient than the baseline configuration at various flight conditions tested. Figures for lower rotational velocities not shown because of similar trends.
Fig. 4. Zoomed-in view of the mesh around the 10x7 propeller blade. Top Row, L-R; Trailing edge at the blade tip, trailing edge at the blade root. Bottom Row, L-R; Leading-edge at the blade tip, leading-edge at the blade root.
TABLEIII
Configuration Wavelength [mm] Amplitude [mm] Sweep Angle [°]
C1 16.78 1.82 13.61
C2 5.56 1.83 32.12
C3 16.78 3.64 22.81
C4 5.56 3.63 50.36
Baseline 0 0 0
Fig. 6. Top views for the modified 8x3.8 propeller blades. Top Row, L-R: C1 configuration, C2 configuration. Bottom Row, L-R: C3 Configuration, C4 configuration.
TABLEII MESH INDEPENDENCE STUDY Mesh
Name
Mesh Cells
Thrust Co-efficient
Torque Co-efficient
Dynamic Pressure [Pa]
Average Percentage Difference from the
Coarser Mesh Value M1 53,932 0.128 0.0733 8.54 N/A M2 88,606 0.136 0.0775 19.67 22.47 M3 178,320 0.141 0.0795 20.356 3.24 M4 283,511 0.147 0.0814 20.272 2.17 M5 609,369 0.145 0.0813 20.399 0.57
[image:4.595.48.546.66.346.2] [image:4.595.310.546.400.606.2]Table IV-VII show the increase in the modified propeller efficiency for the various configurations.
At higher advance ratios, less negative thrust is produced by the modified propellers which is represented by negative values in Table IV-VII. The average increase in the modified propeller efficiency was observed to be at 22.83% for the C4 configuration when compared with the baseline configuration, followed by C3, C2 and C1 configurations at 14.77%, 12.83% and 6.4% respectively. The average is based on 16 values (4 rotational velocities and 4 flight
speeds). The modified 8x3.8 propeller was on average
14.21% more efficient than the baseline 8x3.8 propeller. The average is based on 64 values (4 configurations, 4 rotational
velocities and 4 flight speeds for each configuration).
It can be deduced from the data that, on average, the C3 configuration was 56.64% more efficient that the C1 configuration and the C4 configuration was 43.81% more efficient than the C2 configuration. It is important to note that when switching from C1 to C3 and C2 to C4 configurations the wavelength of the tubercles was kept constant and the amplitude was increased. This trend clearly demonstrates that the larger amplitude configurations are more efficient. It was also observed that when the tubercle wavelength was decreased from C1 to C2 configuration and from C3 to C4 configuration, the average increase in efficiency was 50.1% and 35.34%, respectively. This implies that the configuration with the smallest tubercle wavelength was most efficient, as explained in section IV.A-C. This trend is consistent with th`e previous studies [2], [9], [12]. It was also deduced from the data that the tubercle amplitude has a pronounced effect on propeller efficiency as compared to the tubercle wavelength, as previously concluded by [2] in case of an aeronautic wing. The propeller blade tip vorticity was reduced on average by 7.03% for the modified 8x3.8 propeller in comparison with the baseline 8x3.8 propeller. The average was taken over the four configurations and 148 data points in wake of each propeller blade tip, as shown in Fig. 12. The maximum reduction in the tip vorticity was observed to be at 25.27% for the C4 configuration. The averages mentioned in this passage are based on 64 values (4 configurations, 4 rotational velocities and 4 flight speeds for
each configuration). It can also be observed form data that
as the flight speed increased, the increase in the efficiency of the modified propellers became more evident.
IV. DISCUSSION
A. Non-Uniform Span-wise Pressure Distribution and
Counter Rotating Chord-wise Vortex Formation
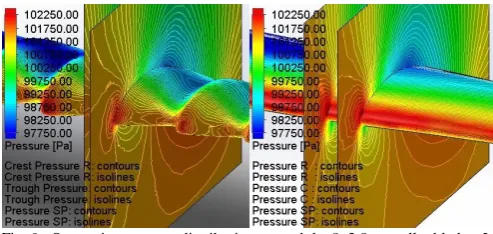
The span-wise pressure distribution for the modified propeller blade is compared with the corresponding baseline propeller blade in Fig. 8, using cross section views at various span-wise locations, shown in Fig. 9. Propeller thrust and torque are generated by a combination of the low pressure region along the suction side and high pressure region on the pressure side of the propeller blade. The low pressure region on both the suction and the pressure side of the propeller blade fade out towards the trailing edge. The low pressure region, on the suction side of the propeller blade is more prominent towards the tip of the propeller blade in the span-wise direction. While on the pressure side of the propeller blade, the low pressure region is more prominent near the root of the propeller blade. The maximum pressure region observed at the leading-edge of the propeller blade is the stagnation region. In the baseline propeller blade, this span-wise pressure distribution trend is relatively constant, as shown in Fig. 8.
[image:5.595.63.284.67.192.2]It is clear from Fig. 8 that on the suction side of the modified propeller blade the low pressure region shifts towards the leading-edge behind the tubercle troughs. On the Fig. 7. Propeller efficiency plot.
TABLEIV C1CONFIGURATION Rotational Velocity /
Advance Ratio
4,000 6,000 7,000 10,000
0.2 1.4 1.59 1.76 2.04
0.4 1.72 1.92 2.08 2.05
0.6 4.17 4.26 4.2 5.34
0.7 9.6 22.19 23.15 14.99
0.8 -3.4 -4.4 -1.71 2.73
TABLEV C2CONFIGURATION Rotational Velocity /
Advance Ratio
4,000 6,000 7,000 10,000
0.2 2.78 2.9 2.88 2.98
0.4 2.48 2.52 2.64 2.57
0.6 10.56 10.04 10.44 9.95
0.7 43.02 39.87 35.35 24.39
0.8 -31.42 -29.98 -30.83 -24.39
TABLEVI C3CONFIGURATION Rotational Velocity /
Advance Ratio
4,000 6,000 7,000 10,000
0.2 4.05 4.4 4.55 4.86
0.4 3.98 4.8 4.72 5.13
0.6 10.15 10.62 10.95 10.61
0.7 44.67 42.78 41.12 28.89
0.8 -4.35 -7.69 -8.96 -2.17
TABLEVII C4CONFIGURATION Rotational Velocity /
Advance Ratio
4,000 6,000 7,000 10,000
0.2 5.46 5.63 5.67 5.78
0.4 5.88 6.35 6.44 6.4
0.6 18.06 17.92 18.38 17.35
0.7 66.77 63.99 61.76 53.59
other hand, the low pressure region lies at a larger distance from the leading-edge behind the tubercle crests. On the pressure side of the modified propeller blade, the high pressure region shifts closer to the leading-edge of the propeller blade behind the troughs. It is noticeable that the high pressure region also lies at a smaller distance from the leading-edge of the propeller blade behind the tubercle crests.
The leading-edge of the modified propeller blade also shows a variation in the stagnation line in comparison with the baseline propeller, as shown in Fig. 9. It can be clearly seen from the Fig. 9 that the stagnation line is uniform in the baseline propeller blade and distorted in the modified propeller blade.
This trend of non-uniform pressure distribution can be attributed to the addition of tubercles in the propeller blade geometry. The similar trends of pressure distribution were also reported in case of aeronautic wings [1]-[2], [6]. The figures for less severe flight conditions are not shown because of a similar trends.
In the modified propeller blades, the vortex formation takes place behind the troughs of the tubercles, as shown in Fig. 10. The vortices have relatively high strength and small diameter near the leading-edge and the strength of these vortices decreases and their diameter increases along the chord. This trend was also reported by [11] in case of aeronautic wing. It can be clearly observed from the Fig. 10 that no such vortices exist in the baseline propeller. The formation of these vortices delay flow separation, reduce span-wise flow and strength and size of the blade tip vortices
[1]-[2], [4], [7]-[10], [12].
B. Delayed Stall, Reduction in the Blade Tip Vortices and
Reduced in the Span-wise Flow
The streamlines around the modified propeller blade are compared with the corresponding baseline propeller blade in Fig. 11 using cross sections at various span-wise locations. In the modified propeller blades, the formation of counter rotating chord-wise vortices delay flow separation behind the tubercle crests. These vortices carry high momentum flow close to the surface of the propeller blade. The boundary layer is re-energized between the vortices which leads to the delayed stall in the propeller with leading-edge tubercles. It is clear from Fig. 11 that for the modified propeller blade the flow is still attached behind the tubercle crest, even at a relatively higher advance ratio of 0.7 which is accompanied by a large negative angle of attack, while the flow separation is starting to occur behind the tubercle trough. Meanwhile, in the baseline propeller blade, the flow has already been separated at the same locations. This clearly demonstrates that the addition of leading-edge tubercles delay flow separation. This observation was also reported in the case of aeronautic wings [2], [4], [6]-[10].
In a propeller blade with leading-edge tubercles, the blade tip vortices are a result of the tubercle closest to the propeller blade tip, rather than the entire length of the propeller blade as is the case with the baseline propeller blade. This reduction in the tip vortices also contributes to Fig. 8. Span-wise pressure distribution for the 8x3.8 propeller blade cross
[image:6.595.299.550.75.155.2]sections. Top Row, L-R; Modified 8x3.8 propeller, C4 configuration; cross sections at 53% (Tubercle Crest) and 56% (Tubercle Trough) of the blade span. Bottom row, L-R; Baseline 8x3.8 propeller cross sections at 53% and 56% of the blade span; at 10,000 RPM and 0.7 advance ratio.
Fig. 9. Span-wise pressure distribution around the 8x3.8 propeller blades. L-R: Modified 8x3.8 propeller blade; C4 Configuration; baseline 8x3.8 propeller blade; at 10,000 RPM and 0.7 advance ratio.
Fig. 10. Streamline cut plots at various locations along the 8x3.8 propeller blade chords. L-R; Modified 8x3.8 propeller blade; C4 configuration, baseline 8x3.8 propeller blade; at 10,000 RPM and 0.7 advance ratio. Colored by dynamic pressure with black background. Propeller rotation is clockwise.
[image:6.595.276.546.493.656.2] [image:6.595.46.293.511.628.2]the improved efficiency of the modified propellers in comparison with the baseline propellers because of the less induced drag produced by the propeller blades with leading-edge tubercles. Fig. 12 shows tip vorticity around and in the wake of propellers. The two sections of the Fig. 12 are colored by λ2 criterion and vorticity strength, respectively. The smaller size and strength of the tip vortex for the modified propeller in comparison with the baseline propeller can be clearly observed in Fig. 12. This reduction in the tip vortex size and strength was also reported by [1], [12] for the case of aeronautic wing and tidal turbine blade with leading-edge tubercles.
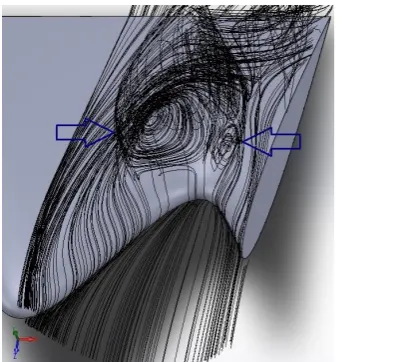
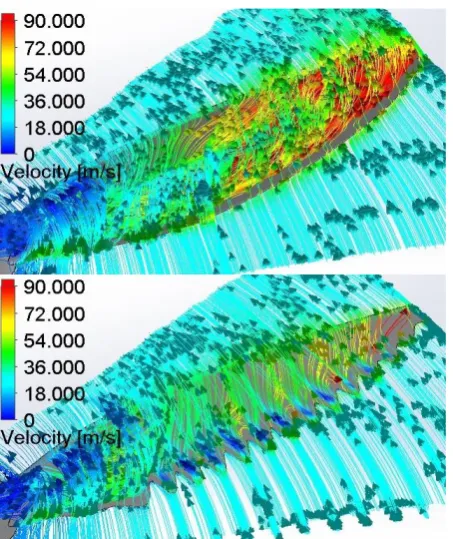
The counter rotating vortices also act as a virtual wing fence, reducing span-wise flow. A virtual barrier is formed by these vortices which causes hindrance to the volume of air directed in the span-wise direction. These vortices carry relatively higher energy than the volume of air traveling in the span-wise direction. As the volume of air traveling in the span-wise direction merges with one of these vortices, it gets redirected in the chord-wise direction. This trend was also noted by [4] in case of a humpback whale flipper, acting as an aeronautic wing. Fig. 13 shows velocity flow trajectories around the propeller blades. It is clear from the figure that the high velocity flow at mid-span to the tip of propeller blade in the baseline propeller is in the span-wise direction which is undesirable. It is also clear from Fig. 13 that at a relatively high advance ratio of 0.7, the flow is attached for the modified propeller and is directed in the chord-wise direction which is desirable. The reduction in span-wise flow for the modified propeller blade can also be more clearly
seen in Fig. 14. C. The Effect of Tubercle Geometry on Propeller
Performance
The addition of the tubercles to the propeller geometry results in an improvement in the propeller efficiency. In this section, the effect of tubercle geometry on propeller performance will be discussed. Among the configurations Fig. 12. T-B; Tip Vorticity iso-surface plot around the 8x3.8 propeller
blades. Tip Vorticity surface plot in the wake of the 8x3.8 propeller blades. L-R: Modified 8x3.8 propeller blade; C4 configuration, baseline 8x3.8 propeller blade; at 10,000 RPM and 0.7 advance ratio. Vorticity magnitudes of 850 s-1 were used for both propellers in λ
2 plots.
Fig. 13. Flow trajectories around the 8x3.8 propeller blades, relative to the rotating reference frame. T-B: Baseline 8x3.8 propeller blade, modified 8x3.8 propeller blade; C4 configuration at 10,000 RPM and 0.7 advance ratio.
[image:7.595.313.540.60.330.2] [image:7.595.52.290.212.426.2] [image:7.595.314.539.377.657.2]tested, the C4 configuration; with the smallest tubercle wavelength and the largest tubercle amplitude was observed to be the most efficient.
Tubercles can be considered analogues to variable geometry wings. An increase in the sweep angle, decrease in the wing-span, of a variable geometry wing converts a larger percentage of the oncoming air in to span-wise flow. Similarly, as the amplitude of a tubercle is increased and the wavelength decreased, the sweep angle of the tubercle is increased. This increases the local span-wise flow over the tubercle, creating stronger counter rotating chord-wise vortices and a more significant alteration of flow-field around the propellers with leading edge tubercles, as shown in Fig. 15-16.
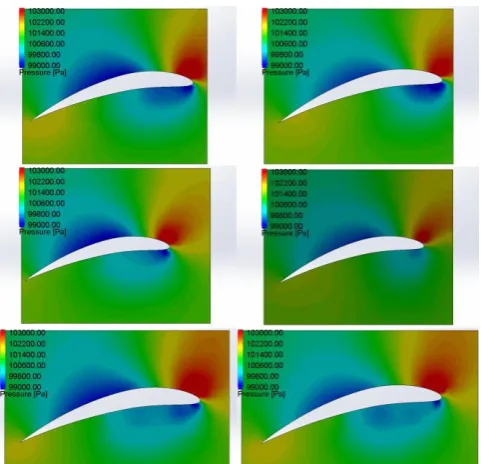
As evident from Fig. 15, on the suction side of the propeller blade, the shift in low pressure region away from the leading edge behind the tubercle crest is most in the C4 configuration, followed by the C3, C2 and the C1 configurations, respectively. While on the pressure side, high pressure region is closest to the leading edge for the C1 configuration, followed by the C2, C3 and C4 configurations, respectively.
As evident from the Fig. 16, on the suction side of the propeller blade, the shift in low pressure region towards the leading-edge behind the tubercle troughs and on the pressure side of the propeller blade, the shift in high pressure region towards the leading edge of the propeller blade is most in C4 configuration followed by C3, C2 and C1 configurations, respectively. It is clear from Fig. 8-9 and Fig. 15-16 that there is a severe pressure gradient behind the tubercle troughs, in the modified propeller blades. This is a consequence of the leading edge tubercle geometry and is a reason why the flow stalls at these locations before it stalls behind the tubercle crests.
In Fig. 17, the colored region represents the separated flow. It is clear from Fig. 17 that the region of region of separated flow is most in baseline configuration followed by C1, C2, C3 and the C4 configuration, respectively. A similar observation was reported by [8] in the case of the aeronautic wing.
[image:8.595.306.547.61.293.2]Streamlines around the propeller blade cross sections are shown in Fig. 18-19. It is clear from Fig. 18-19 that the flow separates behind the tubercle troughs before the tubercle crests and most separation occurs in the baseline configuration while the least flow separation occurs in the C4 configuration, as explained in section V.B.
Fig. 15. Span-wise pressure distribution for the 8x3.8 propeller blade cross sections. Row 1, L-R: C1 configuration, C2 configuration. Row 2, L-R: C3 configuration, C4 configuration. Row 3: Baseline configuration. All configurations at 10,000 RPM and 0.7 advance ratio. Cross sections at 53% of the blade span (Tubercle Crest)
[image:8.595.36.550.463.718.2]Fig. 16. Span-wise pressure distribution for the 8x3.8 propeller blade cross sections. Row 1, L-R: C1 configuration, C2 configuration. Row 2, L-R: C3 configuration, C4 configuration. Row 3, L-R: Baseline configuration at 61% of the propeller blade span, Baseline configuration at 56% of the propeller blade span. All configurations at 10,000 RPM and 0.7 advance ratio. C2 and C4 cross sections at 56% and C1 and C3 configurations at 61% of the blade span (Tubercle Trough)
Fig. 17. Vorticity iso-surface around the 8x3.8 propeller blades. Row 1, L-R; C1 configuration, C2 configuration. Row 2, L-L-R; C3 configuration, C4 configuration. Row 3; Baseline Configuration at 10,000 RPM and 0.7 advance ratio. Vorticity magnitudes of 20,000 s-1 were used for all the
[image:8.595.52.316.479.727.2]D. The Effect of Tubercles on Propeller performance w.r.t. Flight Speed
For fixed pitch propellers at a constant rotational velocity, the angle of attack of the propeller blades decreases and subsequently falls below zero degrees, the propeller blade experiences a large negative angles of attack at higher
advance ratios. Therefore, as advance ratio increases, the propeller efficiency decreases rapidly after a certain advance ratio as propeller blades stall. The counter rotating chord-wise vortices generated as a result of the addition of tubercles to the propeller blade geometry delay flow separation, as explained in section IV.B. This explains relatively larger efficiency improvement for the modified propellers over the baseline propellers at higher advance ratios. In a parallel explanation, the relatively larger efficiency improvement for the modified propellers can also be attributed to the increased strength of the vortices at higher flight speeds due to the higher momentum of incoming air. It can clearly be seen in the Fig. 20 that as the advance ratio increased from 0.7 to 0.8, for the baseline propeller, reversed flow occurred in a much larger section of the propeller blade. While in the modified propeller blade, some of the flow is still directed towards the chord-wise direction, even at this high advance ratio. A substantial increase in the strength of the vortices could explain this phenomenon.
V. CONCLUSION
[image:9.595.48.296.63.311.2]Computational Fluid Dynamics analysis predicts that the addition of the leading-edge tubercles to the propeller geometry leads to the formation of the counter rotating chord-wise vortex pair and the altered pressure distribution around the propeller blades. The addition of tubercles to the propeller geometry leads to the delayed flow separation, reduced span-wise flow and smaller size and strength of the propeller blade tip vortices, leading to an improvement in the propeller efficiency of 14.21%. The effectiveness of the leading edge tubercles is a strong function of the tubercle geometry. Tubercles are better suited for propellers as compared to the other passive flow control devices such as conventional vortex generators because tubercles can be integrated seamlessly in to the propeller blade geometry. The leading-edge tubercles can be employed not only on variable pitch propellers but also on a wide variety of fixed pitch propellers.
Fig. 18. Streamlines around the 8x3.8 propeller blade cross sections. Row 1, L-R: C1 configuration, C2 configuration. Row 2, L-R: C3 configuration, C4 configuration. Row 3: Baseline Configuration. All configurations at 10,000 RPM and 0.7 advance ratio. Cross sections at 53% of the blade span (Tubercle Crest)
Fig. 19. Streamlines around the 8x3.8 propeller blade cross sections. Row 1, L-R: C1 configuration, C2 configuration. Row 2, L-R: C3 configuration, C4 configuration. Row 3, L-R: Baseline configuration at 61% of the propeller blade span, Baseline configuration at 56% of the propeller blade span. All configurations at 10,000 RPM and 0.7 advance ratio. Cross sections for the C2 and C4 configurations at 56% of the blade span and at for the C1 and C3 configurations at 61% of the blade span (Tubercle Trough).
[image:9.595.300.549.310.474.2] [image:9.595.49.297.372.621.2]REFERENCES
[1] Watts, P., and Fish, F. E., “The Influence of Passive, Leading Edge Tubercles on Wing Performance,” in Proc. Unmanned Untethered
Submersible Technology (UUST01), 2001.
[2] Fernandes, Irelyn, Yogesh Sapkota, Tania Mammen, Atif Rasheed, Calvin Rebello, and Young H. Kim, "Theoretical and Experimental Investigation of Leading Edge Tubercles on the Wing Performance," in Proc. Aviation Technology, Integration, and Operations
Conference, Los Angeles, CA, 2013. doi.org/10.2514/6.2013-4300
[3] Frank E. Fish, Paul W. Weber, Mark M. Murray, Laurens E. Howle, “The Tubercles on Humpback Whales' Flippers: Application of Bio-Inspired Technology,” Integrative and Comparative Biology, Vol. 51, No. 1, pp. 203–213, 2011. doi.org/10.1093/icb/icr016
[4] Pedro, H. T. C., and Kobayashi, M. H., “Numerical Study of Stall Delay on Humpback Whale Flippers,” presented at 46th AIAA Aerospace Sciences Meeting and Exhibit, Reno, NV, 2008, AIAA Paper 2008-0584. doi.org/10.2514/6.2008-584
[5] Fish, F. E., and Lauder, G. V., “Passive and Active Flow Control by Swimming Fishes and Mammals,” Annual Review of Fluid
Mechanics, Vol. 38, pp. 193–224, 2006.
doi.org/10.1146/annurev.fluid.38.050304.092201
[6] Weber, P. W., Howle, L. E., Murray, M. M., & Miklosovic, D. S., “Computational Evaluation of the Performance of Lifting Surfaces with Leading-Edge Protuberances,” Journal of Aircraft, Vol. 48, No. 2, pp. 591-600, 2011. doi.org/10.2514/1.C031163
[7] Miklosovic, D. S., Howle, L. E., Murray, M. M., & Frank E. Fish, “Leading-edge tubercles delay stall on humpback whale (Megaptera novaeangliae) flippers,” Physics of Fluids, Vol. 16, No. 5, 2004. dx.doi.org/10.1063/1.1688341
[8] N. Rostamzadeh, K. L. Hansen, R. M. Kelso & B. B. Dally, “The formation mechanism and impact of streamwise vortices on NACA 0021 airfoil's performance with undulating leading edge modification,” Physics of Fluids, Vol. 26, No. 10, 2014. dx.doi.org/10.1063/1.4896748
[9] K. L. Hansen, R. M. Kelso & B. B. Dally, “Performance Variations of Leading-Edge Tubercles for Distinct Airfoil Profiles,” AIAA Journal, Vol. 49, No. 1, 2011. doi.org/10.2514/1.J050631
[10] Ernst A. van Nierop, Silas Alben, and Michael P. Brenner, “How Bumps on Whale Flippers Delay Stall: An Aerodynamic Model,”
Physical Review Letters, Vol. 100, No. 5, 2008.
doi.org/10.1103/PhysRevLett.100.054502
[11] K.L. Hansen, R.M. Kelso, B.B. Dally, E.R. Hassan, “Analysis of the Streamwise Vortices Generated Between Leading Edge Tubercles,” in Proc. 6th Australian Conference on Laser Diagnostics in Fluid
Mechanics and Combustion, Canberra, 2011
[12] Shi, Weichao, Mehmet Atlar, Rosemary Norman, Batuhan Aktas, and Serkan Turkmen, "Numerical optimization and experimental validation for a tidal turbine blade with leading-edge tubercles,"
Renewable Energy, Vol. 96, Part A, pp. 42-55, 2016.
doi.org/10.1016/j.renene.2016.04.064
[13] Ri-Kui Zhang and Jie-Zhi Wu, “Aerodynamic characteristics of wind turbine blades with a sinusoidal leading edge,” Wind Energy, Vol. 15, No. 3, pp 407-424, 2012. doi.org/10.1002/we.479
[14] Ibrahim, I. H., and T. H. New, "A numerical study on the effects of leading-edge modifications upon propeller flow characteristics," in Proc. Ninth International Symposium on Turbulence and Shear Flow
Phenomena. Melbourne, 2015.
[15] Ning, Zhe, and Hui Hu, "An Experimental Study on the Aerodynamics and Aeroacoustic Characteristics of Small Propellers of UAV," 54th AIAA Aerospace Sciences Meeting, San Diego, CA, 2016, AIAA Paper 2016-1785. doi.org/10.2514/6.2016-1785 [16] Brandt, J. B., & Selig, M. S., “Propeller Performance Data at Low
Reynolds Numbers,” 49th AIAA Aerospace Sciences Meeting, Orlando, FL, 2011, AIAA Paper 2011-1255. doi.org/10.2514/6.2011-1255
[17] Phillips, W. F., Mechanics of Flight, 2nd ed., Hoboken, NJ: John Wiley & Sons, 2004, pp. 144.
[18] Trebunskikh, T. V., Ivanov, A. V., & Dumnov, G. E., “FloEFD simulation of micro-turbine engine,” in Proc. Applied Aerodynamics Conference on Modelling & Simulation in the Aerodynamic Design
Process, Bristol 2012.
[19] Flow Simulation Technical Reference, 1st ed., Mentor Graphics
Corporation, Wilsonville, OR, 2016, pp 4,81.
[20] Andersson, B., Andersson, R., Håkansson, L., Mortensen, M., Sudiyo, R., & Wachem, B. v. (n.d.)., Computational Fluid Dynamics
for Engineers, 1st ed., New York: Cambridge University Press, 2011,