II
II
II
II
II
II
II
II
II
II
II
II
II
II
II
Harold Somers
Centre for Computational Linguistics, UMIST PO Box 88, Manchester M60 1QD
England
h a r o l d@ccl, u m i s t , ac. uk
A b s t r a c t
This paper explores the use of weighted cusums, a technique found in authorship attribution studies, for the purpose o f identifying sublanguages. The tech- nique, and its relation to standard cusums (cumulative sum charts) is first described, and the formulae for calculations given in detail. The technique compares texts by testing for the incidence o f linguistic 'features' o f a superficial nature, e.g. proportion of 2- and 3---letter words, words beginning with a vowel, and. so on, and measures whether two texts differ significantly in respect o f these features. The paper describes an experiment in which 14 groups o f three texts each repre- senting different sublanguages are compared with each other using the technique. The texts are first compared within each group to establish that the technique can identify the groups as being homogeneous. The texts are then compared with each other, and the results analysed. Taking the average of seven different tests, the technique is able to distinguish the sublanguages in only 43% o f the case. But if the best score is taken, 79% o f pairings can be distinguished. This is a better result, and the test seems able to quantify the difference between sublanguages.
Keywords: sublanguage, genre, register, weighted c u s u m .
1 Introduction
This paper concerns a technique which we use to measure whether two texts are representative of the same text genre or sublanguage. It is very much in the spirit of the well-known work in this field by Douglas Biber (1988, 1990, 1995), but differs crucially in that we avoid the explicit selection o f linguistic features thought a priori likely to be important in distinguishing sublangnages, and instead use a set o f low-level features based on trivial aspects of the words such as length and initial letter. Our technique is borrowed from the neighbouring field of authorship attribution (for an overview o f this field see Ule 1982; Smith 1982; Potter 1991; Burrows 1992; Holmes 1994). It is a straightforward calculation, simple to implement, and very general in application. It can be used with fairly small texts. This paper describes an experiment
to see whether the technique can be used for the sublanguage identification task, even though it was originally designed for a somewhat different problem.
In Somers (forthcoming), we used a technique called 'weighted cusums' to investigate how well a parody of Lewis Carroll had imitated his style. Look- hag also at other writings by Carroll, including his 'serious' mathematical works (under his real name, Charles Dodgson), letters to adults and children, his diaries, formal and whimsical articles in newspapers, we found that the technique, although unable to identify Carroll/Dodgson as the unique author of all the texts, as the authorship attribution literature would demand and expect, seemed to be able to group together his writings according to genre and/or topic. This was an interesting finding, because the technique, as has already been hinted, measures the most banal of linguistic features. This finding suggested to us the idea of the experiment reported ha this paper: could the technique be used to identify sublanguages?
2 Background
2.1 Sublanguage
We will assume that readers o f this paper are fairly fa- miliar with the literature on sublanguage (e.g. Kittredge & Lehrberger 1982; Grishman & Kittredge 1986), including definitions o f the notion, history o f the basic idea, and, above all, why it is a useful concept. Some readers will prefer terms like 'register' (which Biber uses); an affinity with work on genre detection will also be apparent. Because there is sometimes some dispute about the use of the term 'sublanguage', let us clarify from the start that for our purposes a sublanguage is an identifiable genre or text-type in a given subject field, with a relatively or even absolutely closed set o f syntactic structures and vocabulary. In recent years, the availability o f large corpora and 'new' methods to process them have led to renewed interest in the question of sublanguage identification (e.g. Sekine 1997), while Karlgren & Cutting (1994) and Kessler et al. (1997) have focussed on the narrower but clearly related questio.n of genre.
same sublanguage, and of quantifying the difference between texts: our technique compares texts palrwise and delivers a 'score' which can be used to group texts judged similar by the technique. As we shall see later, what is o f interest here is that the score is derived from a simple count o f linguistic features such as word length and whether words begin with a vowel; yet this apparently unpromising approach seems to deliver usable results.
In his well-known study, Biber (1988) took a number of potentially distinct text genres and measured the incidence o f 67 different linguistic features in the texts to see what correlation there was between genre and linguistic feature. He also performed factor analysis on the features to see how they could be grouped, and thereby see if sublanguages could be defined in terms o f these factors.
The linguistic features that Biber used I are a mixture o f lexical and syntactic ones, and almost all require a quite sophisticated level of analysis o f the text data - dictionary look-up, tagging, a parser. They are presumably also, it should be said, hand-picked as features whose use might differ significantly from one genre to another. Although Biber gives details of the algorithms used to extract the features, it is not a trivial matter to replicate his experiments.
Kessler et al. (1997) make the same criticism of Biber and o f Karlgren & Cutting (1994), and restrict their experimentation on genre recognition to "surface cues". In their paper they do not give any detail about the cues they use, except to say that they are "mainly punctuation cues and other separators and delimiters used to mark text categories like phrases, clauses, and sentences" (p. 34); however, Hinrich Schfitze (personal eornmunication) has elaborated that "The cues are punctuation, non-content words (pro- nouns, prepositions, auxiliaries), counts of words, [of] unique words, [of] sentences, and [of] characters; and deviation features (standard deviation of word length and sentence length)". As we shall see below, the use o f superficial linguistic aspects o f the text is a feature of the approach described here.
2.2 Authorship attribution and weighted eusums
Authorship attribution has for a long time been a significant part o f literary stylistics, familiar even to lay people in questions such as "Did Shakespeare really write all o f his plays?", "Who wrote the Bible?", and
I The features can be grouped into "sixteen major categories: (A)
tense and aspect markers, (B) place and time adverbials, (C) pronouns and pro-verbs, (D) questions, (E) nominal forms, (F) passives, ((3) stative forms, (H) subordination features, (I) adjectives and adverbs, (J) lexical specificity, (K) specialized lexical classes, (L) medals, (M) specialized verb classes, (hi) reduced or dispreferred forms, (O) coordination, and (P) negation." (Biber 1988:223)
so on. With the advent of computers, this once rather subjective field o f study has become more rigorous, attracting also the attention of statisticians, so that now the field of 'stylometrics' - the objective measurement o f (aspects) of literary style - has become a precise and technical science.
One technique that has been used in authorship attribution studies, though not without controversy, is the cumulative sum chart ('cusum') technique, a variant o f which: we shall be using for our own investigation. Since we" are not actually using standard cusums here, our explanation can be relatively brief. Cusums are a fairly well-known statistical device used in process control. The technique was adapted for author identifi- cation by Morton (1978) - see also Farringdon (1996) - and achieved some notoriety for its use in court cases (e.g. to identify faked or coerced confessions) as well as in literary studies. The technique is easy to implement, and requires only small m o u n t s of text.
A cusum is a graphic plot based on a sequence o f measures. For example, suppose we have a set o f measures (11,7,4, 10,2 . . . . ) with a mean value o f 6. The corresponding divergences from the mean are ( 5 , 1 , - 2 , 4 , - 4 , . . . ) . The cusum chart plots not these divergences, but their aggregate sum, i.e. (5, 6, 4, 8, 4 , . . . ) , the sequence inevitably ending in 0. The plot reflects the variability of the measure: the straighter the line, the more stable the measure. In authorship attribution studies, the eusum chart is used to plot the homogeneity of a text with respect to a linguistic 'feature' such as use of two- and three-letter words on a sentence-by-sentence basis. Two graphs are plotted, one for the sentence lengths, the other for the incidence o f the feature, and superimposed after scaling so that they cover roughly the same range. The authorship identification technique involves taking the texts in question, concatenating them, and then plotting the eusum chart. I f the authors differ in their use o f the linguistic feature chosen, this will manifest itself as a marked divergence in the two plots at or near the point(s) where the texts have been joined.
There are a number of drawbacks with this method, the main one being the manner in which the result o f the test is arrived at, namely the need to scrutinize the plot and use one's skill and experience (i.e. subjective judgment) to determine whether there is a "significant discrepancy" at or near the join point in the plot.
A solution to this and several other problems with the standard cusum technique is offered by Hilton & Holmes (1993) and Bissell (1995a,b) in the form o f weighted cusums (henceforth WQsums). Since this is the technique we shall use for our experiments, we need to describe it in full detail.
Somers 132 Use Weighted Cusums to Identify Sublanguages
II
II
II
II
II
II
II
II
II
II
II
II
II
II
¢
/
/
I
l
I
!
/
l
/
/
3.1 The calculations
As in the standard cusum, the WQsum is a measure o f the variation and homogeneity o f use of a linguistic feature on a sentence-by-sentence basis throughout a
text. It captures not only the relative amount of use o f
the feature, but also whether its use is spread evenly throughout the texts in question.
In a WQsum, instead o f summing the divergence
from the mean wi - ~ for the sentence lengths w and
similarly xi-£" for the linguistic feature x, we sum x i - ~'wi, where /r, the 'weight', is the overall proportion o f feature words in the whole text, as given by (I). As Hilton & Holmes (1993) explain, this weighting means that we are calculating "the cumulative sum o f the difference between the observed number of feature occurrences and the 'expected' number of occurrences"
(p. 75).
~ _ E ~ i
(1)
As we shall see shortly, the variation in a WQsum can be measured systematically, and its statistical sig- nificance quantified with something like a t-test. This means that visual inspection o f the WQsum plot is not necessary. There is no need, either, to concatenate or sandwich the texts to be compared. For the t-test, the two texts, .4 and B, are treated as separate samples. The formula for t is (2).
t = I~rA -- ~'S[ (2)
The t-value is, in the words of Hilton & Holmes, "a • measure o f the evidence against the null hypothesis that the frequency o f usage o f the habit [i.e. linguistic feature] under consideration is the same in Text A and Text B. The higher the t-value, the more evidence against the hypothesis" (.p. 76). The formula chosen for the calculation o f variance e in (2) is given in (3),
where n is the number o f sentences in the text.
The resulting value is looked up in a standard t- table, which will tell us how confidently we can assert that the difference is significant. For this we need to know the degrees of freedom v, which depends on the
v = nA + nB - 2 (4)
3.2 The linguistic features
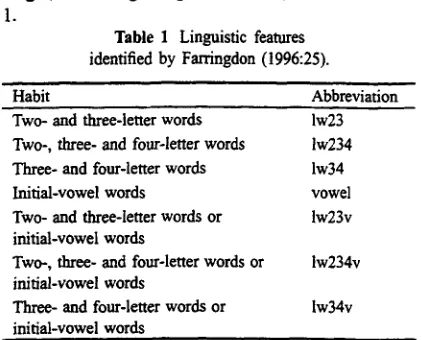
A point o f interest for us is that both the cusums and WQsums have been used in the stylometrics field to measure the incidence of linguistically banal features, easily measured and counted. The linguistic features proposed by Farringdon (1996:25), and used in this experiment, involve the number of words of a given length, and/or beginning with a vowel, as listed in Table
1.
Table 1 Linguistic features identified by Farringdon (1996:25).
Habit Abbreviation
Two- and three-letter words Iw23
Two-, three- and four-letter words 1w234
Three- and four-letter words lw34
Initial-vowel words vowel
Two- and three-letter words or lw23v
initial-vowel words
Two-, three- and four-letter words or lw234v
initial-vowel words
Three- and four-letter words or lw34v
initial-vowel words
Other experimemers have suggested counting the number of nouns and other parts of speech, but it is not clear if there are any limitations on the linguistic features that could be used for this test, except the obvi- ous one that the feature should in principle be roughly correlated with sentence length. In any case, part o f the attraction for our experiment is that the features are so fundamentally different from the linguistic features used by Biber in his experiments, and so will offer a point o f comparison. Furthermore, they are easy to compute and involve no overheads (lexicons, parsers etc.) whatsoever.
It is also interesting to note that the WQsum is a measure o f variation, a type o f metric which, according to Kessler et al. (1997) has not previously used in this type of study.
[image:3.612.313.524.206.376.2]is not obvious that it makes sense any more to treat this as a t-score, and in the experiments described below we tend to treat it as a raw score, a lower score indicating cohesion, a higher score suggesting difference. Nevertheless it is useful to bear in mind that, given the degrees o f freedom involved in all eases (the texts are all roughly the same length), the threshold for siguifieance is around 1.65.
4 The method
Our experiment is to use the WQsum test on a corpus o f small texts which we believe can be grouped according
to genre or sublanguage. We gathered 15 sets o f
different text-types: each set of three texts is assumed to represent a different sublanguage, and each text was written, as far as we know, by a different author. The 15 groups o f texts were as follows:
blurbs publishers' announcements of scientific text- books
B M J abstracts of articles appearing in the British
Medical Journal
childrcns extracts from children's stories
church articles from local Catholic church newsletters economy economic reports from a Swiss bank e-mails discussing arrangement o f a meeting
footie reports o f soccer matches from the same news- paper, same date
lawreps extracts from The Weekly Law Reports
obits obituaries of Jacques Cousteau, from different newspapers
recipes recipes from the Interact Chef web site TVscripts Autocue scripts from Central TV News
programmes
tourism extracts from the "Shopping" seetiorL o f Berlitz guides
univs descriptions o f Computer Science courses weather state-wide general weather forecasts from US
National Weather Service xwords sets o f clues to cryptic crosswords
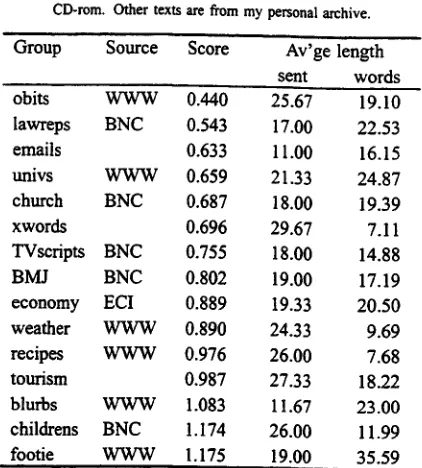
Our first task is to see that the WQsum test can confirm the homogeneity o f the text triplets. For each group o f three texts, we ran our test and averaged the t-scores for each group. Table 2 shows an example o f this for the "church' group of texts. Table 3 lists the 14 groups together with some information about the texts, including their 'homogeneity score', an indication o f their length (average number of sentences, and average words per sentence), and their source.
The first thing to note is that all the groups o f texts are well within the 1.65 threshold o f significant difference. In other words, the pairwise WQsum test for each group firmly indicates homogeneity within the groups.
Table 2 WQsum test results for 'church' text set. Scores marked '*' suggest a difference significant at p < .05.
A - B A-C B--C overall
Iw23 0.576 0.388 0.055
1w234 0.131 0.781 0.834
1w34 0.906 0.102 0.843
vowel 1.860" 1.729" 0.489
lw23v 0.256 0.402 0.502
lw234v 0.569 1.211 0.963
lw34v 0.301 0.845 0.683
av'ge 0.657 0.780 0.624 0.687
Table 3 The 15 gems, in order of 'homogeneity'. The texts marked WWW were taken from the web, BNC
the British National Corpus, and ECI the ACL/ECI CD-rom. Other texts are from my personal archive.
Group Source Score Av'ge length
sent words
obits W W W 0.440 25.67 19.10
lawreps BNC 0.543 17.00 22.53
emails 0.633 11.00 16.15
univs W W W 0.659 21.33 24.87
church BNC 0.687 18.00 19.39
xwords 0.696 29.67 7.11
TVscripts BNC 0.755 18.00 14.88
BMJ BNC 0.802 19.00 17.19
economy ECI 0.889 19.33 20.50
weather W W W 0.890 24.33 9.69
recipes W W W 0.976 26.00 7.68
tourism 0.987 27.33 18.22
blurbs W W W 1.083 11.67 23.00
ehildrens BNC 1.174 26.00 11.99
footie W W W 1.175 19.00 35.59
We now proceed to compare all the texts with each other, pairwise. It is fortunate that the WQsum procedure is so simple, since this pairwise comparison involves a huge number o f iterations: each text com- parison involves seven applications o f the WQsum test, each group comparison involves nine text comparisons, and there are 105 pairwise group comparisons, making a total of 6615 tests. In the following section we will attempt to summarize the findings to be had from this large body of data.
5 Results
The full results o f the comparison are given in Table 4. This table shows the pairwise average t-scores, repli- cated for ease o f consultation. The groups are ordered as in Table 3, so that results in the top left-hand comer
Somers 134 Use Weighted Cusums to Identify Sublanguages
1
1
1
1
1
II
II
1
1
1
1
1
1
1
[image:4.612.320.531.243.477.2]II
II
II
II
II
II
II
II
II
scores given on the diagonal are repeated from Table 3 and show the average score for the internal comparison o f the texts in that group.
This time we are looking for high scores to
support the hypothesis that the WQsum test can identify the texts as belonging to different sublanguages. At first glance the results look disappointing. If we again take a score o f 1.65 as the notional cut-off point, then only 43% (45 out o f 105) o f the results qualify. On the other hand, if we compare the scores with those for the group-internal comparisons (Table 3), we may view the
results more positively. The average internal score was
0.885 (s.d. = 0.232), the worst score 1.175; 67% of our scores are better than that.
One problem stems from averaging the scores
for all the tests. When the WQsum test is used in authorship attribution, it is necessary first to determine which linguistic feature is significant for the author under investigation. Looking at the raw scores for our experiment, we see that very often consistently high scores with one test are undermined by low scores on others. Table 5 shows an example of this, where an average score o f 2.197 on the '1w34' test is mitigated by insignificant scores on the other test, giving an overall average o f 1.074.
Table 5 Raw scores for 'childrens'-'emails' comparison.
lw23 1w234 lw34 vowel lw23v lw234viw34v
A-X 2.322 2.596 3.397 2.660 0.174 0.737 0.299
A-Y 0.732 1.896 3.725 0.796 0.261 1.460 1.205
A-Z 0.932 1.253 1.684 1.359 0.237 0.383 0.190
B-X 0.085 1.062 2.822 2.271 0.900 0.129 0.041
B-Y 1.732 0.714 3.090 0.941 1.215 0.553 0.622
B-Z 0.765 0.328 1.633 1.349 0.927 0.070 0.138
C-X 0.648 0.604 1.460 3.553 0.342 0.133 0.522
C-Y 1.420 0.169 1.795 1.449 0.692 0.419 0.455
C-Z 0.314 0.310 0.171 2.058 0.343 0.381 0.714
av'ge 0.994 0.992 2.197 1.826 0.565 0.473 0.465
So an alternative that suggests itself is to take
in each case the highest of the average scores for each
linguistic feature, on a pairwise basis. These alternative results are presented in Table 6, which also shows in each ease which linguistic feature gave the best result. Since we are now taking the highest rather than the average score for the pairwise comparisons, we should also take the highest score for within-group comparison,
this time 82 o f the 105 results (78%) are above the 1 . 6 5 0 threshold. However, taking the highest rather
than the average score for the within-groups comparison
leaves four of the g r o u p s - 'TVseripts', 'recipes',
'tourism' and 'childrens' m with scores above the 1.65 threshold, and a fifth group, 'weather', has a score very close to this. The scores for these groups are otten high for comparisons with other texts, but they are also high for the within-group comparison: this suggests that the texts in these groups are not homogeneous, so we have to take this into account when we consider the results in the discussion that follows.
6 D i s c u s s i o n
6.1 Does the WQsum test identify different sublanguages?
Let us consider first the results as shown in Table 6. Our main concern of course is to see whether the WQsurn test can identify and distinguish the groups. Taking 1.65 as our threshold, we can rank the groups according to the number of other groups with which each gets a pairwise score average above this threshold. In addition, since the 'ideal' situation as far as our hypothesis goes would be for a low within-group aver- age score suggesting homogeneity, and a high average score for comparisons with other groups, suggesting distinctiveness, as a further, informal measure of the extent to which the groups meet this condition, we can divide the average comparison score by the within- group score. Table 7 shows a ranking of the groups along these lines.
The groups seem to divide into roughly four types. The first type, groups which support our hypothesis the best, have a low within-group average, a high pairwise average, and can easily be distinguished from most o f the other groups. In this group are 'xwords', 'univs', 'blurbs', 'BMJ', and 'economy'. At the other end o f the scale, at the bottom of Table 7, are those groups which can have a low 'Sig.' score. This group is not necessarily marked by a low pairwise average or a high within-group score: the 'obits' group for example has the second lowest within-group average, and scores quite highly on our informal ratio score. Yet the WQsum test cannot distinguish it from six of the other groups.
A third type is where the 'Sig.' score is high
~ E
o
o
u
.~
¢
.~_
~
0
¢J
0
0 0 ¢.)
t ~ t ~
> [-
0 a< ,.I= ¢-
¢= 0
~ ~'~ ~'~ ~D r ~ O~ ~ " 0 r ~ O ~ ~ - "4~
- - o - - ¢4 o - - - - ~ - - ~ ~ - - t 4 - -
1
¢ q ¢¢)
0 tt%
p ~ r ~ r ~
r ~ 0 0 ~4D re)
t~ ¢¢~ ¢.4 o 0 ¢'~
0 ¢'4 "~" r,~
0
"~" 0 t ' ~ o ~ t ~ ~ o o
¢¢~ ¢ ~ t "~ o o ¢¢) ¢ ~ ",D r ~ ~ ~D ¢¢~
o o t ~ o o " ~ ~'~ ~ ~ O~ t "~
¢,4 , ' ~
~ . ~ ~ ,¢.. ~ . ,,.. ~ ~ ~ . r,, r,- q o . ~ .
S o m e r s 136 U s e W e i g h t e d C u s u m s t o I d e n t i f y S u b l a n g u a g e s
I
I
I
l
l
|
I
I
l
I
l
I
l
|
/
/
/
l
/
/
/
/
/
/
/
= > e',i ~ e',i e 4 "n: ~ ,ff eq ,,6 ~ ¢'-i ~ e,': e',i e,i
_ ~ = ~ ~ ~ e , - ~ - ~ ' ~ _
- " ~ "~ - - ~ .~, ~ ~ " ,,o
• _ - . ~ ~ N = = =
.o
_ ~ ~ . ~ ~ . _ . ~ , ,.~ ' ~ ~"
- ~ . ~ , ~ ' .
.~ ~ ~ ~. ~ . ~ . ~ ~ ~ ~ ,'~ ~
• . • .
~ --~ ,~ ~
° ~
~ . =
° ~
..=
- ~
¢ ' r l i ~ i It~',-
• ~ ~ ~ t',l ~ ~ ~ ~--~ tt%
• -.: ,--; ea ~ ~ eq ,--; ¢',i e,:, ~ t',,i
• ~ ~ ,~- ~ ~ . ~ ~ , eq e -
• . ~ . ~ e ~ t",,I ¢,q ~ o
i _ , . ° .
~ ~ ~ ~ ~ ~ ~
o
~
~ ~ ~ ~ ~ g
~ -
- x .~ ~ . ~ ~ ~ ~ ~ ~ t.-. I
C
t ' q
t",,I
w ' l
t ~
, D
Table 7 The 15 groups ranked first according to total of pairwise averages above the 1.65 threshold ('Sig.'),
and secondly according to the informal score described in the text. An asterisk indicates a group where
the within-group average is above the 1.65 threshold.
Group Pairwise Within Score Sig. average group
recipes * 5.558 1.870 2.972 14
xwords 2.380 0.930 2.559 14
TVscripts * 3.527 2.254 1.565 14
univs 3.634 1.507 2.411 13
childrens * 3.631 2.045 1.776 13
blurbs 3.399 1.363 2.494 12
BMJ 3.340 1.555 2.148 12
economy 2.495 1.276 1.955 12
lawreps 2.316 0.866 2.674 10
emails 2.399 1.025 2.340 10
tourism * 2.685 1.815 1.479 I0
footie 2.585 1.386 1.865 9
obits 2.369 0.948 2.499 8
church 2.179 1.359 1.603 8
weather * 1.907 1.638 1.164 7
1.65 threshold, suggesting lack of homogeneity among the recipes, the average of the scores for pairwise comparisons with other groups is sufficiently high to compensate this: as Table 6 shows, the average scores for recipes are consistently high, and ot~en the highest in any row. This can be contrasted with the case o f the 'church' group, where the within-group average is below the 1.65 threshold, but so are nearly half the scores for pairwise comparisons. But the situation can also be contrasted with the 'TVseripts' and 'childrens' groups: pairwise scores with all the other grofaps indicate significant differences, but so does the within- group average. This means that each TV script or children's story seems significantly different from all the other samples, including the other TV scripts or children's stories. For the 'tourism' group, too, the scores for pairwise comparison are about the same as the within-group score. It so happens that these scores are a bit nearer the threshold, so we get a 10-4 'Sig.' score rather than 14--0, but the conclusion is the same: the WQsum earmot distinguish these sublanguages.
Finally we have the case o f the 'lawreps' and 'emails', which are internally homogenous, and can be distinguished from some, but not all of the other groups. Let us now summarize these observations, and categorize the four types:
A Good result. Homogeneous and distinctive sub- language: 'xwords', 'univs', 'blurbs', 'BMJ', and
'economy'.
B1 Distinctive sublanguage though internally less ho- mogeneous: 'recipes'
B2 Coherent sublanguage though not always distinc- tive: 'lawreps', 'emails'
C Distinctive but not coherent: 'TVscripts', 'chil- drens'
D Not distinguishable from other groups: "obits', 'tourism', 'footie', 'church', 'weather'
[image:8.612.92.298.118.337.2]Not surprisingly, if we look at an ordered list o f the individual pairwise scores, we find that the worst scores (Table 8) are mostly between the groups o f type Bz and D.
Table 8 Ten worst-scoring pairwise comparisons.
lawreps (B2) obits (D) 0.905 church (D) obits (D) 0.915 church (D) lawreps (B2) 1.020 lawreps (B2) weather (D) 1.086 church (D) emails (B2) 1.139 emails (B2) lawreps (B2) 1.141 blurbs (A) BMJ (A) 1.204 church (D) footie (D) 1.216 footie (D) weather (D) 1.290 footie (D) lawreps (B2) 1.299
This suggests that the WQsum test is able to quantify the similarity of individual groups, as well as to distinguish sublanguages. In this experiment we have taken groups o f texts and compared them, but in fact the WQsum algorithm is designed to work on the basis o f individual texts. In principle, we could simply take a pair of texts and use the algorithm to determine to what extent they are the same sublanguage. It must be said however that it seems to make more sense to use the test in the comparative manner illustrated here, for example comparing three texts to see which pair is most similar. It also seems important to have a baseline score for an established group of texts belonging to the same sublanguage.
6.2 Reservations and future directions
A very short time before the final version o f this paper was due to be delivered, a further possibility came to our notice. Tweedie & Donnelly (1996) describe an alternative, multivariate test using weighted eusurns to compare more than two texts. Although we have not had a chance to study this proposal, it claims to give more accurate results than the pairwise application o f the WQsum formula that has been reported in this paper. An obvious next step is to try their proposal.
Also, a further step that we might take would be to answer the criticism that the scale of our investigation is too small. The fact that we have taken only three 25- sentence samples o f each sublanguage obviously means
II
II
II
!1
II
!1
tl
II
I!
II
II
[image:8.612.330.519.216.351.2]II
II
II
II
II
il
II
II
II
II
that our conclusions must be somewhat limited. An anonymous reviewer commented that "the texts were so different, that it shouldn't be hard at all to discriminate between them". The results in Tables 4 and 6 show that this is not the ease at all: the groups that the test failed to distinguish are not necessarily those which to the human eye are most similar (see Table 8), nor are the successfully identified groups necessarily the most dissimilar. Perhaps this finding is not so surprising when we consider that the linguistic features that are used in the test are so superficial: there is no reason to expect that the incidence of words beginning with a vowel, for example, would correlate highly with sublanguage type. And therein lies the real interest of this technique: because the linguistic features are superficial, it seems that there is no intuition that we can appeal to here.
Finally, throughout this paper we have referred to 'sublanguage', and the possibility that bur WQsum algorithm can identify different sublanguages. It seems that the algorithm can distinguish texts, but it is by no means clear what aspect o f their difference it is capturing. It could for example be merely genre, or some other aspect of sublanguage, that it is capturing though again intuitions are difficult to appeal to because of the superficiality of the linguistic features used. We need to look more closely at the differences between the text pairs it fails to distinguish and those where it succeeds, in order to try to get a feel for what, exactly, the test is capturing. Nevertheless, we feel that it is an interesting avenue to explore, the more so as it seems to be quite unlike the other methods described in this field.
References
Biber, Douglas. 1988. Variation across Speech and Writing. Cambridge University Press.
Biber, Douglas. 1990. Methodological issues regarding corpus-based analyses o f linguistic variation. Literary and Linguistic Computing 5:257-269. Biber, Douglas. 1995. Dimensions of Register
Variation: A Cross-Linguistic Comparison. Cambridge University Press.
Bissell, A. F. 1995a. Weighted cumulative sums for text analysis using word eotmts. Journal of the Royal Statistical Society A, 158:525-545.
Bissell, Derek. 1995b. Statistical Methods for Text Analysis by Word-Counts. Swanseaf European Business Management School, University of Wales. Burrows, J.F. 1992. Computers and the study of literature. In Christopher S. Butler (ed.) Computers
Farringdon, Jill M. 1996. Analysing for Authorship: A Guide to the Cusum Technique. Cardiff: University of Wales Press.
Grishman, Ralph & Richard Kittredge. 1986. Analyzing Language in Res~'cted Domains. Hillsdale N J: Lawrence Erlbaum Associates. Hilton, Michael L. and David I. Holmes. 1993. An
assessment o f cumulative sum charts for authorship attribution. Literary and Linguistic Computing 8:73-80.
Holmes, David, I. 1994. Authorship attribution. Computers and the Humanities 28:87-106. Karlgren, Jussi & Douglas Cutting. 1994. Recognizing
text genres with simple metrics using diseriminant analysis. COLING 94: The 15th International Conference on Computational Linguistics, Kyoto, Japan, 1071-1075.
Kessler, Brett, Geoffrey Nunberg & Hinrich Schiatze. 1997. Automatic detection of text genre. 35th Annual Meeting of the Association for Computational Linguistics and "Sth Conference of the European Chapter of the Association for Computational Linguistics, Madrid, Spain, 39--47. "Kittredge, Richard & John Lehrberger (eds) 1982.
Sublanguage: Studies of Language in Restricted Semantic Domains. Berlin: de Gruyter.
Morton, Andrew Queen. 1978. Literary Detection: How to Prove Authorship and Fraud in Literature and Documents. London: Bowker.
Potter, Rosarme G. 1991. Statistical analysis of literature: a retrospective on Computers and the Humanities, 1966-1990. Computers and the Humanities 25:401--429.
Sekine, Satoshi. 1997. A new direction for sublanguage NLP. In D. B. Jones & H. L. Somers (eds) New Methods in Language Processing, London: UCL Press, 165--177.
Smith, M.W.A. 1982. Recent experience and new developments o f methods for the determination of authorship. ALLC Bulletin 11:73--82.
Somers, Harold. Forthcoming. Using weighted cusums to evaluate a Lewis Carroll pastiche. To appear in Computers and the Humanities.
Tweedie, Fiona J. & Christi A. Donnelly. 1996. A multivariate test for the attribution o f authorship of N texts. In G. Perissinotto (ed.) Research in Humanities Computing 5, Oxford: Oxford University Press, 243---248.