Native Language Identification
Using a Mixture of Character and Word N-grams
Elham Mohammadi, Hadi Veisi and Hessam Amini
Data and Signal Processing Lab (DSP Lab) Faculty of New Sciences and Technologies (FNST)
University of Tehran (UT), Tehran, Iran
{elham.mohammadi;h.veisi;hessam.amini}@ut.ac.ir
Abstract
Native language identification (NLI) is the task of determining an author’s native lan-guage, based on a piece of his/her writ-ing in a second language. In recent years, NLI has received much attention due to its challenging nature and its applications in language pedagogy and forensic linguis-tics. We participated in the NLI Shared Task 2017 under the name UT-DSP. In our effort to implement a method for na-tive language identification, we made use of a mixture of character and word N-grams, and achieved an optimal F1-score of 0.7748, using both essay and speech transcription datasets.
1 Introduction
Native Language Identification (NLI) is the task of using a piece of writing in a second language in or-der to determine the writers native language. The main applications of NLI are in language teaching and also in forensic linguistics (Kochmar,2011).
In language teaching, NLI can help in determin-ing the role of native language transfer in second language acquisition, so that course designers can change the material based on the native language of the learners (Laufer and Girsai,2008).
In forensic linguistics, NLI can be the starting point in making assumptions about the authors identity of a text which is of some interest to in-telligence agencies, yielding the linguistic back-ground of the author (Tsvetkov et al.,2013).
The 2017 shared task contains 3 sub-challenges (Malmasi et al.,2017). The first challenge is pre-dicting the native language of an English language leaner using a standardized assessment of English proficiency for academic purposes. The second challenge is native language identification using
the transcriptions of spoken responses produced by test takers. The last sub-part of the NLI Shared Task 2017 is a fusion of the two, i.e. we have both written and spoken responses from test takers at our disposal in order to make a prediction about their native language.
Our team, UT-DSP participated in the NLI Shared Task 2017. An account of our participa-tion is given in this paper.
2 Related Work
The first NLI Shared Task was organized in 2013 (Tetreault et al.,2013). The task was designed to predict the native language of an English learner based only on his/her English writing. The cor-pus used for the training phase of the task was the TOEFL11 corpus (Blanchard et al.,2013) which contained 11000 English texts written by native speakers of 11 different languages.
29 teams participated in total, achieving an overall accuracy rate between 0.836 and 0.319. According to the NLI Shared Task 2013 report, the prevailing trend among different teams was using character, word, and POS N-grams (Jarvis et al.,
2013;Henderson et al.,2013;Bykh et al.,2013). The leading team (Jarvis) used the support vec-tor machine (SVM) method with as many as more than 400,000 unique features including lexical and POS N-grams.
A number of teams employed simple N-gram-based methods as the implementation of these ap-proaches can be simpler and, as a result, less time-consuming. (Gyawali et al.,2013) developed four different models using character n-grams, word n-grams, POS n-grams, and the perplexity rates of character n-grams. They used an ensemble of these 4 different models to achieve an accuracy rate of 0.75. (Kyle et al.,2013) used an approach employing key N-grams. They could outperform
the random baseline with an accuracy of 0.59. Three years after the first NLI Shared Task, in 2016, the Computational Paralinguistics Chal-lenge included a sub-task aiming at the prediction of native language based on recordings of spoken responses. The accuracy rates reported by partic-ipating teams ranged from 30.9 to 47.5 per cent (Schuller et al.,2016).
3 Data Description
The datasets for the NLI Shared Task 2017 were released by the Educational Testing Service (ETS). These datasets were released in 4 phases, two of which belonged to the training, and the re-maining two belonging to the testing phases. Each dataset released contained an equal number of files belonging to each of the following 11 languages: Araic, Chinese, French, German, Hindi, Italian, Japanese, Korean, Spanish, Telugu, and Turkish.
3.1 Train - Phase 1
In this phase, a dataset containing 12,100 essay files was released, 1,100 of which were included in a collection named dev chosen for evaluation purposes, and the rest were used for training the method.
3.2 Train - Phase 2
The dataset released in this phase contained a col-lection of 12,100 speech files, which were added to the essay files released in the previous phase. Similar to the previous phase, 1,100 of the speech files were chosen as thedevcollection, in order to be used for evaluation. The remaining files were used to train the method.
As, in this stage, both essay and speech files were at our disposal, we could train a method to predict the test taker’s native language, using both essay and speech datasets simultaneously, as well as using them separately.
3.3 Test - Phase 1
The first test phase’s purpose was to test the im-plemented methods for native language prediction, using speech and train collections separately. The essay and speech collections contained 1,100 files each, with no overlap among the files in the two.
3.4 Test - Phase 2
The aim of this phase was to test the fusion method on a collection of files, belonging to 1,100 test
tak-ers. For each test taker, an essay and a speech file were included in the collection.
4 Methodology
An N-gram-based language model is used to es-timate the probability of the occurance of the next language particle (i.e. character, word, etc.) given its N previous particles of the same type, by using a maximum likelihood estimation (MLE) approach (Amini et al.,2016;Brown et al.,
1992). For example, consideringN(wi
i−n+1) as the number of occurances of the word sequence
wi−n+1wi−n+2...wi−1wi in a corpus, the n-gram probability of word wi based on the sequence of wordswi−n+1wi−n+2...wi−1 which come before it, is computed using formula 1:
Pw(wi|wii−−n1+1) = N(w
i i−n+1)
N(wii−−n1+1) (1) Our work employed a simple approach using a mixture of character and word N-grams. In or-der to do so, we had to train N-grams for each of the essay and speech transcription datasets in each language. The method was implemented without the use of i-vectors.
To compute the character N-grams, we first extracted two separate lists of characters from the essay and speech files. Then, for each lan-guage within each of the essay and speech groups, we computed the character trigrams and 4-grams, smoothed using the additive smoothing method withα= 0.1.
In order to compute the word N-grams, two sep-arate lists of words from the essay and speech files were extracted. These two lists were then limited to the words which were encountered more than once. Afterwards, we computed the word monograms and bigrams (considering out-of-vocabulary words), which were smoothed using the additive smoothing method withα= 0.01.
In order to predict the native language for a text file, considering it as an essay/speech transcrip-tion, we have to compute its probabilities using character and word N-grams of essay/speech for each language. The character-level probabilities are computed using the formulas 2 and 3:
P robl,c−3(C) =
m
X
i=3
P robl,c−4(C) =
m
X
i=4
logPl,c−4(ci|ci−3ci−2ci−1) (3) In which P robl,c−N(C) stands for the character-level probability of the text by the character N-gram for languagel,mis the number of characters in the text, Pl,c−3(ci|ci−2ci−1) represents the character trigram probability of languagelfor character ci given its two previous characters, andPl,c−4(ci|ci−3ci−2ci−1)represents the character 4-gram probability of languagelfor charactercigiven its three previous characters.
The word-level probabilities are computed us-ing the formulas 4 and 5:
P robl,w−1(W) =
n
X
i=1
logPl,w−1(wi) (4)
P robl,w−2(W) =
n
X
i=2
logPl,w−2(wi|wi−1) (5)
In which P robl,w−N(W) stands for the word-level probability of the text by the word N-gram for language l, n is the number of words in the text, Pl,w−1(wi) represents the word mono-gram probability of languagel for word wi, and Pl,w−2(wi|ci−1)represents the word bigram prob-ability of languagelfor wordwigiven its previous word.
In order to compute the character-level N-grams, we used the 4-gram probability to predict the language of an essay file, while for speech files, we used the summation of trigram and 4-gram character probabilities. In both essay and speech files, we used the sum of word-level mono-gram and bimono-gram probabilities. These N-mono-grams were chosen in a way that they could achieve the best results on thedevdataset, when trained using thetrainone.
In order to compute the final probability of a text file for each language, we added the character-level and word-character-level probabilities together. The language with the highest probability was chosen as the predicted language for the text. To test our system on thetestdataset, we trained our system using bothtrainanddevdatasets.
5 Results
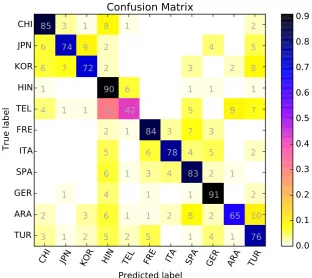
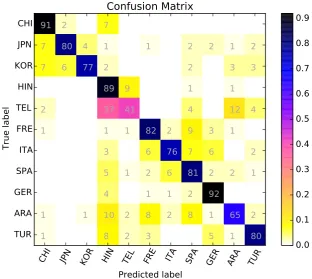
In the first test phase, we achieved the macro F1-score of 0.7609 and the overall accuracy of 0.7636 on the Essay track, and the macro F1-score of 0.4530 and the overall accuracy of 0.4536 on the Speech track. Tables 1 and 2 show our method’s performance on each class, and Figure 1 and 2 show the confusion matrices yielded in the first test phase.
In the second test phase, we tested our system using both essay, speech, and the fusion of both essay and speech datasets. Table 3 shows the re-sults achieved in each test. As you can see, the best result was achieved in the fusion test. Table 4 shows our method’s performance on each class, and Figure 3 shows the confusion matrix from the fusion result in the second test phase.
All results reported in this section were offi-cially submitted as part of the NLI Shared Task 2017.
6 Discussion
First of all, it is worth mentioning that all the re-sults reported in this paper were achieved with-out the use of i-vectors, and therefore the compar-isons between the results of our method with the baseline results are done only for essay, speech (transcriptions-only) and the fusion of essay and speech transcriptions.
Our implemented method is useful in the native language identification of essays (outperforming the baseline F1-score of 0.710), it does not per-form well on speech transcriptions (whose base-line F1-score is 0.544), and as a result the fusion of essays and transcriptions (with a baseline F1-score of 0.779). The reason for this can be the fact that in speech transcriptions, the file lengths vary much more than those of the essay files. The fact that, in our method, the length of the file can affect the probabilities can lead to this result.
As evident in Figure 1 to 3, most of the per-formance reduction was due to complications in telling Telugu and Hindi apart. Figure 2 shows that, in the speech track, both of these languages have very often been mistaken for each other; however, Figure 1 and 3 point to the fact that in the essay and fusion tracks, Hindi has been detected more accurately, while Telugu has often been la-beled as Hindi.
perfor-Language Precision Recall F1-Score
ARA 0.8333 0.6500 0.7303
CHI 0.7944 0.8500 0.8213
FRE 0.8400 0.8400 0.8400
GER 0.8125 0.9100 0.8585
HIN 0.5590 0.9000 0.6897
ITA 0.8966 0.7800 0.8342
JPN 0.8506 0.7400 0.7914
KOR 0.8182 0.7200 0.7660
SPA 0.7345 0.8300 0.7793
TEL 0.7778 0.4200 0.5455
TUR 0.6726 0.7600 0.7136
[image:4.595.194.405.61.241.2]Avg 0.7809 0.7636 0.7609
Table 1: Per Class Performance for the Essay Track
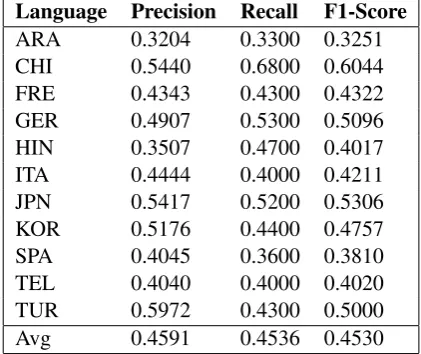
Language Precision Recall F1-Score
ARA 0.3204 0.3300 0.3251
CHI 0.5440 0.6800 0.6044
FRE 0.4343 0.4300 0.4322
GER 0.4907 0.5300 0.5096
HIN 0.3507 0.4700 0.4017
ITA 0.4444 0.4000 0.4211
JPN 0.5417 0.5200 0.5306
KOR 0.5176 0.4400 0.4757
SPA 0.4045 0.3600 0.3810
TEL 0.4040 0.4000 0.4020
TUR 0.5972 0.4300 0.5000
Avg 0.4591 0.4536 0.4530
Table 2: Per Class Performance for the Speech Track
mance on the speech dataset, it achieved optimal performance when implemented on the combina-tion of both essay and speech files in the fusion phase.
As explained in Section 3, our method is a rather simple one, compared to SVM and artificial neural networks. The combination of character N-grams and word N-N-grams used in our method is purely experimental, and does not take advantage of a strong mathematical basis.
All that being said, our method could still be used in combination with a form of supervised learning, in order to be more effective and achieve a decent accuracy rate.
7 Acknowledgement
We would like to express our sincere gratitude to Professor Leila Kosseim from Concordia Univer-sity, for her support and encouragement through this task.
References
Hessam Amini, Hadi Veisi, and Elham Moham-madi. 2016. Target words selection for a persian brain-computer-interface-based speller using lan-guage model. InInformation and Knowledge Tech-nology (IKT), 2016 Eighth International Conference on. IEEE, pages 216–220.
Daniel Blanchard, Joel Tetreault, Derrick Higgins, Aoife Cahill, and Martin Chodorow. 2013. Toefl11: A corpus of non-native english. Technical report, Educational Testing Service.
Peter F Brown, Peter V Desouza, Robert L Mercer, Vincent J Della Pietra, and Jenifer C Lai. 1992. Class-based n-gram models of natural language.
Computational Linguistics18(4):467–479.
Serhiy Bykh, Sowmya Vajjala, Julia Krivanek, and Detmar Meurers. 2013. Combining shallow and linguistically motivated features in native language identification.NAACL/HLT 2013page 197. Binod Gyawali, Gabriela Ram´ırez-de-la Rosa, and
[image:4.595.193.404.274.451.2]identifica-CHI JPN KOR HIN TEL FRE ITA SPA GER ARA TUR
Predicted label
CHI
JPN
KOR
HIN
TEL
FRE
ITA
SPA
GER
ARA
TUR
True label
85 3 1 8 1
2
6 74 9 2
4
5
6 7 72 2
3
2 8
1
90 6
1 1
1
4 1 1 31 42
5
9 7
2 1 84 3 7 3
5
6 78 4 5
2
6 1 3 4 83 2 1
1
4
1
1 91
2
2
3 6 1 1 2 8 2 65 10
3 1 2 5 2 5
1 4 1 76
Confusion Matrix
[image:5.595.143.456.65.343.2]0.0
0.1
0.2
0.3
0.4
0.5
0.6
0.7
0.8
0.9
Figure 1: The Confusion Matrix in the Essay Track
System F1-Score Accuracy
Essay 0.7609 0.7636 Speech 0.4530 0.4536 Fusion 0.7748 0.7764
Table 3: Results in the Second Test Phase
tion: a simple n-gram based approach. In BEA@ NAACL-HLT. pages 224–231.
John C Henderson, Guido Zarrella, Craig Pfeifer, and John D Burger. 2013. Discriminating non-native en-glish with 350 words. InBEA@ NAACL-HLT. pages 101–110.
Scott Jarvis, Yves Bestgen, and Steve Pepper. 2013. Maximizing Classification Accuracy in Native Lan-guage Identification. InProceedings of the Eighth Workshop on Innovative Use of NLP for Building Educational Applications. Association for Compu-tational Linguistics, Atlanta, Georgia, pages 111– 118.
Ekaterina Kochmar. 2011. Identification of a writer’s native language by error analysis. Master’s thesis, University of Cambridge.
Kristopher Kyle, Scott A Crossley, Jianmin Dai, and Danielle S McNamara. 2013. Native language iden-tification: A key n-gram category approach. In
BEA@ NAACL-HLT. pages 242–250.
Batia Laufer and Nany Girsai. 2008. Form-focused in-struction in second language vocabulary learning: A
case for contrastive analysis and translation. Applied Linguistics29(4):694–716.
Shervin Malmasi, Keelan Evanini, Aoife Cahill, Joel Tetreault, Robert Pugh, Christopher Hamill, Diane Napolitano, and Yao Qian. 2017. A Report on the 2017 Native Language Identification Shared Task. In Proceedings of the 12th Workshop on Building Educational Applications Using NLP. Association for Computational Linguistics, Copenhagen, Den-mark.
Bjrn Schuller, Stefan Steidl, Anton Batliner, Ju-lia Hirschberg, Judee K. Burgoon, Alice Baird, Aaron Elkins, Yue Zhang, Eduardo Coutinho, and Keelan Evanini. 2016. The INTER-SPEECH 2016 Computational Paralinguistics Challenge: Deception, Sincerity & Native Lan-guage. In Interspeech 2016. pages 2001–2005.
https://doi.org/10.21437/Interspeech.2016-129.
[image:5.595.222.377.388.444.2]Us-CHI JPN KOR HIN TEL FRE ITA SPA GER ARA TUR
Predicted label
CHI
JPN
KOR
HIN
TEL
FRE
ITA
SPA
GER
ARA
TUR
True label
68 4 8 4 2 3 3 5
3
15 52 7 4 5 4 2 2 1 6 2
13 14 44 4 3 5 1 7 1 6 2
3 1 3 47 22
5 5 5 6 3
3
2 31 40 4 2 5 1 9 3
3 6 2 6 4 43 6 7 10 5 8
2 1 1 7 4 9 40 7 13 12 4
6 6 9 4 5 8 9 36 6 7 4
3 5 4 4 3 9 8 7 53 4
3 5 4 11 7 10 11 7 6 33 3
6 2 1 12 4 4 3 1 12 12 43
Confusion Matrix
[image:6.595.145.457.78.360.2]0.00
0.08
0.16
0.24
0.32
0.40
0.48
0.56
0.64
Figure 2: The Confusion Matrix in the Speech Track
CHI JPN KOR HIN TEL FRE ITA SPA GER ARA TUR
Predicted label
CHI
JPN
KOR
HIN
TEL
FRE
ITA
SPA
GER
ARA
TUR
True label
91 2
7
7 80 4 1
1
2 2 1 2
7 6 77 2
2
3 3
89 9
1
1
2
37 41
4
12 4
1
1 1 82 2 9 3 1
3
6 76 7 6
2
5 1 2 6 81 2 2 1
4
1 1 2 92
1
1 10 2 8 2 8 1 65 2
1
8 2 3
5 1 80
Confusion Matrix
0.0
0.1
0.2
0.3
0.4
0.5
0.6
0.7
0.8
0.9
[image:6.595.143.456.435.714.2]Language Precision Recall F1-Score
ARA 0.7558 0.6500 0.6989
CHI 0.8273 0.9100 0.8667
FRE 0.7961 0.8200 0.8079
GER 0.8288 0.9200 0.8720
HIN 0.5329 0.8900 0.6667
ITA 0.8736 0.7600 0.8128
JPN 0.9091 0.8000 0.8511
KOR 0.9390 0.7700 0.8462
SPA 0.6983 0.8100 0.7500
TEL 0.7321 0.4100 0.5256
TUR 0.8511 0.8000 0.8247
[image:7.595.196.404.62.240.2]Avg 0.7949 0.7764 0.7748
Table 4: Per Class Performance for the Fusion Track (Best Result)
ing NLP. Association for Computational Linguis-tics, Atlanta, GA, USA.